. 2024 Feb 2;25(1):6.
doi: 10.1186/s12868-024-00846-3.

Tmem119 expression is downregulated in a subset of brain metastasis-associated microglia

Affiliations

Tmem119 expression is downregulated in a subset of brain metastasis-associated microglia

Weili Ma et al. BMC Neurosci. .

Abstract

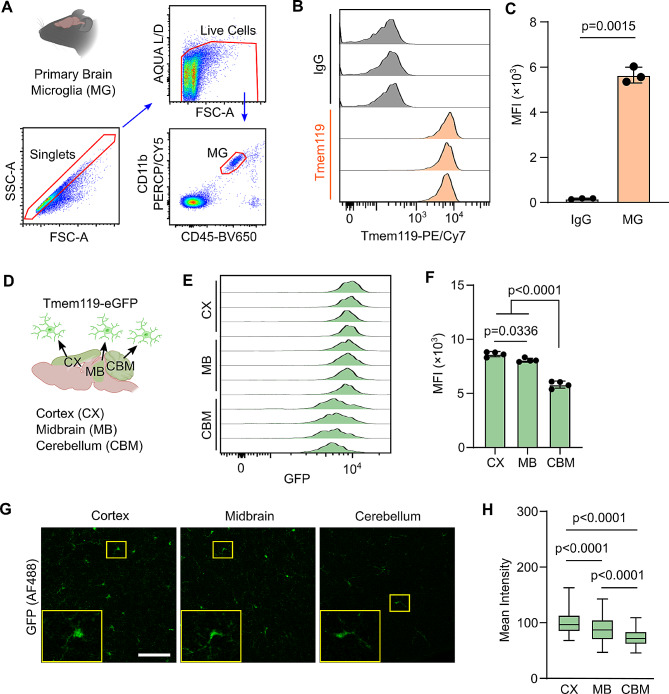
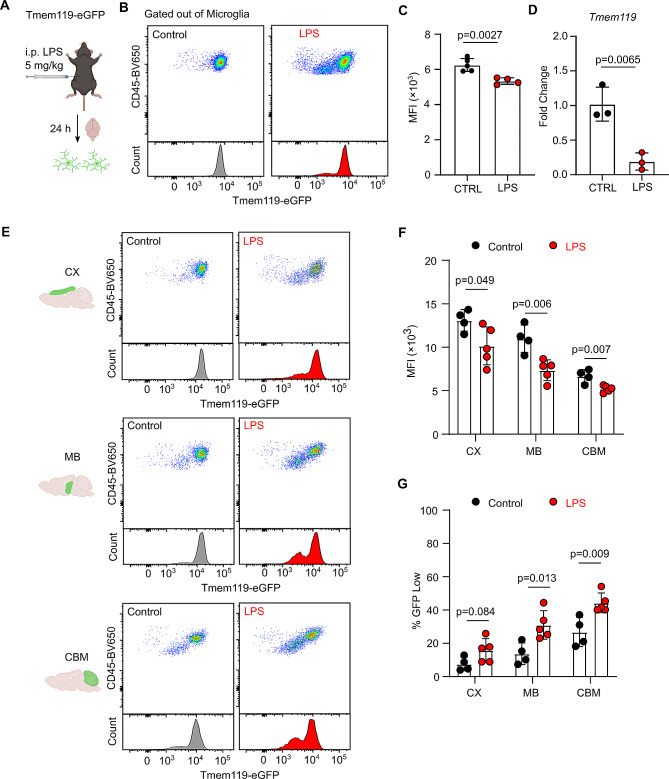
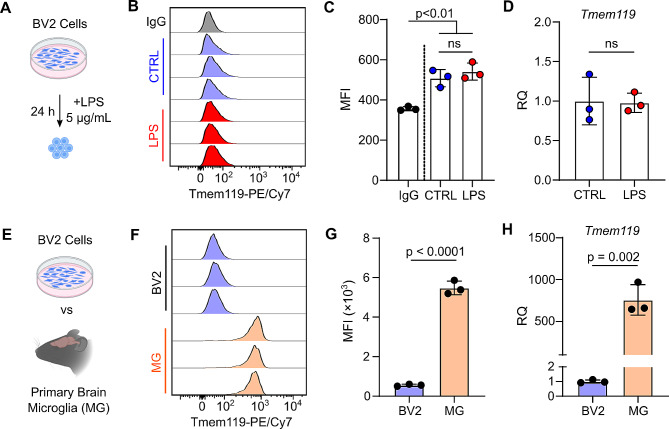
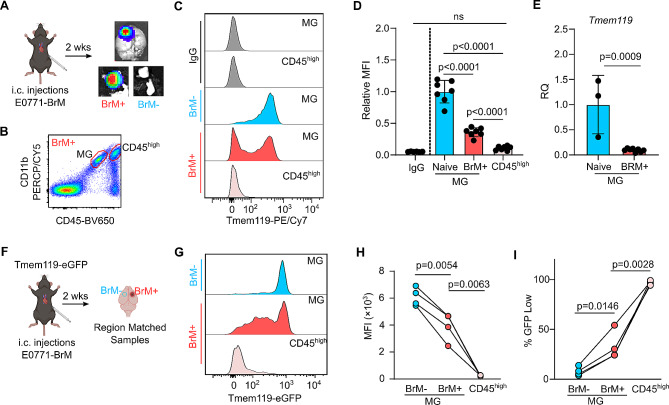
Under pathological conditions, the immune-specialized brain microenvironment contains both resident microglia and bone marrow-derived myeloid cells recruited from peripheral circulation. Due to largely overlapping phenotypic similarities between these ontogenically distinct myeloid populations, studying their individual functions in central nervous system diseases has been challenging. Recently, transmembrane protein 119 (Tmem119) has been reported as a marker for resident microglia which is not expressed by bone marrow-derived myeloid cells. However, several studies have reported the loss or reduction of Tmem119 expression in pathologically activated microglia. Here, we examined whether Tmem119 could be used as a robust marker to identify brain metastasis-associated microglia. In addition, we also compared Tmem119 expression of primary microglia to the immortalized microglia-like BV2 cell line and characterized expression changes after LPS treatment. Lastly, we used a commercially available transgenic mouse line (Tmem119-eGFP) to compare Tmem119 expression patterns to the traditional antibody-based detection methods. Our results indicate that brain metastasis-associated microglia have reduced Tmem119 gene and protein expression.

Keywords: Cancer; Metastasis; Microglia; Tmem119.


Conflict of interest statement

The authors declare no competing interests.

Figures

Fig. 1
Fig. 1
Basal Tmem119 expression in primary murine microglia (MG). (A) Gating strategy for primary microglia (CD45int CD11bpos) from mouse brains. (B) Representative flow cytometry histograms of Tmem119-PE/CY7 compared to isotype controls. (C) Quantification of Tmem119-PE/CY7 MFI. P value is the result of unpaired two-tailed T-test. Data are presented as mean ± S.D. N = 3 mice. (D) Microglia from cortex (CX), midbrain (MB), and cerebellum (CBM) of naïve Tmem119-eGFP transgenic mice were compared for Tmem119 expression levels. (E) Flow cytometry histograms of Tmem119-eGFP from microglia in various brain regions. (F) Quantification of Tmem119-eGFP MFI. P values are results of One-way ANOVA with Tukey HSD. Data are presented as mean ± S.D. N = 4 mice. (G) Representative immunofluorescence microscopy images of Tmem119-eGFP microglia in different brain regions. Scale bar = 80 μm. Insets (yellow borders): Enlarged area showing single microglia. (H) Quantification of GFP-staining intensity in microglia from different brain regions. P values are the result of one-way ANOVA with Tukey HSD. N = 285 CX microglia, N = 162 MB microglia, and N = 52 CBM microglia from 3 different sections per region
Fig. 2
Fig. 2
Changes in microglia Tmem119 expression after LPS treatment. (A) Tmem119-eGFP mice were treated with 5 mg/kg LPS for 24 h prior to analysis. (B) Representative flow cytometry dot plot and histogram of Tmem119-eGFP signal in control and LPS groups. (C) Quantification of Tmem119-eGFP MFI. P value is the result of unpaired two-tailed T-test. N = 4 mice per group. (D) RT-qPCR results of Tmem119 expression in microglia sorted from brains of control and LPS groups. P value is the result of unpaired two-tailed T-test. N = 3 mice per group. (E) Representative flow cytometry dot plot and histogram of Tmem119-eGFP in microglia from various brain regions in control and LPS groups. (F) Quantification of microglia Tmem119-eGFP MFI from various brain regions in control and LPS groups. P values are the result of unpaired two-tailed T-tests. N = 4 control and 5 LPS-treated mice. (G) Quantification of GFPlow microglia population in control and LPS groups from various brain regions. P values are the result of unpaired two-tailed T-tests. N = 4 control and 5 LPS-treated mice
Fig. 3
Fig. 3
BV2 cells do not recapitulate Tmem119-expression patterns of primary microglia. (A) BV2 cells were treated with 5 μg/mL LPS for 24 h and collected for experiments. (B) Flow cytometry histograms of Tmem119-PE/Cy7 on BV2 cells in control and LPS groups. (C) Quantification of BV2 Tmem119-PE/Cy7 MFI in control and LPS groups. P values are the result of one-way ANOVA with Tukey HSD. N = 3 replicates of BV2 cells. (D) RT-qPCR of Tmem119 expression in BV2 cells in control and LPS groups. P value is the result of unpaired two-tailed T-test. N = 3 replicates of BV2 cells. (E) Comparison of Tmem119 expression in BV2 cells and primary microglia. (F) Flow cytometry histogram of Tmem119-PE/Cy7 in BV2 cells and primary microglia. (G) Quantification of Tmem119-PE/Cy7 MFI in BV2 cells and primary microglia. P value is the result of unpaired two-tailed T-test. N = 3 replicates of BV2 cells and primary microglia from 3 mice. (H) Relative expression of Tmem119 detected by RT-qPCR in BV2 cells and primary microglia. P value is the result of unpaired two-tailed T-test. N = 3 replicates of BV2 cells and primary microglia from 3 mice
Fig. 4
Fig. 4
Microglia Tmem119 is downregulated in breast cancer brain metastasis. (A) Breast cancer brain metastases were established by intracardiac injection of E0771-BrM cells. Control tissue (BrM-) and tumor samples (BrM+) were collected based on ex vivo bioluminescence imaging. (B) Representative gating strategy used to identify microglia and infiltrating CD45high myeloid cells in BrM + samples. (C) Representative flow cytometry histogram of Tmem119-PE/Cy7 and isotype controls. (D) Quantification of Tmem119-PE/Cy7 MFI in the different cell populations. P values are the result of one-way ANOVA with Tukey HSD. Data are presented as mean ± S.D. N = 7 mice. (E) RT-qPCR analysis comparing relative quantities of Tmem119 in microglia sorted from naïve mice brains and BrM + samples. P values are the results of unpaired two-tailed T-test. Data are presented as mean ± S.D. N = 3 naïve mice and 8 BrM + samples. (F) Brain metastases were established in Tmem119-eGFP mice, and paired BrM- samples were collected from anatomically matched brain regions on the non-tumor-bearing hemisphere of the same animal. (G) Representative flow cytometry histogram of Tmem119-eGFP signal from BrM- MG, BrM + MG, and BrM + CD45high myeloid cells. (H) Quantification of Tmem119-eGFP MFI in the different cell populations. P values are the results of paired two-tailed T-tests. N = 4 mice. (I) Percentage of GFPlow populations in microglia and CD45high myeloid cells. P values are the results of paired two-tailed T-tests. N = 4 mice

References

    1. Kim SU, de Vellis J. Microglia in health and disease. J Neurosci Res. 2005;81(3):302–13. doi: 10.1002/jnr.20562. - DOI - PubMed
    1. Li Q, Barres BA. Microglia and macrophages in brain homeostasis and disease. Nat Rev Immunol. 2018;18(4):225– 42. Epub 20171120. 10.1038/nri.2017.125. PubMed PMID: 29151590. - PubMed
    1. Quail DF, Joyce JA. The Microenvironmental Landscape of Brain tumors. Cancer Cell. 2017;31(3):326–41. doi: 10.1016/j.ccell.2017.02.009. - DOI - PMC - PubMed
    1. Klemm F, Maas RR, Bowman RL, Kornete M, Soukup K, Nassiri S, Brouland JP, Iacobuzio-Donahue CA, Brennan C, Tabar V, Gutin PH, Daniel RT, Hegi ME, Joyce JA. Interrogation of the Microenvironmental Landscape in Brain Tumors reveals Disease-specific alterations of Immune cells. Cell. 2020;181(7):1643–60e17. doi: 10.1016/j.cell.2020.05.007. - DOI - PMC - PubMed
    1. Bowman RL, Klemm F, Akkari L, Pyonteck SM, Sevenich L, Quail DF, Dhara S, Simpson K, Gardner EE, Iacobuzio-Donahue CA, Brennan CW, Tabar V, Gutin PH, Joyce JA. Macrophage Ontogeny underlies differences in Tumor-Specific Education in Brain malignancies. Cell Rep. 2016;17(9):2445–59. doi: 10.1016/j.celrep.2016.10.052. - DOI - PMC - PubMed

Publication types