. 2024 Feb 2;25(1):42.
doi: 10.1186/s13059-024-03176-z.

Mapping the functional impact of non-coding regulatory elements in primary T cells through single-cell CRISPR screens

Affiliations

Mapping the functional impact of non-coding regulatory elements in primary T cells through single-cell CRISPR screens

Celia Alda-Catalinas et al. Genome Biol. .

Abstract

Background: Drug targets with genetic evidence are expected to increase clinical success by at least twofold. Yet, translating disease-associated genetic variants into functional knowledge remains a fundamental challenge of drug discovery. A key issue is that the vast majority of complex disease associations cannot be cleanly mapped to a gene. Immune disease-associated variants are enriched within regulatory elements found in T-cell-specific open chromatin regions.

Results: To identify genes and molecular programs modulated by these regulatory elements, we develop a CRISPRi-based single-cell functional screening approach in primary human T cells. Our pipeline enables the interrogation of transcriptomic changes induced by the perturbation of regulatory elements at scale. We first optimize an efficient CRISPRi protocol in primary CD4+ T cells via CROPseq vectors. Subsequently, we perform a screen targeting 45 non-coding regulatory elements and 35 transcription start sites and profile approximately 250,000 T -cell single-cell transcriptomes. We develop a bespoke analytical pipeline for element-to-gene (E2G) mapping and demonstrate that our method can identify both previously annotated and novel E2G links. Lastly, we integrate genetic association data for immune-related traits and demonstrate how our platform can aid in the identification of effector genes for GWAS loci.

Conclusions: We describe "primary T cell crisprQTL" - a scalable, single-cell functional genomics approach for mapping regulatory elements to genes in primary human T cells. We show how this framework can facilitate the interrogation of immune disease GWAS hits and propose that the combination of experimental and QTL-based techniques is likely to address the variant-to-function problem.

Keywords: CRISPR; CROPseq; Enhancer; GWAS; Regulatory element; T cells; Variant to function; crisprQTL; scRNA-seq.


Conflict of interest statement

C. A.-C., X. I.-S., C. F., J. E.-G., D. H., A. H., B. S., W. P., S. U., A. C., A. A., S. M., C. F., G. D., and R. R. are employees at GlaxoSmithKline. A. K. is an employee at Myllia Biotechnology.

Figures

Fig. 1
Fig. 1
A Schematic of the CRISPRi protocol in primary CD4+ T cells. B Histograms showing expression of the target gene (CD4, CD81, BST2) 10 days after gRNA transduction into primary CD4+ T cells expressing a CBh-ZIM3-dCas9 repressor construct, analyzed by flow cytometry. gRNA #1 and gRNA #2 refer to two different gRNA designs for a given TSS. The wild-type (WT) control are non-transduced cells stained with the same antibody for the corresponding target gene. C Quantification of the percentage of cells retaining cell surface expression of CD4, CD81, and BST2 at days 4, 6, 8, or 11 after transduction of a TSS-targeting gRNA (red) or NT control gRNA (gray) into primary CD4+ T cells expressing CBh-ZIM3-dCas9, analyzed by flow cytometry. Replicates are cells derived from four donors. Differences between non-targeting and targeting gRNAs are significant for all genes and timepoints (p-value < 0.00005, Bonferroni-Dunn test). D Normalized expression levels of the same target genes, measured by 10X Genomics 3′ scRNA-seq, 11 days after the corresponding targeting (red) or non-targeting (gray) gRNAs were transduced into primary CD4+ T cells expressing a CBh-ZIM3-dCas9 repressor construct. The dashed line indicates the median expression level in cells with non-targeting controls. The number of cells in each group is indicated at the top. Note gRNA #1 and #2 for CD81 TSS were analyzed together due to sequence similarity
Fig. 2
Fig. 2
A Schematic of the classes of loci targeted in the crisprQTL screen, including the locus control regions of CD2, enhancers linked to genes from Gasperini et al. [49], regulatory elements (intronic and intergenic) overlapping ENCODE cCREs, and gene transcription start sites (TSS). B Schematic of primary T cell crisprQTL experimental approach: CBh-ZIM3-dCas9 and the pooled gRNA library were introduced as described in Fig. 1A, and perturbed cells were analyzed by 10X Genomics 3′ scRNA-seq. C Proportion of cells where we confidently detected a single gRNA, multiple gRNAs, or none (unassigned, due to insufficient gRNA transcript recovery). D Distribution of the number of cells recovered with each gRNA in the pooled library. Numbers indicate, from top to bottom, the maximum, 75th, 50th, 25th quantiles, and minimum. E Same as D but for the number of cells per target (each target is targeted by four gRNAs)
Fig. 3
Fig. 3
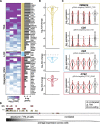
A Heatmap of the differential expression significance values (-log10 adjusted p-value) for each of the four gRNAs targeting each of the positive control perturbations, when comparing the expression of the expected gene in perturbed cells versus non-targeting controls. Different classes of targets are indicated by colored bars (TSS — yellow, LCR — blue and Gasperini enhancers — red). The barplots to the right indicate how many of the four gRNAs reach statistical significance. B Distributions of the log2 fold-change values for all expected genes from positive control perturbations, split by target class. C Representative examples of targets from each class. Normalized expression values in cells with targeting gRNAs (red) versus NT controls (gray) are shown. The title of the plot indicates the gene plotted. D Plot depicting the effect of gene expression levels on our ability to detect downregulation effects upon perturbation of TSS and non-coding targets. At the bottom, all genes in the human genome are ranked by decreasing average expression in the scRNA-seq dataset. Only genes detected in at least 5% of the cells (dark gray) were considered in the differential expression analyses. Non tested genes (light gray) include both genes not expressed in T cells and genes not detected by scRNA-seq. Then, expected genes in positive control perturbations that were significantly differentially expressed (***) are indicated, separately for TSS (yellow triangles) and non-coding control perturbations (red squares for Gasperini_ENH target genes, blue square for CD2). Above, expected genes that were detected but not recovered as significantly downregulated upon perturbation (NS)
Fig. 4
Fig. 4
A Distribution of the target-level adjusted p-values (FDR) for all significant element-to-gene (E2G) pairs detected, split by how many gRNAs have raw gRNA-level p-values < 0.05. E2G pairs supported by three or four gRNAs are high confidence (dark blue), E2G pairs supported by 2 gRNAs are medium confidence (blue), and E2G pairs supported by a single gRNA are low confidence (light blue) and were discarded from downstream analyses. B Barplot indicating the number of high and medium confidence significant differentially expressed genes (DEGs) detected for non-coding perturbations within 1 Mb up/downstream of the target site. Targets from Gasperini enhancers are shown in red; ENCODE cCREs are shown in orange if they lie within a gene intron and in yellow if they are intergenic. C Density plot of the distance between the E2G pairs, in kilobases. DEGs from targets of different classes are shown separately, as indicated by the same colors used in B. D Boxplots of the distance between E2G pairs (as in C) but split by whether the gene is the nearest expressed gene to the target. The median is indicated.
Fig. 5
Fig. 5
A Normalized expression values in the crisprQTL screen for cells with targeting (TGT) gRNAs (red) versus non-targeting (NT) controls (gray) for the four E2G links selected for orthogonal validation. B Schematic of experimental approach used to induce targeted element deletions in primary CD4.+ T cells, using gRNA/Cas9-nuclease ribonucleoprotein complexes (RNPs). The efficiency of the deletions was analyzed by PCR and automated electrophoresis. The perturbation-induced transcriptomic changes were assessed by bulk RNA-seq. C Automated electrophoresis analysis via TapeStation of the PCR products obtained after amplifying the targeted region in non-targeting (NT) control samples and CRISPR-deleted samples for four enhancer elements, across two donors (D1: donor 1; D2: donor 2). The size of the expected wild-type band is shown in brackets for each enhancer perturbation. D Normalized expression values for the DEG identified in the crisprQTL screen (A) in bulk RNA-seq data from cells with CRISPR deletion of the corresponding enhancer or with a NT control, across two donors. All four genes show the expected downregulation of expression, and three reach statistical significance (*adjusted p-value < 0.05)
Fig. 6
Fig. 6
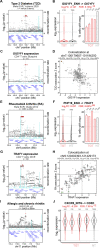
A GWAS regional association plot for type 2 diabetes (T2D) [69] highlighting the perturbed region with the gray line near GIGYF1. B On the left, violin plots showing the normalized expression values of GIGYF1 in cells expressing GIGYF1 enhancer targeting (TGT) gRNAs (red) versus non-targeting (NT) controls (gray). The number of cells in each group is indicated at the top of the violins. On the right, barplot indicating the proportion of cells with TGT or NT gRNAs where expression of GIGYF1 is detected (counts > 0). The number of cells in each group is indicated at the top, and an * indicates the perturbation was significant at the gRNA level. The target-level corrected p-value (FDR) of expression change and a summary log2 fold-change are indicated at the top. C eQTL regional association plot for GIGYF1 expression in naïve CD4+ T cells [33, 70], highlighting the perturbed region in a gray line. D Colocalization plot of the T2D GWAS signal (A) and GIGYF1 eQTL in naïve CD4+ T cells (C), showing that these signals have a 99% posterior probability of being shared. T2D risk colocalizes with decreased GIGYF1 transcript expression. E GWAS regional association plot for rheumatoid arthritis (RA) [71] highlighting the perturbed region in gray near PHF19 and TRAF1. F Same as B but for expression of TRAF1 in cells expressing PHF19 enhancer targeting (TGT) gRNAs (red) versus NT controls (gray). G eQTL regional association plot for TRAF1 expression in naïve CD4+ T cells, highlighting the perturbed region with a gray line [24, 72]. H Colocalization of the RA GWAS signal (E) and TRAF1 eQTL in naïve CD4+ T cells (G), showing that these signals have an 87% posterior probability of being shared. RA risk colocalizes with increased TRAF1 transcript expression. I GWAS regional association plot for allergic and chronic rhinitis [73] highlighting the perturbed area with a gray line near CXCR5. J Violin plots showing the normalized expression values of CD3D in cells expressing targeting (TGT) gRNAs for CXCR5 intergenic element (red) versus NT controls (gray). The number of cells in each group is indicated at the top, and an * indicates the perturbation was significant at the gRNA level. The target-level corrected p-value (FDR) of expression change and a summary log2 fold change are indicated at the top

Similar articles

Cited by

References

    1. Buniello A, MacArthur JAL, Cerezo M, Harris LW, Hayhurst J, Malangone C, et al. The NHGRI-EBI GWAS Catalog of published genome-wide association studies, targeted arrays and summary statistics 2019. Nucleic Acids Res. 2019;47(D1):D1005–D1012. doi: 10.1093/nar/gky1120. - DOI - PMC - PubMed
    1. Nelson MR, Tipney H, Painter JL, Shen J, Nicoletti P, Shen Y, et al. The support of human genetic evidence for approved drug indications. Nat Genet. 2015;47(8):856–860. doi: 10.1038/ng.3314. - DOI - PubMed
    1. Finan C, Gaulton A, Kruger FA, Lumbers RT, Shah T, Engmann J, et al. The druggable genome and support for target identification and validation in drug development. Science translational medicine. 2017;9(383):eaag1166. - PMC - PubMed
    1. Pritchard JE, O'Mara TA, Glubb DM. Enhancing the promise of drug repositioning through genetics. Front Pharmacol. 2017;8:896. doi: 10.3389/fphar.2017.00896. - DOI - PMC - PubMed
    1. King EA, Davis JW, Degner JF. Are drug targets with genetic support twice as likely to be approved? Revised estimates of the impact of genetic support for drug mechanisms on the probability of drug approval. PLoS Genet. 2019;15(12):e1008489. doi: 10.1371/journal.pgen.1008489. - DOI - PMC - PubMed

Publication types

MeSH terms