. 2024 Feb 2;16(1):21.
doi: 10.1186/s13073-024-01294-8.

Biological basis of extensive pleiotropy between blood traits and cancer risk

Affiliations

Biological basis of extensive pleiotropy between blood traits and cancer risk

Miguel Angel Pardo-Cea et al. Genome Med. .

Abstract

Background: The immune system has a central role in preventing carcinogenesis. Alteration of systemic immune cell levels may increase cancer risk. However, the extent to which common genetic variation influences blood traits and cancer risk remains largely undetermined. Here, we identify pleiotropic variants and predict their underlying molecular and cellular alterations.

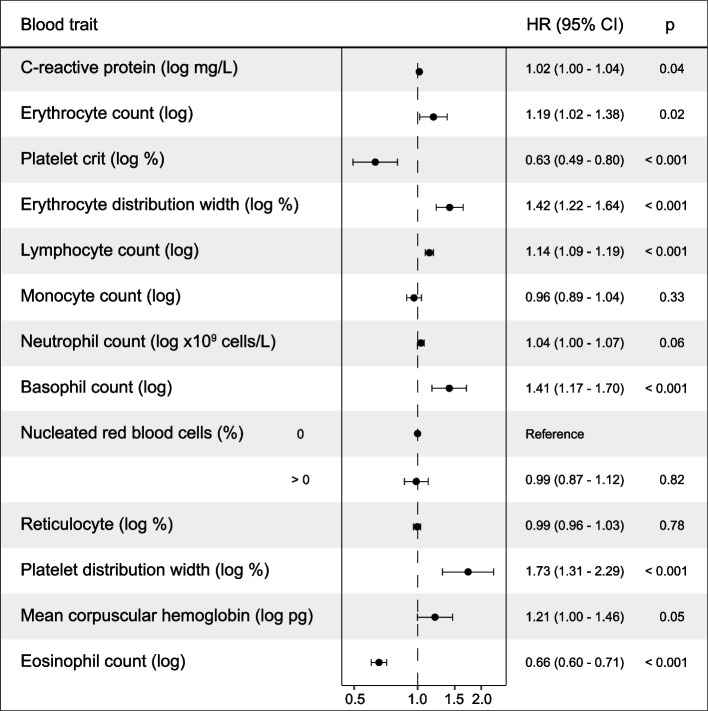
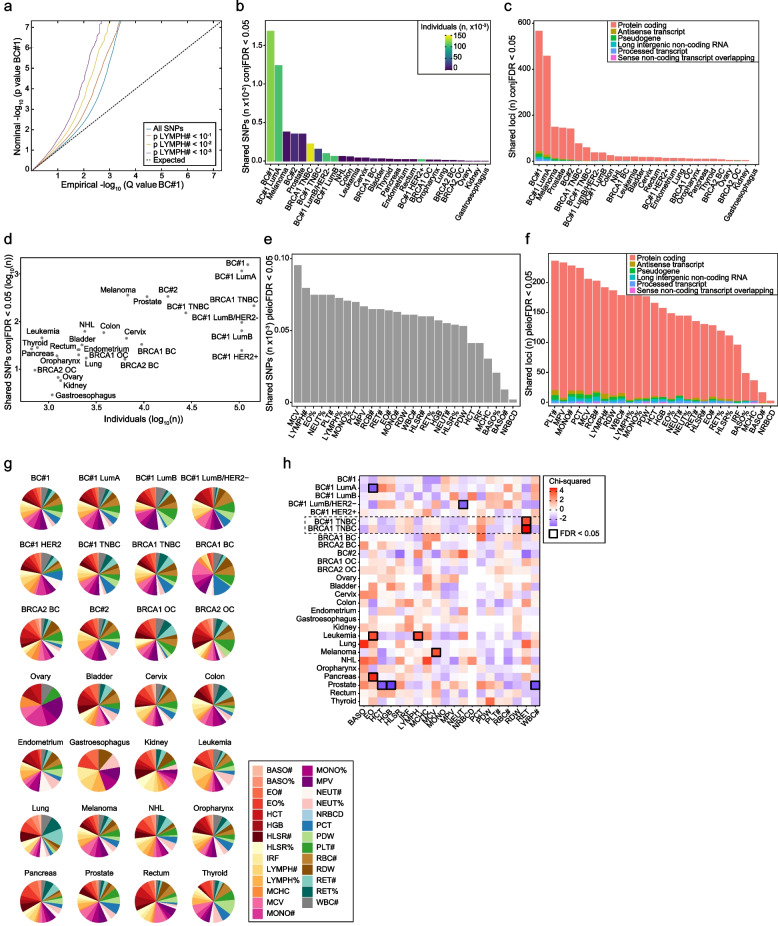
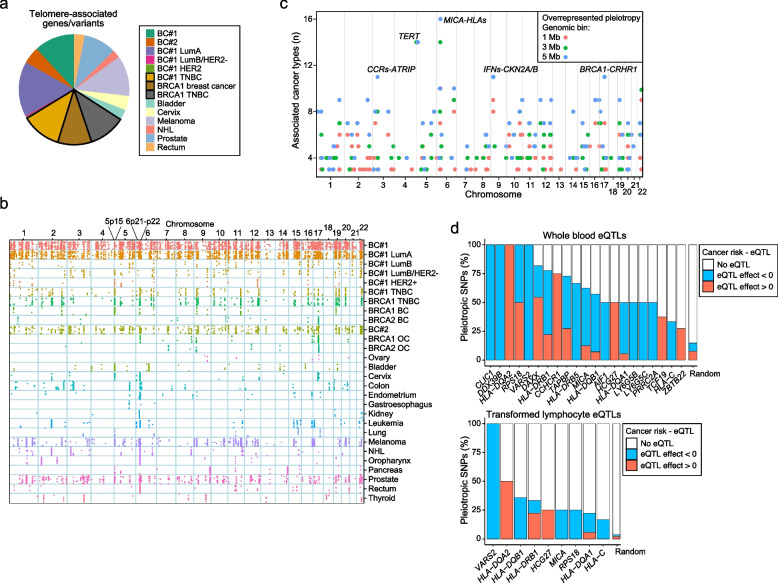
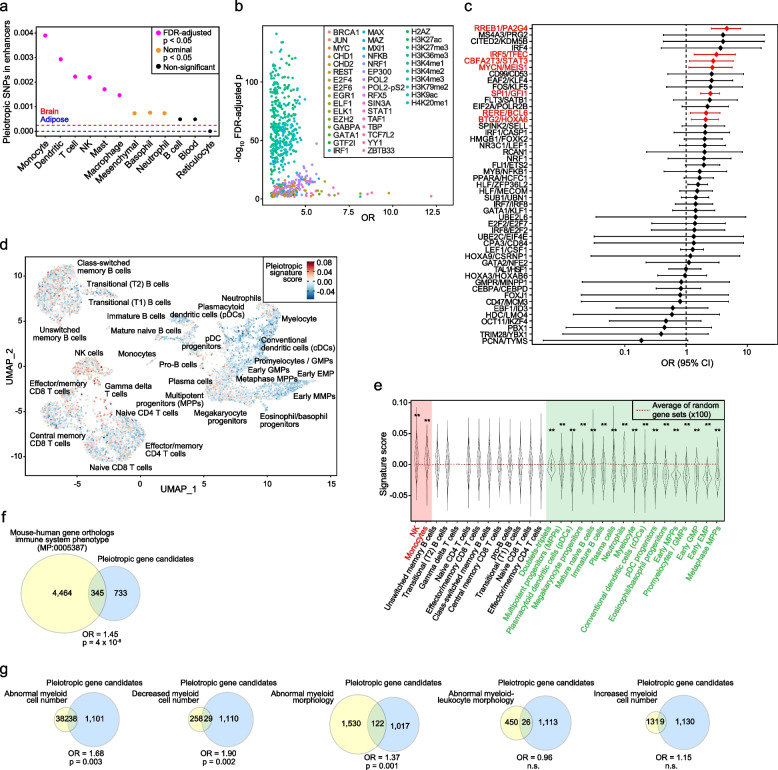
Methods: Multivariate Cox regression was used to evaluate associations between blood traits and cancer diagnosis in cases in the UK Biobank. Shared genetic variants were identified from the summary statistics of the genome-wide association studies of 27 blood traits and 27 cancer types and subtypes, applying the conditional/conjunctional false-discovery rate approach. Analysis of genomic positions, expression quantitative trait loci, enhancers, regulatory marks, functionally defined gene sets, and bulk- and single-cell expression profiles predicted the biological impact of pleiotropic variants. Plasma small RNAs were sequenced to assess association with cancer diagnosis.

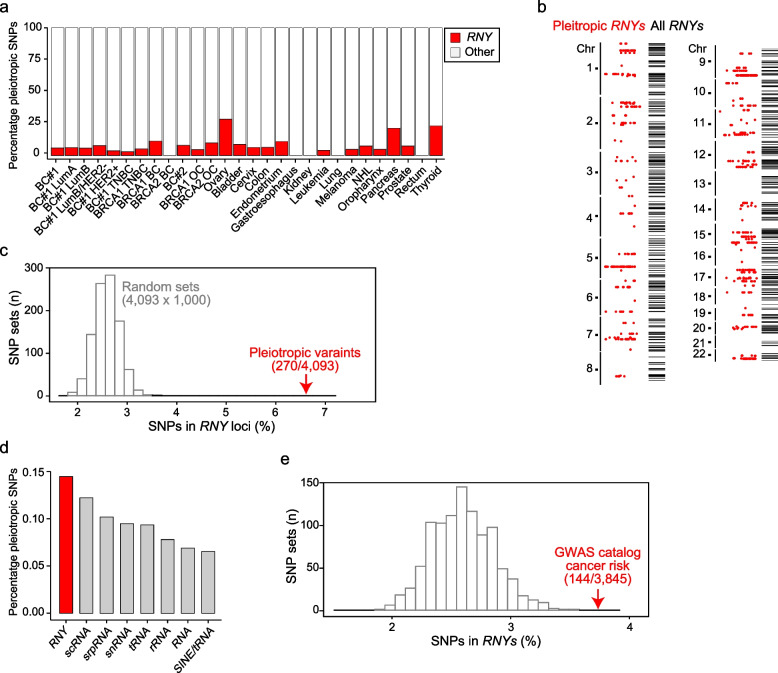
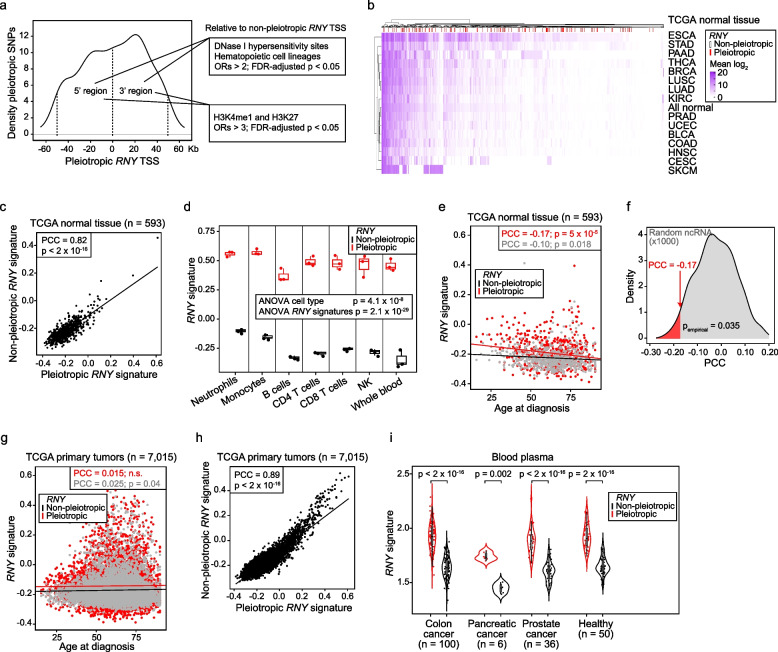
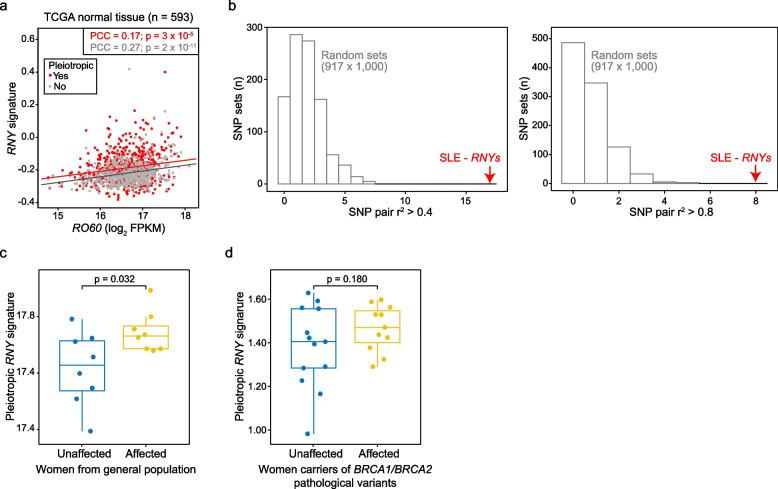
Results: The study identified 4093 common genetic variants, involving 1248 gene loci, that contributed to blood-cancer pleiotropism. Genomic hotspots of pleiotropism include chromosomal regions 5p15-TERT and 6p21-HLA. Genes whose products are involved in regulating telomere length are found to be enriched in pleiotropic variants. Pleiotropic gene candidates are frequently linked to transcriptional programs that regulate hematopoiesis and define progenitor cell states of immune system development. Perturbation of the myeloid lineage is indicated by pleiotropic associations with defined master regulators and cell alterations. Eosinophil count is inversely associated with cancer risk. A high frequency of pleiotropic associations is also centered on the regulation of small noncoding Y-RNAs. Predicted pleiotropic Y-RNAs show specific regulatory marks and are overabundant in the normal tissue and blood of cancer patients. Analysis of plasma small RNAs in women who developed breast cancer indicates there is an overabundance of Y-RNA preceding neoplasm diagnosis.

Conclusions: This study reveals extensive pleiotropism between blood traits and cancer risk. Pleiotropism is linked to factors and processes involved in hematopoietic development and immune system function, including components of the major histocompatibility complexes, and regulators of telomere length and myeloid lineage. Deregulation of Y-RNAs is also associated with pleiotropism. Overexpression of these elements might indicate increased cancer risk.

Keywords: Blood trait; Cancer; Eosinophil; Hematopoiesis; Myeloid; Pleiotropy; Telomere; Y-RNA.


Conflict of interest statement

The authors declare that they have no competing interests.

Figures

Fig. 1
Fig. 1
Study of association of blood traits with cancer diagnosis. Forest plot showing the associations between blood traits and cancer diagnosis in the UK Biobank (n = 364,791). The trait units, HR, 95% CI, and significance (p) of the multivariate Cox proportional model are indicated. The dataset was filtered, blood traits log2-transformed, and regression models stratified and adjusted as described in the “Methods”
Fig. 2
Fig. 2
Shared genetics of blood traits and cancer risk. a Stratified Q-Q plot for breast cancer risk (BC#1) as a function of the significance of SNP associations with LYMPH#, as indicated in the inset. The dotted line indicates no association. b Histogram depicting the number of variants (n ×10−3; conjFDR < 0.05) shared between cancer risk and blood traits. The colored bar indicates the number of individuals originally included in each cancer GWAS, as denoted in the inset. c Histogram depicting the distribution of classes of genetic elements (denoted in the inset) across the identified pleiotropic loci and cancer studies. d Plot depicting the relationship between the number (X-axis; log10) of individuals in each GWAS analyzed and the number of identified pleiotropic variants (conjFDR < 0.05; log10). e Histogram depicting the number of variants (n ×10−3; conjFDR < 0.05) shared by blood traits and cancer risk. f Histogram depicting the distribution of classes of genetic elements (denoted in the inset) across the identified pleiotropic loci and blood traits. g Pie charts showing the contribution of each blood trait to each cancer risk study based on the number of shared variants. Color-coded blood trait acronyms are depicted in the inset. h Heatmap showing the overrepresentation and underrepresentation of shared blood-trait variants for each cancer study. The significant associations (FDR-adjusted p < 0.05) are indicated by black-bordered squares
Fig. 3
Fig. 3
Link of pleiotropism with telomere length regulation and genomic hotspots. a Pie charts showing the contribution of pleotropic variants in telomere length-associated gene loci across the cancer studies. The proportion of variants associated with breast cancer caused by BRCA1 pathological variants and/or TNBC is denoted by solid triangles, as indicated in the inset. b Genomic diagram showing the relative position of the pleiotropic variants (dots) across human chromosomes 1–22 (X-axis) and cancer-risk studies (Y-axis). c Graph showing the identified pleiotropic hotspots across human chromosomes 1–22. Results are shown for the regions including associations with > 2 cancer types and corresponding to genomic bins of 1, 3, and 5 Mb, as indicated in the inset. The hotspots including > 10 cancer trait associations are denoted by candidate gene names. d Histograms showing the percentage of the 6p21-p22 pleiotropic variants identified as cis-eQTL in whole blood (left panel) or immortalized lymphocytes (right panel) of the corresponding 6p21-p22 genes (X-axis). The direction of the eQTL effect is defined by the slope color (inset). The indicated genes showed significant enrichment (FDR-adjusted p < 0.05) of pleiotropy-eQTL correspondences relative to equivalent randomly chosen variants in 1000 gene loci expressed in all major immune cell types
Fig. 4
Fig. 4
Link between pleiotropic gene candidates and hematopoiesis. a Graph showing the proportion of pleiotropic variants (all cancers included) mapped in enhancers from immune cell types and blood (X-axis). The pink dots indicate significant overlap, as indicated in the inset. The variant-enhancer overlap proportions in brain and adipose tissue are indicated by red and blue horizontal dashed lines, respectively. b Graph showing the overrepresented (−log10 FDR-adjusted p) genomic regulatory features (binding of transcription factors and defined histone marks, denoted in the inset) in the genomic sequences centered (± 10 base pairs) on the identified pleiotropic variants (n = 4,093). c Forest plot showing the OR and 95% CI of the overlap between the pleiotropic gene set and hematopoiesis gene modules, depicted by the corresponding master regulators (Y-axis). Red bars indicate significant overlap. d Uniform Manifold Approximation and Projection (UMAP) of the pleiotropic gene signature expression (score indicated in inset) in the bone marrow single-cell RNA sequencing profiles. Cell clusters are annotated. e Violin plot showing the distribution of the pleiotropic signature expression score in each bone marrow cell type (X-axis). The horizontal line corresponds to the average score of 100 random equivalent gene sets. The asterisks indicate a significant expression difference in the pleiotropic gene signature relative to equivalent random gene sets (**pempirical < 0.01). f Venn diagram showing the overlap between mouse gene orthologs that, when mutated, cause immune system alterations (MP:0005387; “immune system phenotype”) and the pleiotropic gene set (all cancers included). The OR and significance (phypergeometric) are indicated. g Venn diagrams showing the overlap between mouse gene orthologs linked to myeloid cell alterations (phenotypes are indicated) and the pleiotropic gene set (all cancers included). The OR and significance (phypergeometric) value are indicated; n.s., not significant
Fig. 5
Fig. 5
High frequency of pleiotropic variants in RNY-containing loci. a Histogram showing the relative contribution of pleiotropic variants (%; Y-axis) in RNY-containing loci (± 50 kb centered on each variant) across cancer studies (X-axis). b Genomic distribution of pleiotropic variants in RNY-containing loci (red dots) and all RNY-containing loci (horizontal bars) from chromosome (chr) 1 to 22. c Graph showing the percentage of variants (SNPs) mapped to RNYs (± 50 kb) in 1000 random sets of 8155 SNPs (European MAF > 0.01 and r2 < 0.8) and the observed percentage in the blood trait–cancer pleiotropy set (6.6%; 270/4,093). d Histogram showing the distribution of identified RNA repeat elements across the pleiotropic loci (4093 variants; ± 50 kb). The families of repeat elements are indicated (X-axis). e Graph showing the percentage of variants (SNPs) mapped to RNYs (± 50 kb) in 1000 random sets of 3847 SNPs (no filter criteria) and the observed percentage in the GWAS catalog of cancer risk variants (3.7%; 144/3,845)
Fig. 6
Fig. 6
Regulatory features and relative overexpression of pleiotropic RNYs. a Density distribution of the pleiotropic SNPs identified nearby (± 50 kb) RNY TSSs. The 5′ and 3′ 50-kb regions are delimited by vertical dashed lines. Genomic regulatory features found to be significantly enriched in each region are denoted in boxes. b Unsupervised hierarchical clustering of the average expression level of each pleiotropic and non-pleiotropic RNY transcript (as depicted in the inset) across normal tissue from TCGA (study acronyms are depicted on the Y-axis). c Scatter plot of the expression correlation between the pleiotropic and non-pleiotropic RNY signatures across normal tissue from TCGA. The PCC and corresponding significance (p) are indicated. d Box plots showing of the pleiotropic and non-pleiotropic RNY signature scores across primary immune cell populations isolated from whole blood. The two-way ANOVA comparisons and significance (p) are indicated. e Scatter plot of the correlation (PCC and p are indicated) between the pleiotropic or non-pleiotropic RNY expression signatures and age at diagnosis of cancer, using the corresponding normal tissue TCGA data. f Density distribution of the PCCs between equivalent random sets of microRNAs and age at diagnosis of cancer, using the normal tissue TCGA data (n = 593). The observed PCC for the pleiotropic RNY expression signature is indicated by an arrow, and the significant PCC tail and pempirical threshold are denoted. g Scatter plot of the correlation (PCC and p are indicated) between the pleiotropic or non-pleiotropic RNY signatures and age at diagnosis of cancer, using primary tumor TCGA data. h Scatter plot of the expression correlation between the pleiotropic and non-pleiotropic RNY signatures across TCGA primary tumors. The PCC and corresponding significance (p) are indicated. i Violin plot of the expression level of the pleiotropic and non-pleiotropic RNY signatures in blood plasma from cancer patients and healthy individuals, as indicated on the X-axis. Significance of the Wilcoxon rank test comparing the two signatures in each setting is shown
Fig. 7
Fig. 7
Pleiotropic RNYs are linked to SLE risk and plasma RNYs are relatively abundant preceding breast cancer diagnosis. a Scatter plot of the correlation of the levels of expression between RO60 and the pleiotropic or non-pleiotropic RNY signatures in TCGA normal tissue. The PCCs and p values are indicated. b Graphs showing the number of variants (SNPs) identified as pleiotropic in RNYs (± 50 kb) and correlated (European r2 > 0.4, left panel; r2 > 0.8, right panel) with SLE GWAS catalog variants, and compared with the results of equivalent 1000 random variant sets (European MAF > 0.01). c Box plot showing overexpression of the pleiotropic RNY signature in plasma of women who developed sporadic breast cancer (< 12 months after blood test) relative to matched controls who did not develop any neoplasm. The significance (p) of the Wilcoxon rank test is shown. d Box plot showing overexpression of the pleiotropic RNY signature in plasma of women carriers of pathological variants of BRCA1 and BRCA2 who developed breast cancer (< 12 months after blood test) relative to matched controls who did not develop any neoplasm. The significance (p) of the Wilcoxon rank test is shown

References

    1. Sharma P, Hu-Lieskovan S, Wargo JA, Ribas A. Primary, adaptive, and acquired resistance to cancer immunotherapy. Cell. 2017;168:707–723. doi: 10.1016/j.cell.2017.01.017. - DOI - PMC - PubMed
    1. van Weverwijk A, de Visser KE. Mechanisms driving the immunoregulatory function of cancer cells. Nat Rev Cancer. 2023;23:193–215. doi: 10.1038/s41568-022-00544-4. - DOI - PubMed
    1. Swann JB, Smyth MJ. Immune surveillance of tumors. J Clin Invest. 2007;117:1137–1146. doi: 10.1172/JCI31405. - DOI - PMC - PubMed
    1. Dighe AS, Richards E, Old LJ, Schreiber RD. Enhanced in vivo growth and resistance to rejection of tumor cells expressing dominant negative IFN gamma receptors. Immunity. 1994;1:447–456. doi: 10.1016/1074-7613(94)90087-6. - DOI - PubMed
    1. van den Broek ME, Kägi D, Ossendorp F, Toes R, Vamvakas S, Lutz WK, et al. Decreased tumor surveillance in perforin-deficient mice. J Exp Med. 1996;184:1781–1790. doi: 10.1084/jem.184.5.1781. - DOI - PMC - PubMed

Publication types