. 2024 Apr:70:103054.
doi: 10.1016/j.redox.2024.103054. Epub 2024 Jan 22.

Targeting the ACOD1-itaconate axis stabilizes atherosclerotic plaques

Affiliations

Targeting the ACOD1-itaconate axis stabilizes atherosclerotic plaques

Karl J Harber et al. Redox Biol. 2024 Apr.

Abstract

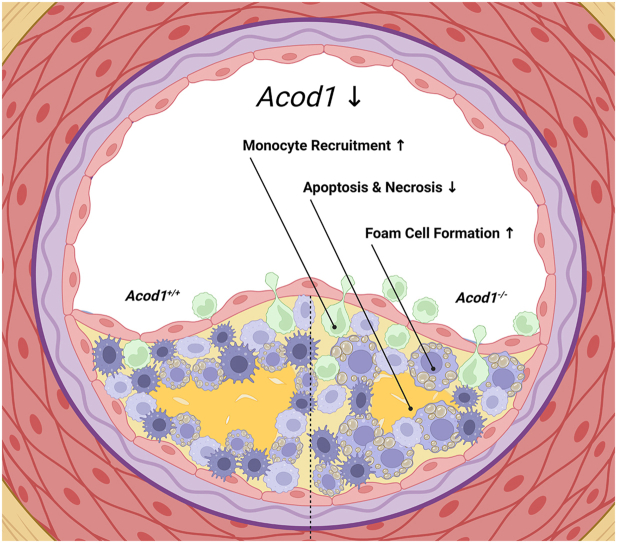
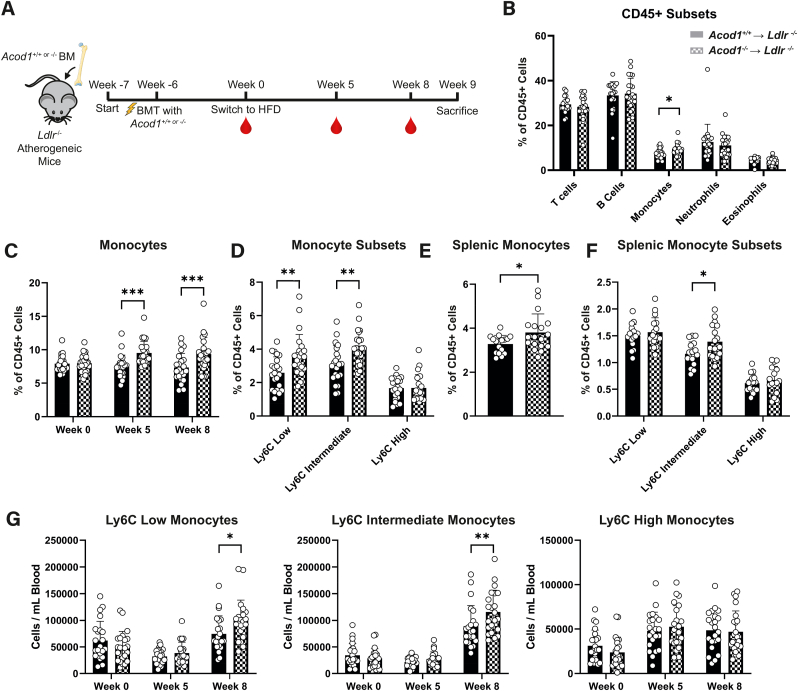
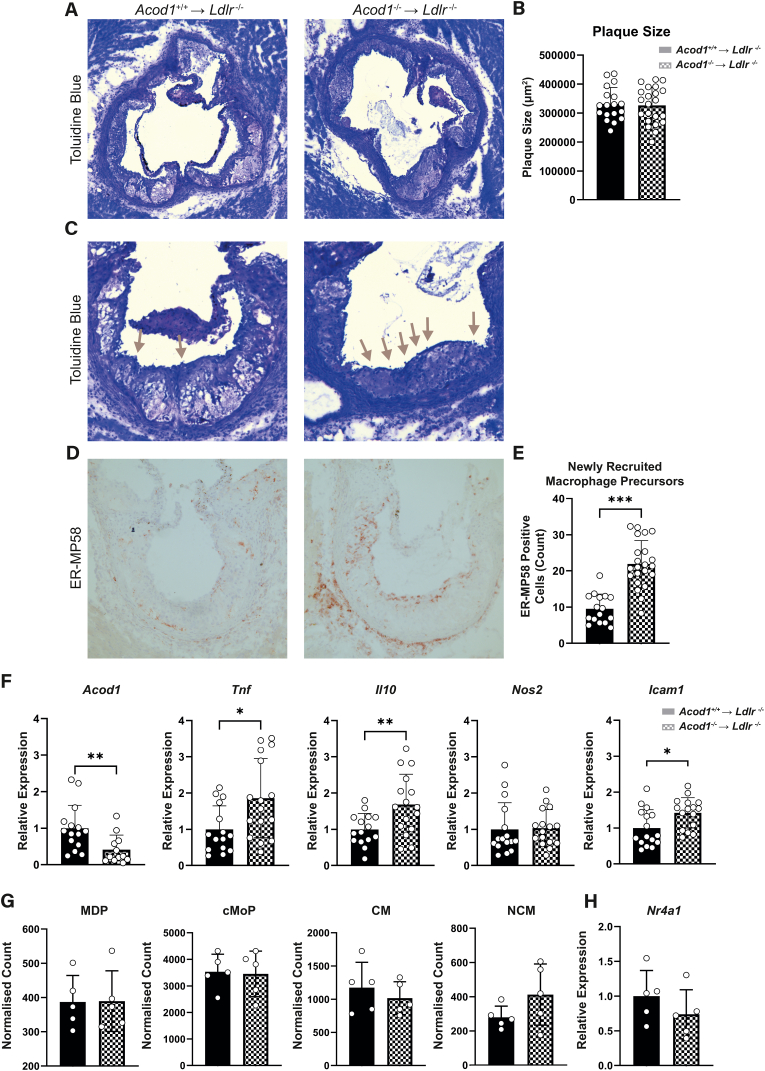
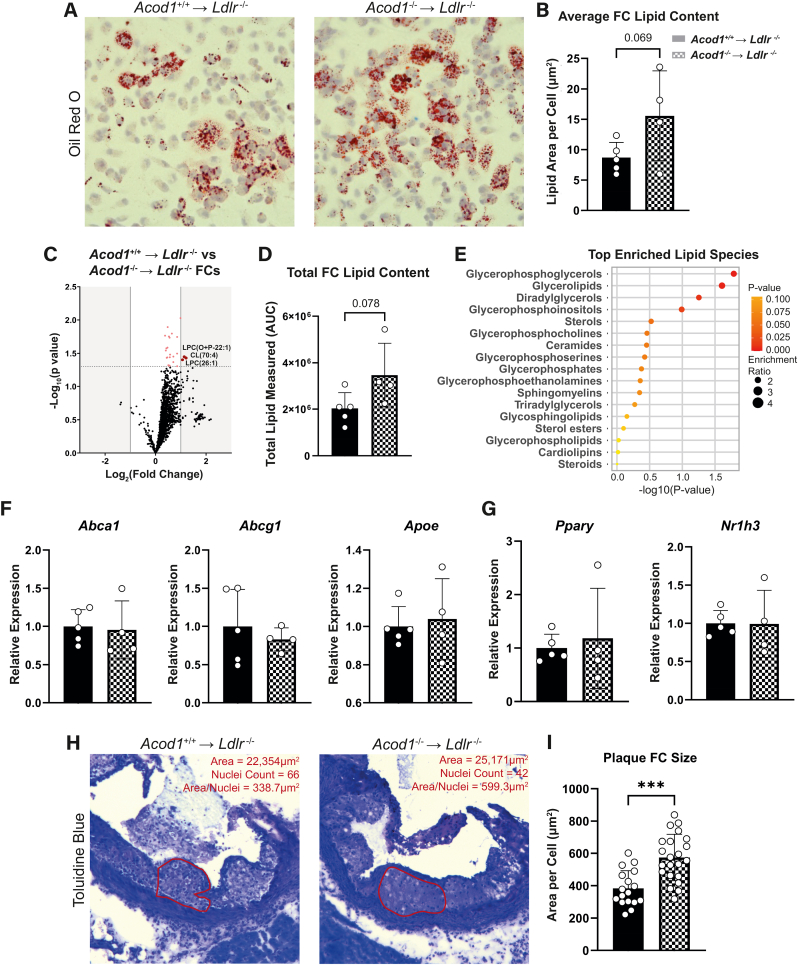
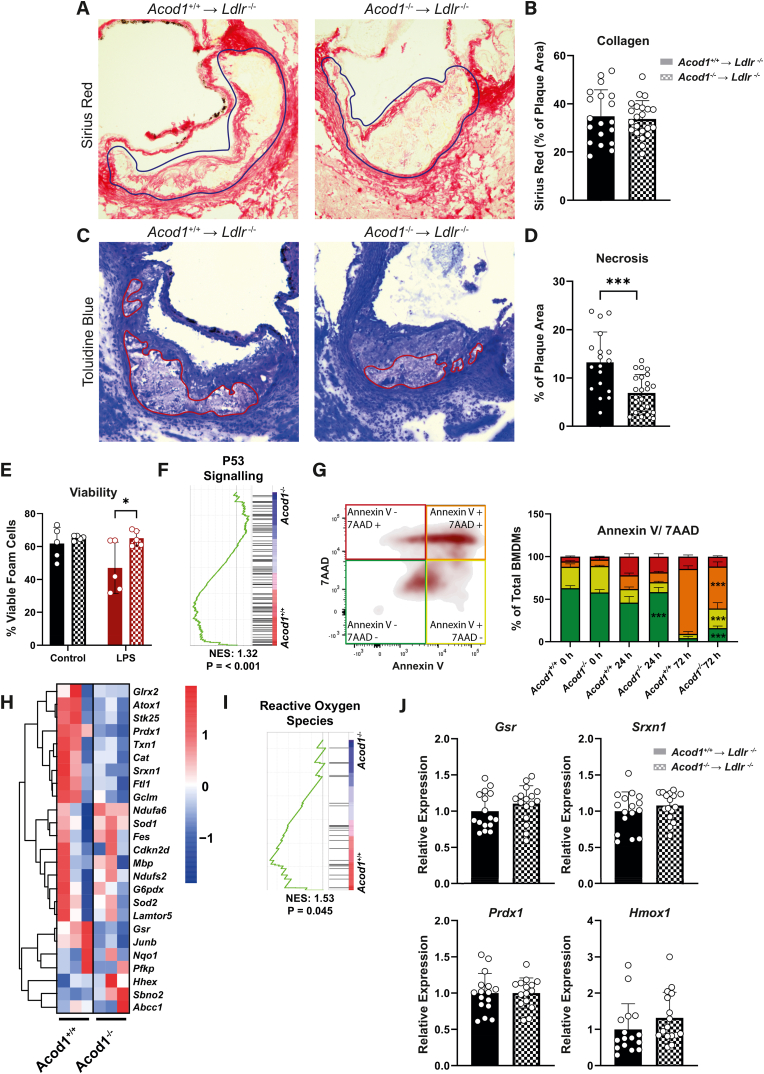
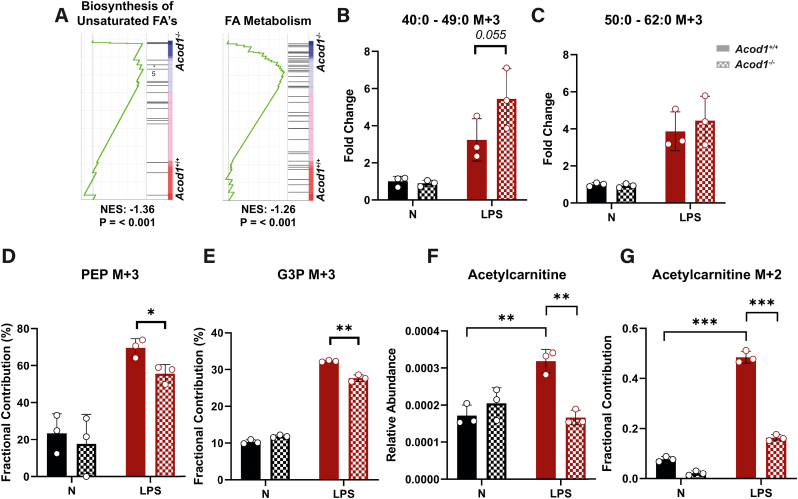
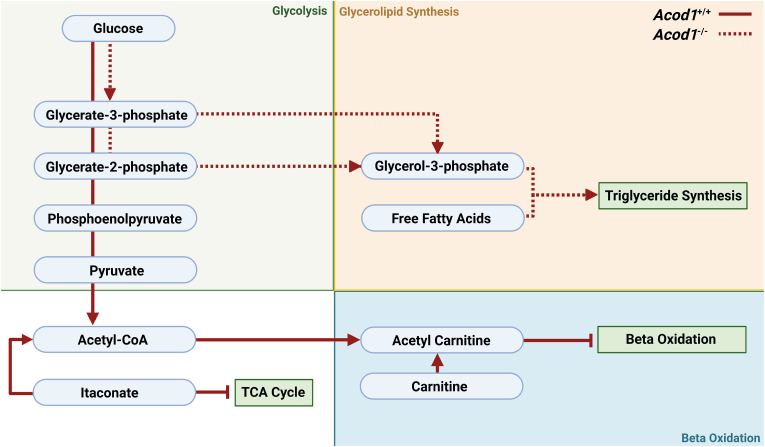
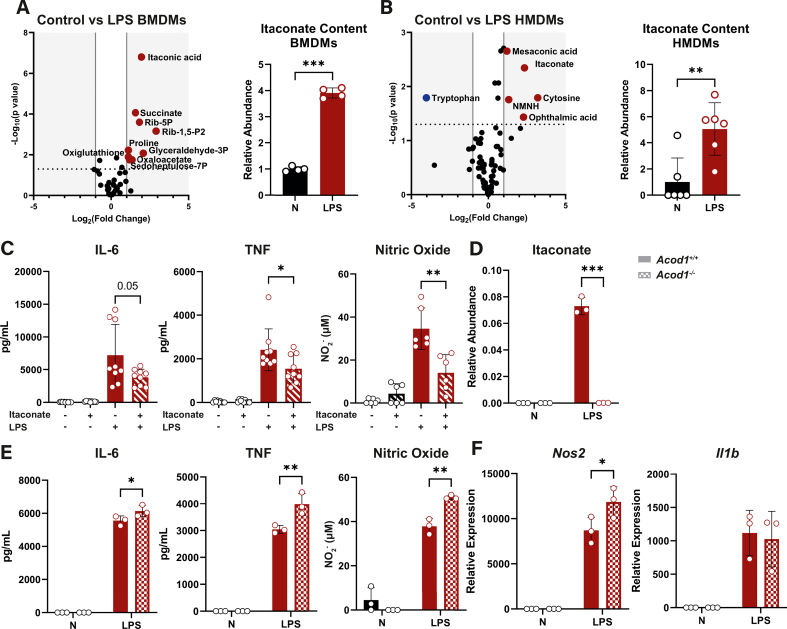
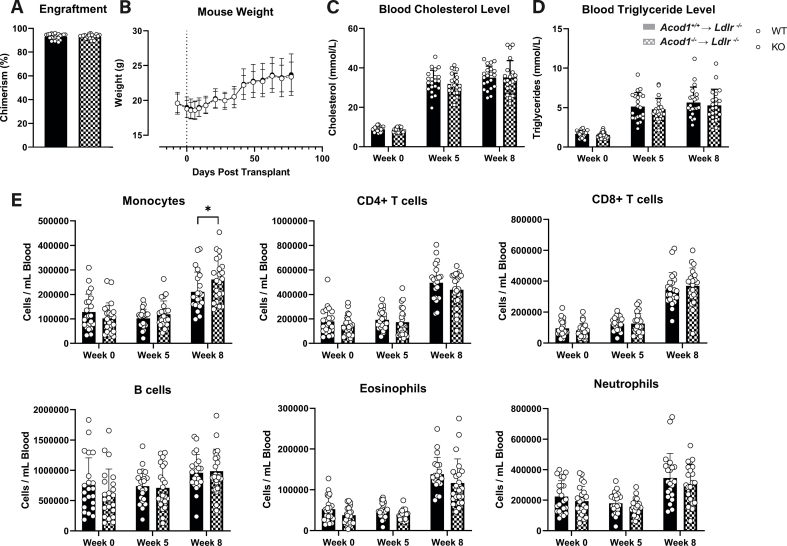
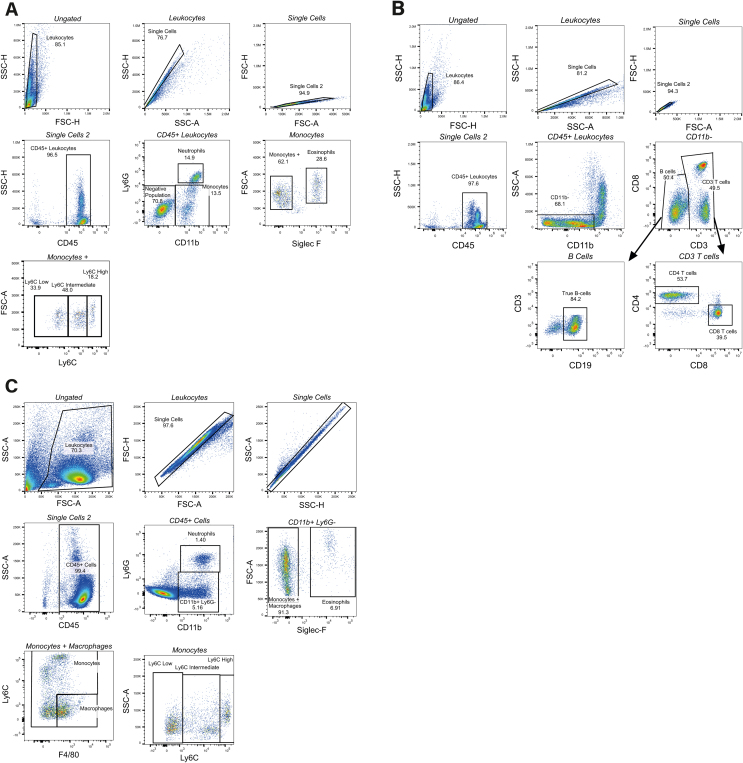
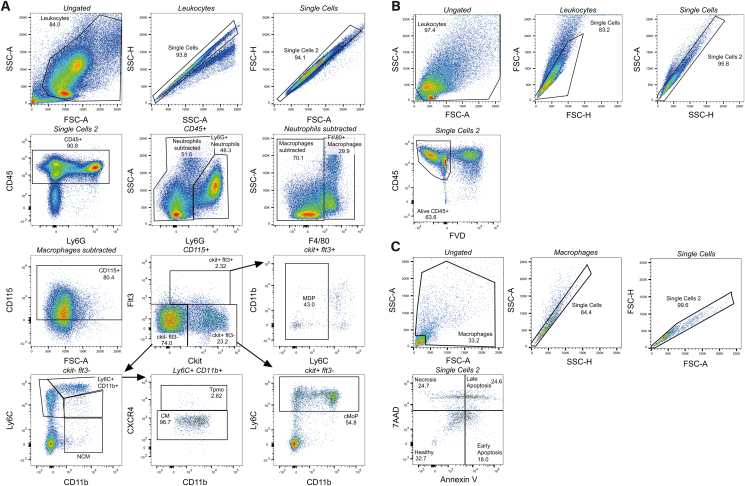
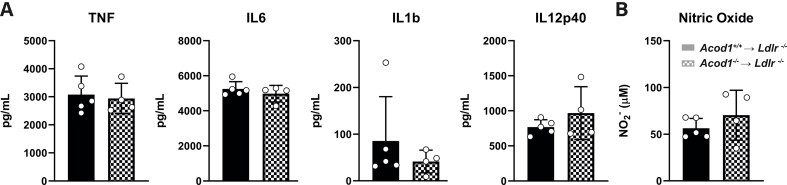
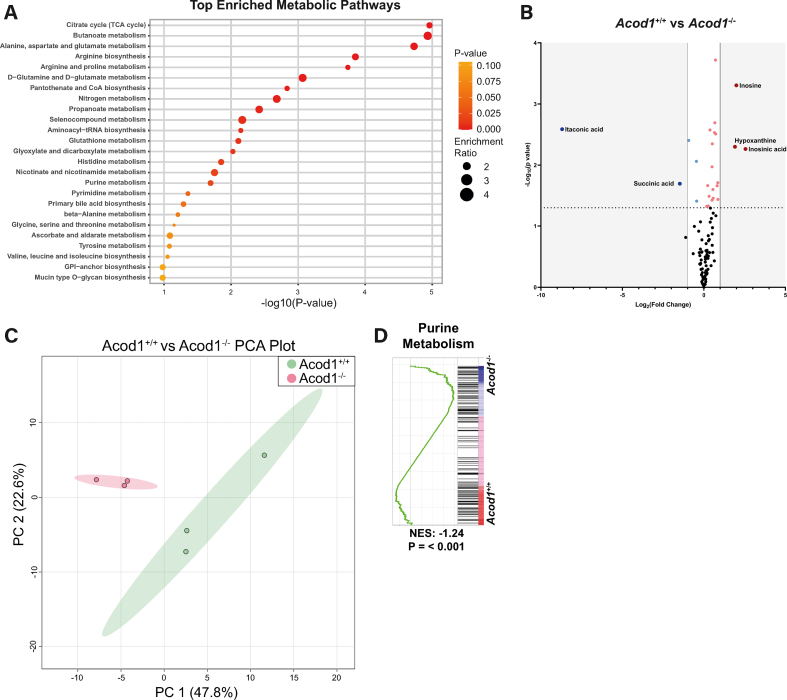
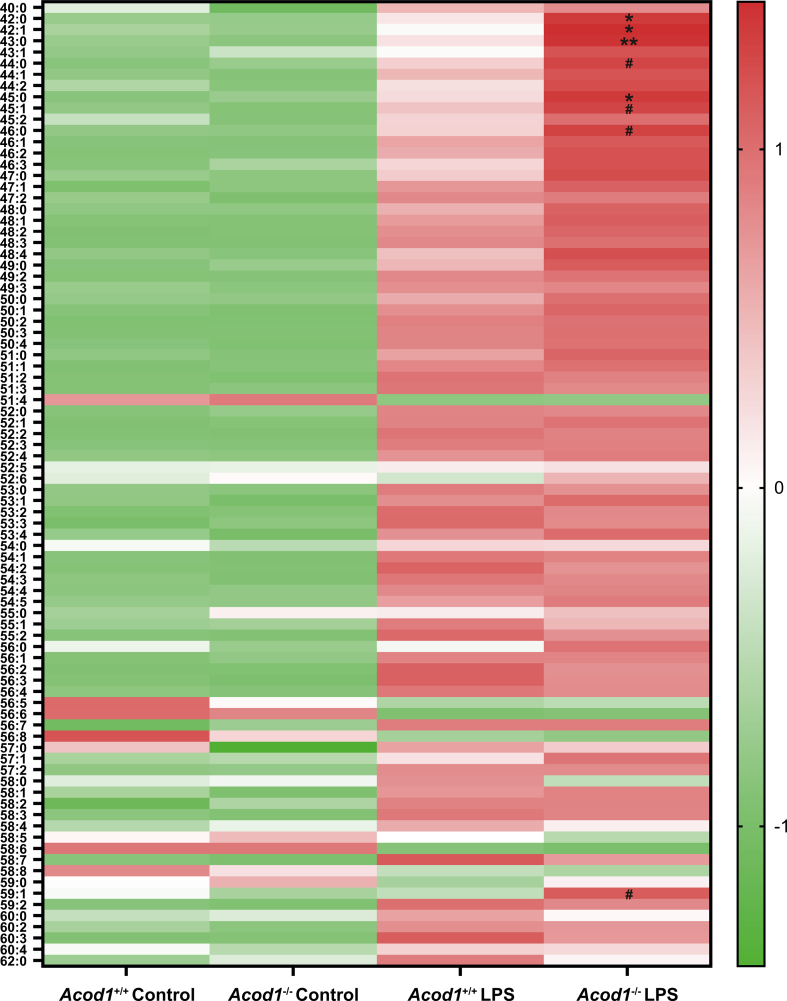
Inflammatory macrophages are key drivers of atherosclerosis that can induce rupture-prone vulnerable plaques. Skewing the plaque macrophage population towards a more protective phenotype and reducing the occurrence of clinical events is thought to be a promising method of treating atherosclerotic patients. In the current study, we investigate the immunomodulatory properties of itaconate, an immunometabolite derived from the TCA cycle intermediate cis-aconitate and synthesised by the enzyme Aconitate Decarboxylase 1 (ACOD1, also known as IRG1), in the context of atherosclerosis. Ldlr-/- atherogenic mice transplanted with Acod1-/- bone marrow displayed a more stable plaque phenotype with smaller necrotic cores and showed increased recruitment of monocytes to the vessel intima. Macrophages from Acod1-/- mice contained more lipids whilst also displaying reduced induction of apoptosis. Using multi-omics approaches, we identify a metabolic shift towards purine metabolism, in addition to an altered glycolytic flux towards production of glycerol for triglyceride synthesis. Overall, our data highlight the potential of therapeutically blocking ACOD1 with the aim of stabilizing atherosclerotic plaques.

Keywords: Acod1; Atherosclerosis; IRG1; Immunometabolism; Itaconate; Macrophage.


Conflict of interest statement

Declaration of competing interest The authors declare that they have no known competing financial interests or personal relationships that could have appeared to influence the work reported in this papr.

Figures

Image 1
Graphical abstract
Fig. 1
Fig. 1
Ldlr−/−mice transplanted with Acod1−/−bone marrow contain more circulating and splenic Ly6cLowpatrolling monocytes. A) Irradiated atherosclerosis-susceptible Ldlr−/− mice were transplanted with either Acod1+/+ or Acod1−/− bone marrow (BM) and were given 6 weeks for efficient engraftment prior to initiating a high-fat diet (HFD). Blood samples are taken on weeks 0, 5 and 8 of HFD and mice were sacrificed on week 9. B) leukocyte subsets in Acod1+/+Ldlr−/− (filled) or Acod1−/−Ldlr−/− (checkered) mice at week 8 expressed as a percentage of circulating CD45+ cells (n = 22/23 for Acod1+/+Ldlr−/−/Acod1−/−Ldlr−/−, unpaired t-test). C) Blood monocytes in Acod1+/+Ldlr−/− (filled) or Acod1−/−Ldlr−/− (checkered) mice at week 0, 5 and 8 expressed as a percentage of circulating CD45+ cells (n = 22/23 for Acod1+/+Ldlr−/−/Acod1−/−Ldlr−/−, two-way ANOVA). D) Blood Ly6C monocyte subsets in Acod1+/+Ldlr−/− (filled) or Acod1−/−Ldlr−/− (checkered) mice at week 8 expressed as a percentage of circulating CD45+ cells (n = 22/23, two-way ANOVA). E) Splenic monocytes in Acod1+/+Ldlr−/− (filled) or Acod1−/−Ldlr−/− (checkered) BM expressed as a percentage of splenic CD45+ cells (n = 17/18, unpaired t-test). F) Splenic Ly6C monocyte subsets in Acod1+/+Ldlr−/− (filled) or Acod1−/−Ldlr−/− (checkered) mice expressed as a percentage of splenic CD45+ cells (n = 17/18, two-way ANOVA). G) Ly6C low (left), intermediate (middle) and high (right) counts per mL of blood in Acod1+/+Ldlr−/− (filled) or Acod1−/−Ldlr−/− (checkered) mice at weeks 0, 5 and 8 of HFD (n = 22/23, two-way ANOVA). Gating strategies for flow cytometry is provided in Supplemental Fig. 3. Data points display individual mice and error bars show SD.
Fig. 2
Fig. 2
Acod1−/−transplanted Ldlr−/−mice have increased monocyte recruitment to the plaque. A) Aortic root segments were taken from Acod1+/+Ldlr−/− (left) and Acod1−/−Ldlr−/− (right) mice and stained with toluidine blue to B) quantify total plaque size of all 3 valve cusps (n = 18/22 for Acod1+/+Ldlr−/−/Acod1−/−Ldlr−/−, unpaired t-test). C) One of the three valve cusps from the toluidine blue staining displaying luminal adhesion of monocytes (grey arrows). D) Immunohistochemical staining of monocyte antigen ER-MP58 (brown) which was then E) quantified by counting the number of positive cells on the luminal endothelium and within the plaque (n = 16/22, unpaired t-test). F) Gene expression of inflammatory and migration markers from mouse aortic arches (n = 15/16, unpaired t-test). G) Flow cytometry quantification of bone marrow myeloid precursors normalized to CD45+ count (n = 5, unpaired t-test). H) qPCR-derived gene expression of monocyte developmental marker Nr4a1 in isolated peritoneal foam cells (FCs) (n = 5, unpaired t-test). Gating strategies for flow cytometry is provided in Supplemental Fig. 4. Data points display individual mice and error bars show SD. MDP = Monocyte and Dendritic Progenitor; CMP = Common Monocyte Progenitor; CM = Classical Monocyte; NCM = Non-Classical Monocyte. (For interpretation of the references to colour in this figure legend, the reader is referred to the Web version of this article.)
Fig. 3
Fig. 3
Itaconate deficiency leads to increased lipid content in foam cells. A) Oil red O staining of peritoneal foam cells (FCs) from Acod1+/+Ldlr−/− (left) and Acod1−/−Ldlr−/− (right) mice, B) quantified by calculating lipid area per nucleus stained with hematoxylin (n = 5/4 for Acod1+/+Ldlr−/−/Acod1−/−Ldlr−/−, unpaired t-test). C) Volcano plot of lipidomics from FCs (red = increased in Acod1−/−Ldlr−/−; blue = decreased in Acod1−/−Ldlr−/−; grey = not significant). Dotted line represents significance cut-off (p < 0.05). D) Total lipid content measured in all lipid species from lipidomics (n = 5/4, unpaired t-test). E) Lipid species enrichment analysis from the lipidomics dataset. F) qPCR-derived gene expression of proteins involved in lipid transport and G) their accompanying transcription factors from FCs (n = 5/4, unpaired t-test). H) One of the three aortic root valve cusps in Acod1+/+Ldlr−/− (left) and Acod1−/−Ldlr−/− (right) transplanted mice stained with toluidine blue where an area of foam cells (red) was measured and nuclei were counted to I) calculate cell size (area/nuclei count; n = 17/22, unpaired t-test). Data points display individual mice and error bars show SD. FC = Foam Cell; AUC = Area Under the Curve; NES = Normalized Enrichment Score. (For interpretation of the references to colour in this figure legend, the reader is referred to the Web version of this article.)
Fig. 4
Fig. 4
Acod1 deficiency reduces apoptosis and necrosis. A) Aortic root segments were stained for Sirius Red to B) quantify red collagen staining area as a percentage of the plaque area (blue outline), expressed as an average of the three valve cusps in Acod1+/+Ldlr−/− (left) and Acod1−/−Ldlr−/− (right) mice (n = 19/22 for Acod1+/+Ldlr−/−/Acod1−/−Ldlr−/−, unpaired t-test). C) Necrotic core outlined (red) on one of the three aortic root valve cusps stained with toluidine blue which was then D) quantified as a percentage of the total plaque and expressed as an average of the three cusps (n = 18/22, unpaired t-test). E) Cell viability in unstimulated (black) or LPS (100 ng/mL) stimulated (red) FCs after 24 h, measured via flow cytometry analysis of fixable viability dye (FVD) eFluor™ 780 (n = 5, two-way ANOVA). F) P53 signaling pathway enrichment from a gene set enrichment analysis of dataset GSE145950 by Swain et al., 2020 comparing LPS-stimulated Acod1+/+ and Acod1−/− BMDMs. G) Flow cytometry quantification of an Annexin V/7AAD apoptosis and necrosis assay on in vitro cultured Acod1+/+ and Acod1−/− BMDMs stimulated with LPS (100 ng/mL) over 72 h (n = 3, two-way ANOVA). H) Gene expression heatmap of reactive oxygen species-related markers and I) subsequent gene set enrichment analysis comparing LPS stimulated Acod1+/+ and Acod1−/− BMDMs from dataset GSE145950 by Swain et al., 2020. J) qPCR derived gene expression of redox markers from mouse aortic arches (n = 15/16, unpaired t-test). Gating strategies for flow cytometry is provided in Supplemental Fig. 4. Data points display individual mice and error bars show SD. (For interpretation of the references to colour in this figure legend, the reader is referred to the Web version of this article.)
Fig. 5
Fig. 5
Broken glycolysis towards triglyceride synthesis may explain increased macrophage lipid content. A) Gene set enrichment analysis of de novo fatty acid (FA) synthesis-related pathways of dataset GSE145950 by Swain et al., 2020. B) Total M+3 fraction fold change of triglycerides with carbon content of either 40–49 carbons or C) 50–62 carbons from a lipid based fluxomics using 13C-glucose isotopic labeling in Acod1+/+ and Acod1−/− BMDMs stimulated with or without LPS (100 ng/ml) for 24 h (n = 3, two-way ANOVA). D) Fractional contribution of M+3 phosphoenolpyruvate (PEP) and E) M+3 glycerol-3-phosphate (G3P) in fluxomics of Acod1+/+ and Acod1−/− BMDMs stimulated with or without LPS (100 ng/ml) for 24 h and cultured with 13C-glucose for isotope labelling (n = 3, two-way ANOVA). F) Relative abundance of metabolite acetylcarnitine from the metabolomics dataset and G) the fractional contribution of M+2 acetyl carnitine in the total pool of acetylcarnitine isotopes from the fluxomics dataset (n = 3, two-way ANOVA). Data points display individual mice and error bars show SD.
Fig. 6
Fig. 6
Glycolytic flux in Acod1+/+and Acod1−/−inflammatory BMDMs. Schematic of glucose flux in inflammatory (LPS) Acod1+/+ (solid red) and Acod1−/− (dashed red) BMDMs. Arrows display where differences in glucose flux occur between the two groups but are not the only flux occurring. Blue curved boxes are metabolites and green straight boxes are pathways. Created with BioRender.com.(For interpretation of the references to colour in this figure legend, the reader is referred to the Web version of this article.)
Supplemental Fig. 1
Supplemental Fig. 1
Confirmation of previously published properties itaconate and itaconate deficiency have on BMDMs. A) Metabolomics data shown in a volcano plot with increased (red) or decreased (blue) metabolites and quantified itaconate content in a bar graph, of BMDMs (n = 4, unpaired t-test) or B) human macrophages s (n = 6, paired t-test) treated with LPS for 24 h compared to unstimulated cells. Dotted line represents significance cut-off (p < 0.05). C) Secretion of IL6 (left), TNF (middle) and nitric oxide (right) after treatment with (stripes) or without (filled) itaconate (5 mM) for 3 h before stimulation with (red) or without (black) LPS for 24 h (n = 9 for ELISA, n = 6 for NO assay, unpaired t-test). D) Itaconate content from metabolomics of Acod1+/+ (filled) and Acod1−/− (checkered) BMDMs treated with LPS for 24 h or control (n = 3, two-way ANOVA). E) Secretion of cytokines in control and LPS-treated Acod1+/+ and Acod1−/− macrophages after 24 h measured by either ELISA or NO assay and F) inflammatory gene expression after 3 h of LPS (n = 3, two-way ANOVA). Data points display individual mice and error bars show SD.
Supplemental Fig. 2
Supplemental Fig. 2
In vivo mouse and blood measurements. A) Percentage chimerism of donor bone marrow measured by qPCR analysis of Ldlr expression in blood samples of Acod1+/+Ldlr−/− (filled) and Acod1−/−Ldlr−/− (checkered) mice (n = 22/23 for Acod1+/+Ldlr−/− /Acod1−/−Ldlr−/−). B) Mouse weight over the entire in vivo experiment starting from 1 week before BMT in Acod1+/+Ldlr−/− (black dots) and Acod1−/−Ldlr−/− (white dots) mice (n = 22/23; dotted line is day of BMT). C) Cholesterol and D) triglyceride levels in blood plasma of mice at weeks 0, 5 and 8 of HFD (n = 22/23). E)In vivo blood cell subset composition per mL of blood at weeks 0, 5 and 8 of HFD (n = 22/23). Data points display individual mice and error bars show SD. BMT = Bone Marrow transplantation; HFD = High Fat Diet.
Supplemental Fig. 3
Supplemental Fig. 3
Gating strategies for in vivo blood and spleen flow cytometry analysis. A) Example gating strategies for myeloid and B) lymphoid cell subsets during blood collections at week 0, 5 and 8 of HFD. C) Example flow cytometry gating for dissociated spleen samples on day of sacrifice. All plots are read from left to right and top to bottom unless highlighted by a black arrow. Italic plot titles highlight which gate is being displayed from the previous plot.
Supplemental Fig. 4
Supplemental Fig. 4
Peritoneal foam cells from both Acod1+/+and Acod1−/−transplanted mice have the same cytokine secretion potential. A) Cytokine secretion from Acod1+/+Ldlr−/− (filled) and Acod1−/−Ldlr−/− (checkered) FCs stimulated with LPS for 24 h measured by either ELISA or B) NO assay (n = 5/4 for Acod1+/+/Acod1−/−, unpaired t-test). Data points display individual mice and error bars show SD.
Supplemental Fig. 5
Supplemental Fig. 5
Heatmap of triglyceride species in inflammatory Acod1+/+and Acod1−/−BMDMs.13C-glucose cultured Acod1+/+ and Acod1−/− BMDMs stimulated with (red) or without (black) LPS (100 ng/ml) for 24 h were measured in a fluxomics experiment for labeling of lipid species. Shown are Z-score averages of 3 samples from M+3 fraction fold changes of the displayed lipids (two-way ANOVA).
figs6
figs6
figs7
figs7

References

    1. Dicembrini I., Giannini S., Ragghianti B., Mannucci E., Monami M. Effects of PCSK9 inhibitors on LDL cholesterol, cardiovascular morbidity and all-cause mortality: a systematic review and meta-analysis of randomized controlled trials. J. Endocrinol. Invest. 2019;42(9):1029–1039. Epub 20190214. doi: 10.1007/s40618-019-01019-4. PubMed PMID: 30762200. - PubMed
    1. Wang H.F., Mao Y.C., Xu X.Y., Zhao S.Y., Han D.D., Ge S.Y., Song K., Geng C., Tian Q.B. Effect of alirocumab and evolocumab on all-cause mortality and major cardiovascular events: a meta-analysis focusing on the number needed to treat. Front Cardiovasc Med. 2022;9 Epub 20221202. doi: 10.3389/fcvm.2022.1016802. PubMed PMID: 36531722; PMCID: PMC9755489. - PMC - PubMed
    1. Ridker P.M. Anticytokine Agents: targeting interleukin signaling pathways for the treatment of Atherothrombosis. Circ. Res. 2019;124(3):437–450. doi: 10.1161/CIRCRESAHA.118.313129. PubMed PMID: 30702995; PMCID: PMC6386195. - DOI - PMC - PubMed
    1. Ridker P.M. How common is residual inflammatory risk? Circ. Res. 2017;120(4):617–619. doi: 10.1161/CIRCRESAHA.116.310527. PubMed PMID: 28209792. - DOI - PubMed
    1. Hansson G.K. Inflammation, atherosclerosis, and coronary artery disease. N. Engl. J. Med. 2005;21(352):1685–1695. doi: 10.1056/NEJMra043430. PMCID: 15843671. - DOI - PubMed

LinkOut - more resources