. 2024 Feb 15;187(4):962-980.e19.
doi: 10.1016/j.cell.2024.01.012. Epub 2024 Feb 2.

Microglia maintain structural integrity during fetal brain morphogenesis

Affiliations

Microglia maintain structural integrity during fetal brain morphogenesis

Akindé René Lawrence et al. Cell. .

Abstract

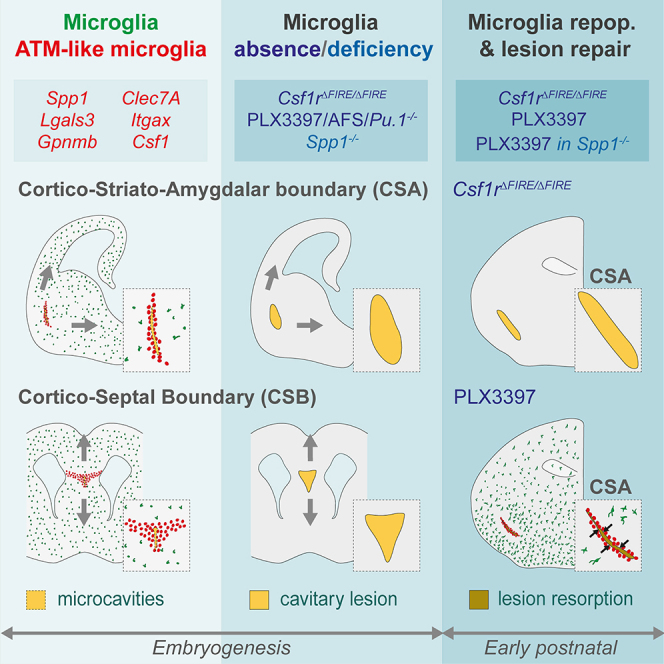
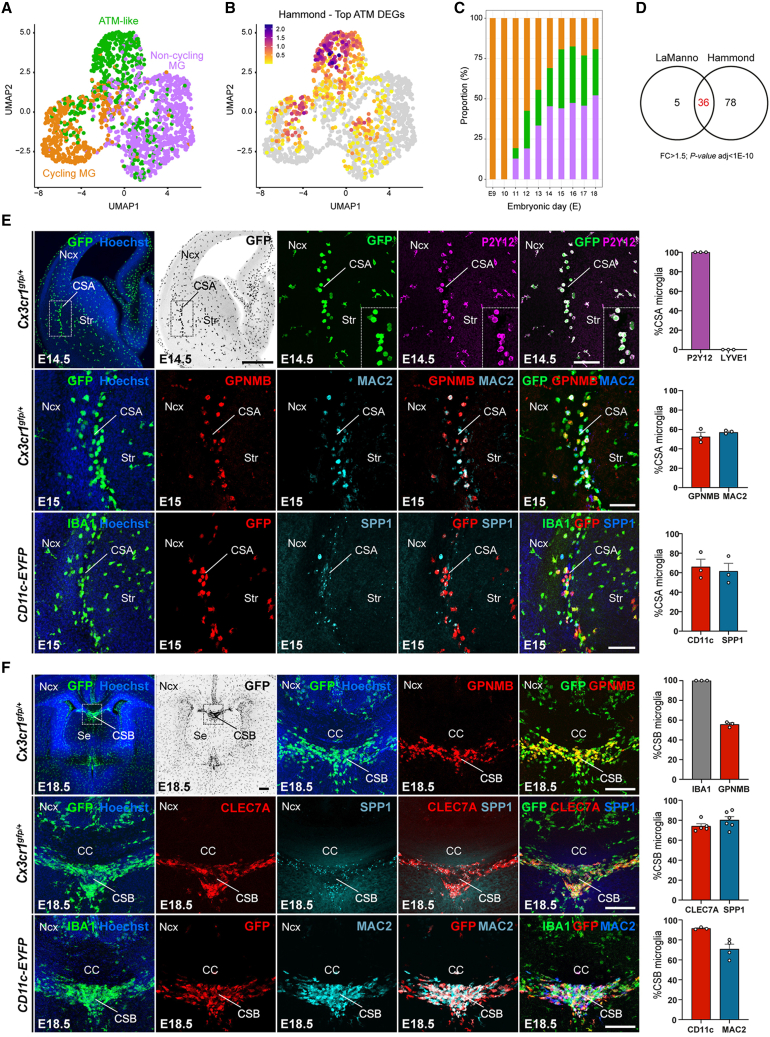
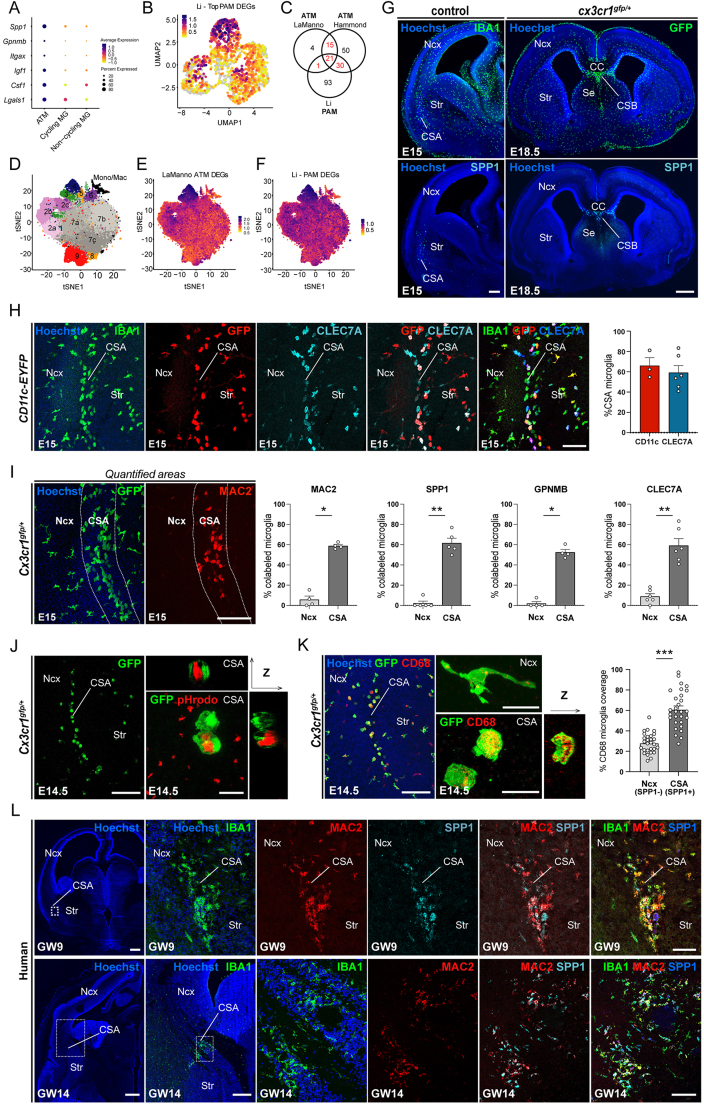
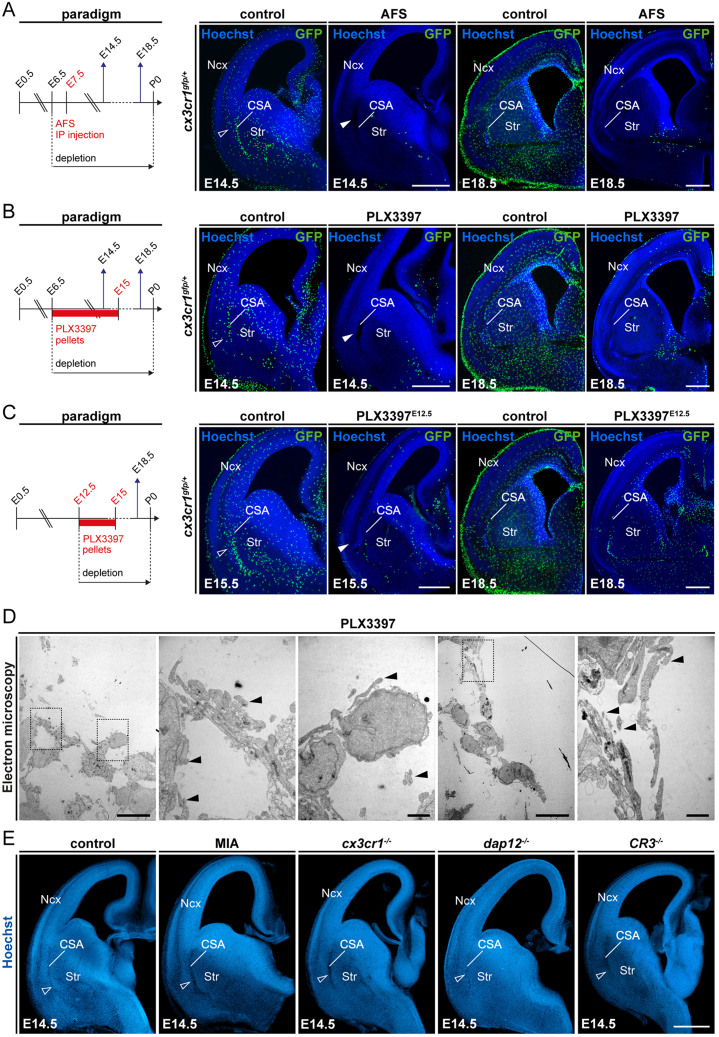
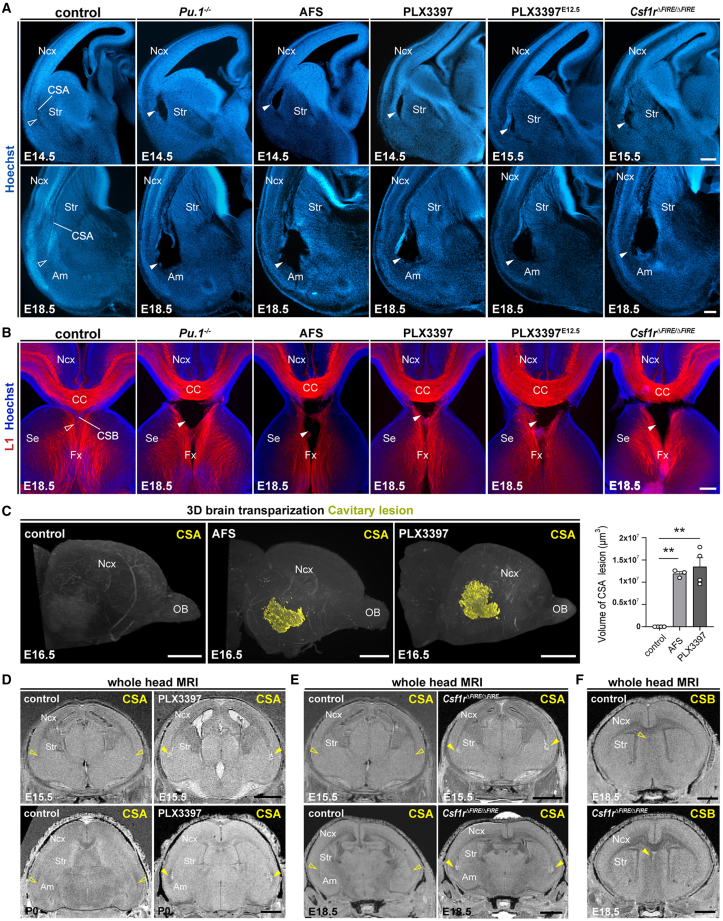
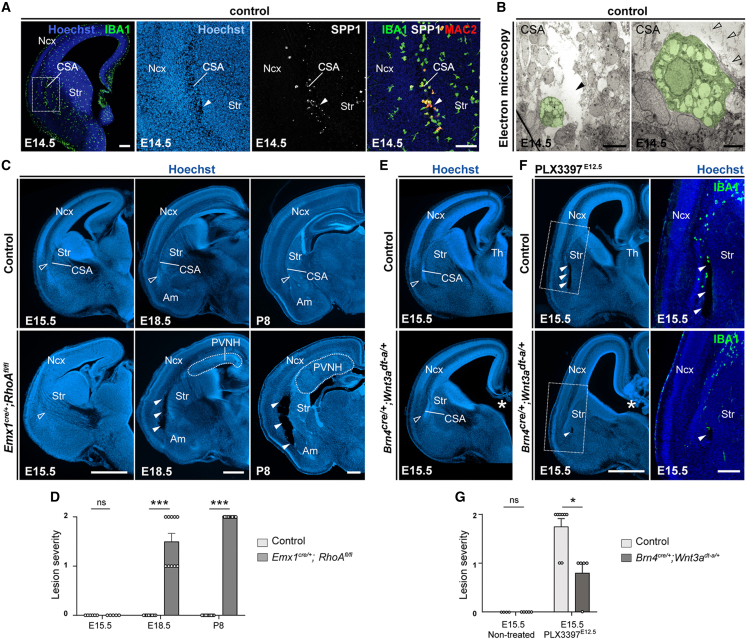
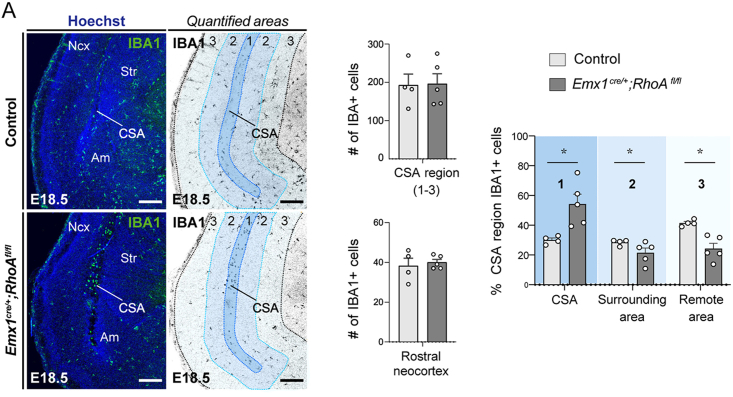
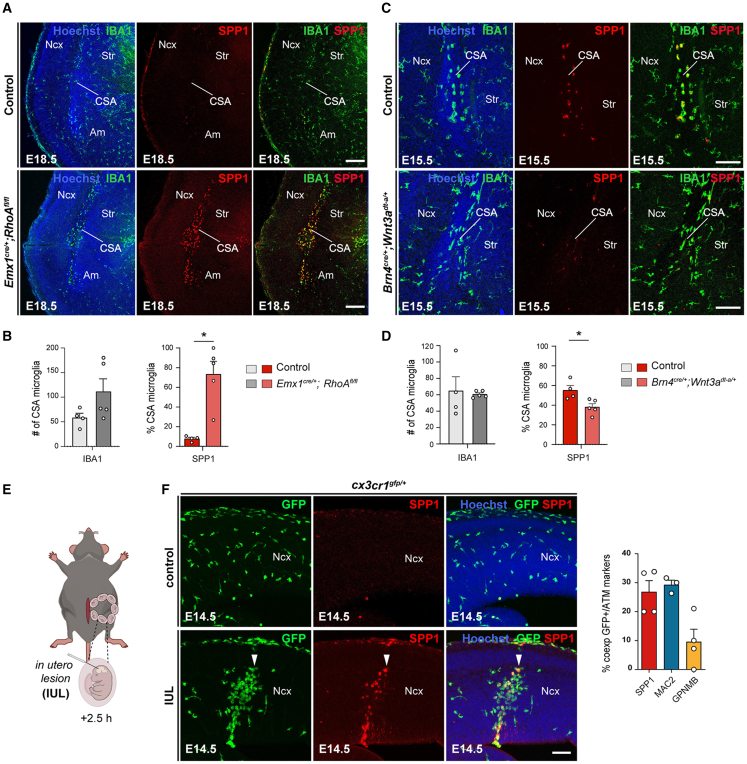
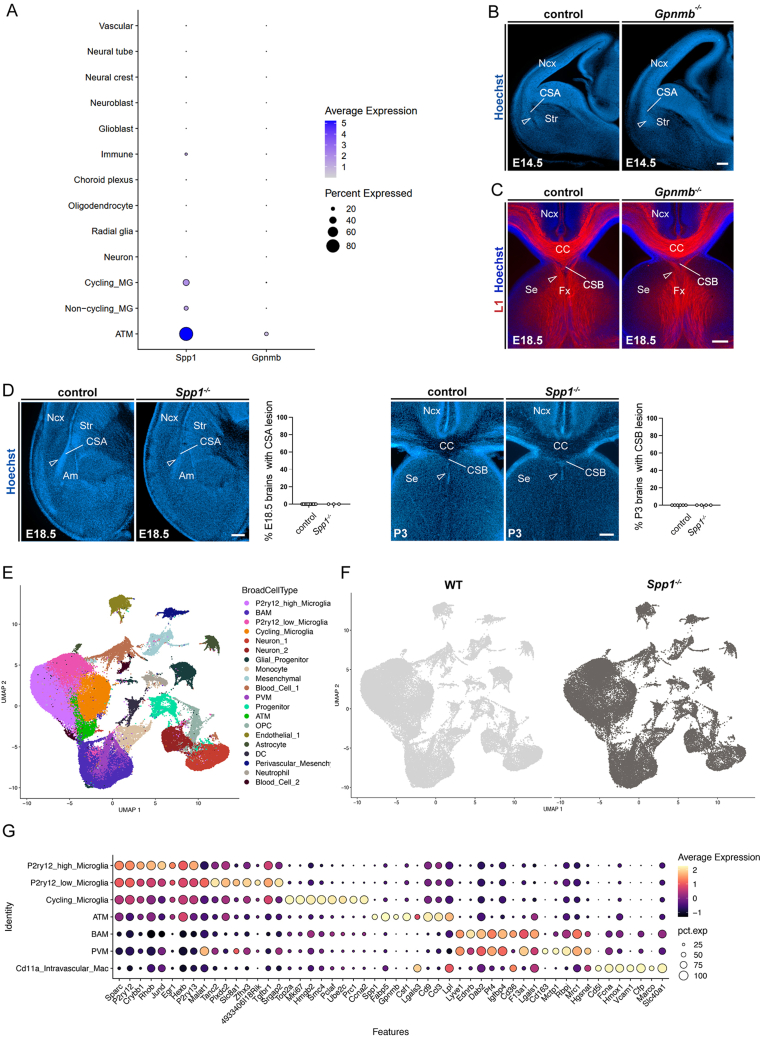
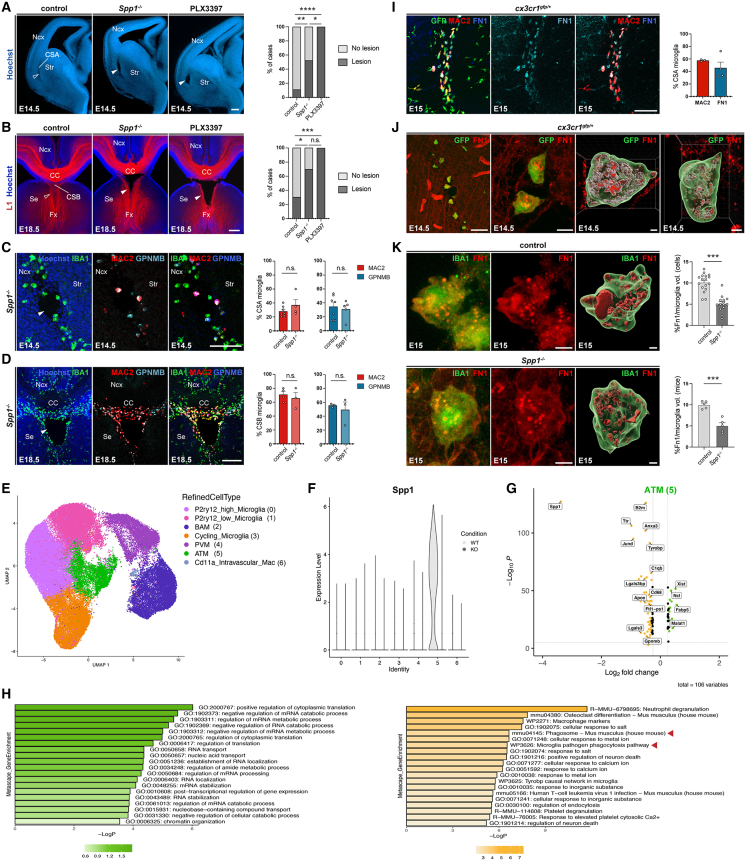
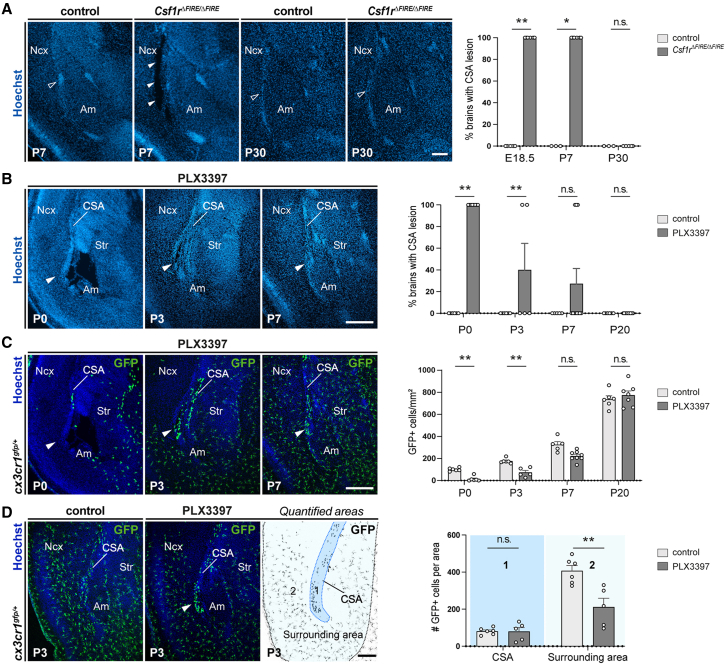
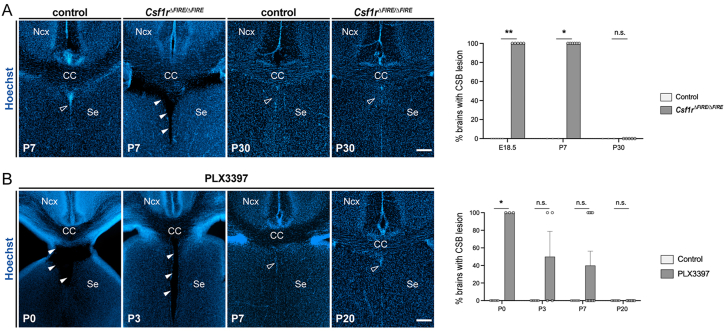
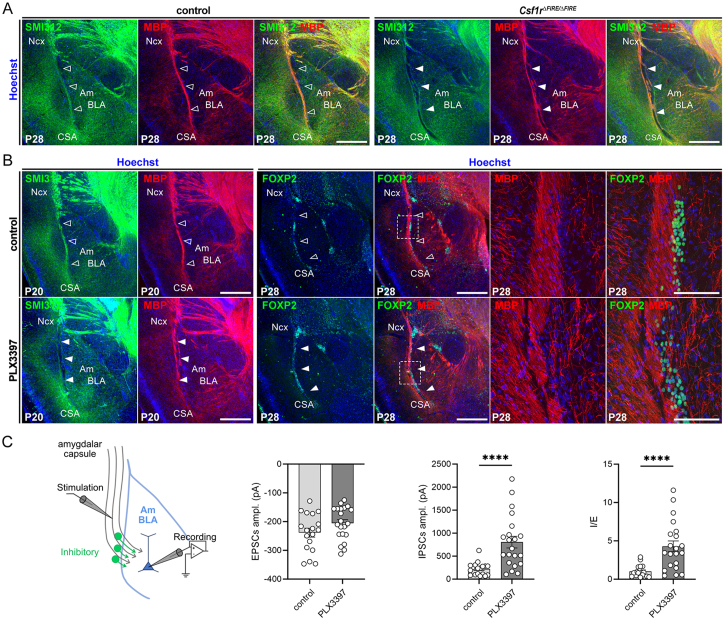
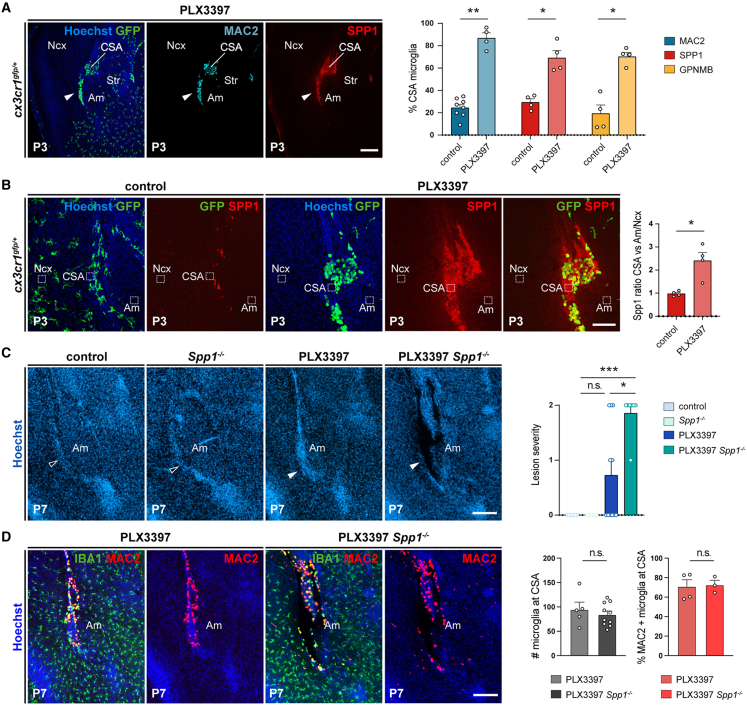
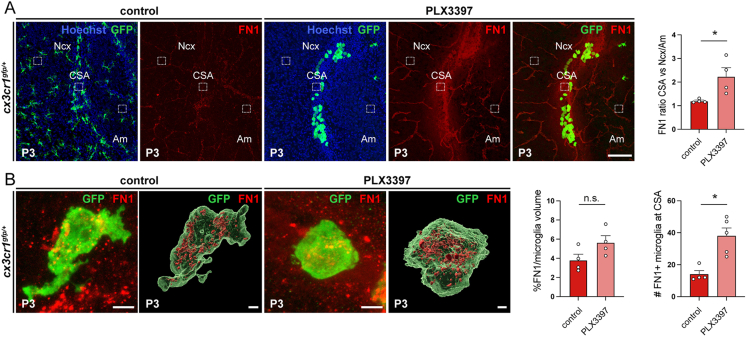
Microglia (MG), the brain-resident macrophages, play major roles in health and disease via a diversity of cellular states. While embryonic MG display a large heterogeneity of cellular distribution and transcriptomic states, their functions remain poorly characterized. Here, we uncovered a role for MG in the maintenance of structural integrity at two fetal cortical boundaries. At these boundaries between structures that grow in distinct directions, embryonic MG accumulate, display a state resembling post-natal axon-tract-associated microglia (ATM) and prevent the progression of microcavities into large cavitary lesions, in part via a mechanism involving the ATM-factor Spp1. MG and Spp1 furthermore contribute to the rapid repair of lesions, collectively highlighting protective functions that preserve the fetal brain from physiological morphogenetic stress and injury. Our study thus highlights key major roles for embryonic MG and Spp1 in maintaining structural integrity during morphogenesis, with major implications for our understanding of MG functions and brain development.

Keywords: Spp1; amygdala; cavity; cerebral cortex; corpus callosum; development; microglia; microglial state; osteopontin; repair.


Conflict of interest statement

Declaration of interests The authors declare no competing interests.

Figures

None
Graphical abstract
Figure 1
Figure 1
ATM-like microglia accumulate at the embryonic CSA and CSB (A) Single-cell transcriptomic uniform manifold approximation and projection (UMAP) plot of embryonic microglial cells (n = 1,711) extracted from the La Manno dataset, showing cycling MG (orange), non-cycling MG (purple), and embryonic ATM-like MG (green). (B) Projection of the post-natal ATM signature (top-enriched differentially expressed genes [DEGs]) from the Hammond dataset onto (A). (C) Proportion of cycling (orange), non-cycling (purple), and embryonic ATM-like MG (green) at different embryonic stages. (D) Venn diagram showing the overlap between embryonic and post-natal ATM DEGs, respectively, identified from La Manno and Hammond datasets (fold change [FC] > 1.5, Bonferroni-adjusted p < 1e−10). (E) Immunolabeling of brain sections from E14.5 or E15 Cx3cr1gfp/+ or CD11c-EYFP embryos showing co-expression of microglia and ATM markers at the CSA. CSA close ups are delineated by dotted lines. GFP-positive microglia in Cx3cr1gfp/+ brains fully colocalized with the microglial marker P2Y12 receptor, and IBA1 was used to label microglia in CD11c-EYFP brains (performed on brain sections of at least three mice from two different litters). (F) Immunolabeling of coronal brain sections from E18.5 Cx3cr1gfp/+ or CD11c-EYFP embryos showing co-expression of microglia and ATM markers at the cortico-septal boundary (CSB), below the corpus callosum (CC). CSB close ups are delineated by dotted lines. GFP-positive microglia in Cx3cr1gfp/+ brains fully colocalized with the IBA1 marker, which was used to label all microglia in CD11c-EYFP brains (performed on brain sections of at least three mice from two different litters). Graphs show means ± SEM. Scale bars: 500 μm in (E, upper left); 200 μm in (E, lower); 100 μm in (E, upper right) and (F); and 20 μm (E insets). ATM, axon-tract-associated microglia; ATM-like, axon-tract-associated-like microglia; CC, corpus callosum; CSA, cortico-striato-amygdalar boundary; CSB, cortico-septal boundary; DEGs, differentially expressed genes; MG, microglia; Ncx, neocortex; Se, Septum; Str, striatum. See also Figure S1 and Table S1.
Figure S1
Figure S1
Embryonic ATM-like cells resemble post-natal ATM, related to Figure 1 (A) Dot plot showing the relative expression levels of core ATM genes in embryonic ATM-like microglia (MG) compared with non-cycling or cycling embryonic MG in the La Manno scRNA-seq dataset. The color represents the normalized expression level across all cells within a cluster, while the dot size indicates the percentage of cells expressing each gene in that cluster. (B) Projection of the post-natal PAM signature from the Li dataset onto the UMAP plot from Figure 1A showing embryonic ATM-like cells. (C) Venn diagram highlighting the overlap between embryonic brain ATM differentially expressed genes (DEGs) identified in the La Manno dataset, post-natal ATM in the Hammond dataset, and post-natal PAM in the Li dataset. (D) Reproduced tSNE plot of the 76,149 cells characterized by scRNA-seq in the La Manno dataset. (E and F) Projections of the embryonic ATM signature defined in the La Manno dataset (E) and the PAM signature defined in the Li dataset (F), showing the overlap with the Hammond ATM cluster 4. (G) Low magnification of brain sections from embryonic mice at E15.0 and E18.5 showing that accumulations of SPP1-expressing microglia, identified as Cx3cr1gfp-positive or IBA1-positive parenchymal cells, are restricted to the CSA and CSB. (H) Immunolabeling of embryonic E15.0 CD11c-EYFP brain section showing IBA1-positive microglia expressing YFP (n = 3) and ATM marker CLEC7A (n = 6) at the CSA. (I) Comparison of ATM marker expression between microglia located in the neocortex and CSA in E15.0 CD11c-EYFP and Cx3cr1gfp-positive brains, showing examples of CSA and neocortical areas used for quantification; immunolabeling was performed on brain sections from at least 3 mice from 2 different litters. (J) pHrodo assay conducted on ex vivo brain slices (at least n = 3 from 2 distinct litters) showing intense staining in CSA microglia at E14.5. (K) Immunolabeling for CD68 showing intense staining inside CSA microglia at E14.5 in physiological conditions and comparison between mean CD68 coverage of SPP1-negative ramified microglia and SPP1-positive CSA ATM (nNcx = 28, nCSA = 29 cells in 4 mice from 2 distinct litters). (L) Immunolabeling of human GW9 and GW14 human brain transverse sections showing co-expression of ATM markers with IBA1 at the CSA. Graphs (ATM markers co-expression and CD68 coverage) show means ± SEM. Mann-Whitney U test were performed for statistical comparison, p < 0.05; ∗∗p < 0.01; ∗∗∗p < 0.001. Scale bars: 200 μm in (G left) and (L right); 500 μm in (G, right); 150 μm in (I)–(K); 100 μm in (H); 1,000 μm in (L, upper left); and 1,500 μm in (L, lower left). ATM, axon-tract-associated microglia; CC, corpus callosum; CSA, cortico-striato-amygdalar boundary; DEGs, differentially expressed genes; GW, gestational week; MG, microglia; Ncx, neocortex; PAM, proliferative-region associated microglia; Se, septum; Str, striatum.
Figure S2
Figure S2
Models of macrophage depletion and functional alteration, related to Figure 2 (A–C) Confirmation of the depletion of microglia in brains of embryonic Cx3cr1gfp/+ mice at E14.5 and E18.5, where pregnant dams were subjected to (A) intraperitoneal injection of a CSF1R blocking antibody (AFS) at E6.5 and E7.5 (E14.5, ncontrols = 21, nAFS = 6; E18.5, ncontrols = 15, nAFS = 17); (B) feeding with PLX3397, a pharmacological inhibitor of the CSF1R pathway, from E6.5 to E15.0 (E14.5, ncontrols = 5, nPLX3397 = 5; E18.5, ncontrols = 12, nPLX3397 = 11); and (C) feeding with PLX3397 from E12.5 to E15.0 (E15.5, ncontrols = 5, nPLX3397-E12 = 9; E18.5, ncontrols = 12, nPLX3397-E12 = 10). Open and solid arrowheads indicate the accumulation of GFP-positive cells at the CSA and local CSA tissue lesion in the absence of GFP-positive cells, respectively. (D) Transmission electron microscopy image of the CSA lesion in the brain of E14.5 embryos from PLX3397-treated dams, showing the presence of cell debris (solid arrowheads) but the absence of basal membrane (n = 3). (E) Coronal sections through hemibrains of E14.5 embryos from wild-type mice; those exposed to mild maternal immune activation (MIA); and Cx3cr1−/−, Dap12/TyroBP−/−, and CR3−/− mutant embryos showing the absence of CSA lesions (open arrowheads) (at least n = 6 for each condition). Scale bars: 500 μm in (A)–(C), and (E); 10 μm in (D, low magnification); and 2 μm in (D, high magnification). CSA, cortico-striato-amygdalar boundary; Ncx, neocortex; Str, striatum.
Figure 2
Figure 2
Microglia are required for tissue integrity at the embryonic CSA and CSB (A) Hoechst staining of hemibrain coronal sections from E14.5 or E15.5 embryos, showing CSA integrity in controls (open arrowhead) and cavitary lesions in the absence of microglia (solid arrowheads) (ncontrols = 27, nPu1KO = 6, nAFS = 4, nPLX3397 = 8, nPLX3397-E12 = 11, nCSF1RFire = 7); and from E18.5 embryos, showing the localization of CSA cavitary lesions, bordering the neocortex (Ncx), striatum (Str), and amygdala (Am) (ncontrols = 35, nPu1KO = 5, nAFS = 7, nPLX3397 = 13, nPLX3397-E12 = 11, nCSF1RFire = 6). (B) L1-immunolabeling stains the corpus callosum (CC) and fornix (Fx), highlighting CSB integrity in controls (open arrowheads) and cavitary lesions (solid arrowheads) in various models disrupting microglial colonization (ncontrols = 21, nPu1KO = 4, nAFS = 5, nPLX3397 = 9, nPLX3397-E12 = 11, nCSF1RFire = 5). (C) Cavity reconstruction (yellow) after whole hemibrain clearing using iDISCO, highlighting the absence of cavities in controls and stereotypically located cavities in two depletion models (ncontrols = 4, nAFS = 3, nPLX3397 = 4) and enabling 3D quantification of lesion volumes (Imaris Software). (D) Whole-head MRI scans of E15.5 or P0 mice, showing low-intensity signals confirming the formation of lesions at the CSA of PLX3397-treated embryos (yellow solid arrowheads) in contrast to controls (yellow open arrowheads) (ncontrols-E15 = 4, nPLX3397-E15 = 3, ncontrols-P0 = 3, nPLX3397-P0 = 3). (E) Whole-head MRI scans of E15.5 or E18.5 mice, showing low-intensity signals confirming the formation of lesions at the CSA of Csf1rΔFIRE/ΔFIRE embryos (yellow solid arrowheads) in contrast to controls (yellow open arrowheads; ncontrols-E15 = 3, nCSF1RFire-E15 = 4, ncontrols-E18 = 4, nCSF1RFire-E18 = 4). (F) Whole-head MRI scans of E18.5 mice, showing low-intensity signals confirming the formation of lesions at the CSB of Csf1rΔFIRE/ΔFIRE embryos (yellow solid arrowheads) in contrast to controls (yellow open arrowheads) (ncontrols-E18 = 4, nCSF1RFire-E18 = 4). Graphs show means ± SEM. Mann-Whitney U tests were performed for statistical comparison, ∗∗p < 0.01. Scale bars: 200 μm in (A) and (B); 800 μm in (C); and 1 mm (D)–(F). Am, amygdala; CC, corpus callosum; CSA, cortico-striato-amygdalar boundary; CSB, cortico-septal boundary; Fx, fornix; Ncx, neocortex; OB, olfactory bulb; Se, Septum; Str, striatum. See also Figure S2 and Video S1. Lateral rotation of an AFS-treated E16.5 hemibrain cleared by iDISCO, related to Figure 2, Video S2. Lateral rotation of a PLX3397-treated E16.5 hemibrain cleared by iDISCO, related to Figure 2, Video S3. Rostrocaudal progression through an E16.5 control hemibrain cleared by iDISCO, related to Figure 2, Video S4. Rostrocaudal progression through a PLX3397-treated E16.5 hemibrain cleared by iDISCO, related to Figure 2.
Figure 3
Figure 3
Microglia limit the progression of CSA microcavities into large lesions in response to morphogenetic constraints (A) IBA1, Spp1, and Mac2 immunostaining findings indicate that ATM line microcavities (solid arrowheads), visible by Hoechst counterstaining at E14.5 (n = 6, from at least two distinct litters). (B) Transmitted electron microscopy (EM) also reveals the presence of microcavities (solid arrowheads), lined with amoeboid microglia (green pseudo-color), and containing membrane fragments (open arrowheads) (n = 3, from at least two distinct litters). (C and D) Coronal hemisections (C) from control and Emx1cre/+;RhoAfl/fl mice, the latter displaying a periventricular nodular heterotopia (PVNH) visible from E18.5 onward (dotted lines). Hoechst counterstaining shows the absence of CSA lesions in controls and mutants at E15.5 (open arrowheads), a striking CSA lesion (solid arrowheads) in 50% of the E18.5 mutants and in 100% of the mutants at P8 (ncontrols-E15 = 6, nheterotopia-E15 = 5, ncontrols-E18 = 8, nheterotopia-E18 = 10, ncontrols-P8 = 10, nheterotopia-P8 = 15). Quantification in (D) uses values that represent the scoring of lesion severity, scored from 0 to 2, as detailed in Table S2. (E) Coronal hemisections of E15.5 brains from Brn4cre/+; Wnt3adta/+ embryos show an ablation of the thalamus (white asterisk) and a global change in brain shape but no marked impact on the CSA (ncontrols = 4, nthalamusdeleted = 5). (F and G) Coronal hemisections (F) of E15. 5 brains from control and Brn4cre/+; Wnt3adta/+ mice exposed to PLX3397 between E12.5 and E15.5. While PLX3397-exposed controls consistently displayed lesions (open arrowheads), PLX3397-treated mutants exhibited smaller lesions or no lesions (solid arrowheads) despite effective local depletion as assessed by IBA1 staining (ncontrols = 4, nthalamusdeleted = 5, nPLX3397 = 8, nthalamusdeleted-PLX3397 = 5, from at least two distinct litters). Quantification in (G) uses values that represent the scoring of lesion severity, scored from 0 to 2, as detailed in Table S2. Graphs show means ± SEM. Mann-Whitney U tests were performed for statistical comparison, p < 0.05; ∗∗∗p < 0.001; ns, non significant (p > 0.05). Scale bars: 200 μm (A, left); 100 μm (A and F, high magnifications); 2.5 μm (B); and 500 μm (C, E, and F, low magnification). Am, amygdala; CSA, cortico-striato-amygdalar boundary; PVNH, periventricular nodular heterotopia; Ncx, neocortex; Str, striatum; Th, thalamus. See also Figure S3.
Figure S3
Figure S3
Microglial recruitment is modulated by global changes in brain morphogenesis, related to Figure 3 (A) IBA1 immunolabeling in coronal sections shows the distribution of microglia in control and Emx1cre/+; RhoAfl/fl mutant brains at E18.5. Mutant mice display accumulations of microglia at the lesioned CSA and reduced numbers in surrounding areas, despite lack of overall difference in microglial numbers in the caudal CSA region or the rostral neocortex (n = 4 at least from 2 distinct litters for both controls and mutants). (B) Quantifications of the IBA1+ cells in all the CSA region, rostral neocortex and within CSA subregions (1–3). Graphs show means ± SEM. Mann-Whitney U tests were performed for statistical comparison, p < 0.05. Scale bars, 200 μm. Am, amygdala; CSA, cortico-striato-amygdalar boundary; Ncx, neocortex; Str, striatum.
Figure 4
Figure 4
ATM-like microglia are induced by morphogenetic constraints and tissue mechanical lesions (A and B) Coronal E18.5 brain hemisections immunostained with IBA1 and Spp1 showing a marked recruitment of Spp1-expressing microglia at the CSA of Emx1cre/+;RhoAfl/fl mice, with approximately 75% of Spp1-positive CSA microglia in mutants, but 8% of CSA cells detected in controls at this stage (n = 4 at least for each condition, from a minimum of two distinct litters). (C and D) Coronal E15.5 brain hemisections immunostained for IBA1 and Spp1 showing a significantly diminished percentage of CSA microglia expressing Spp1 in E15.5 Brn4cre/+; Wnt3adta/+ mutant mice compared to controls, despite a conserved number of accumulating cells (n = 4 at least for each condition, from a minimum of two distinct litters). (E) Schematic representation of in utero lesion (IUL) procedure induced by mechanical poking of the neocortex using a glass capillary. (F) Coronal sections through the E14.5 neocortex of control and IUL embryos collected 2.5 h after lesion induction, showing amoeboid Cx3cr1gfp-positive cells accumulating at the lesion site and the co-expression of Spp1 and Mac2 (solid arrowheads) in IUL embryos but dispersed Cx3cr1gfp-positive cells and no expression of ATM markers in controls (ncontrols = 9, nIUL = 8, from at least two distinct litters). Quantification of the percentage of Cx3cr1gfp-positive cells at the lesion site co-expressing ATM markers (nSPP1 = 4, nMAC2 = 3, nGPNMB = 4 from at least two distinct litters). Graphs show means ± SEM. Mann-Whitney U tests were performed for statistical comparison, p < 0.05. Scale bars: 200 μm in (A) and 100 μm in (C) and (F). Am, amygdala; CSA, cortico-striato-amygdalar boundary; Ncx, neocortex; Str, striatum.
Figure S4
Figure S4
Spp1 inactivation transiently alters CSA and CSB integrity, related to Figure 5 (A) Dot plot reporting the average expression level of Spp1 and Gpnmb in various cell types of La Manno et al. scRNA-seq data across different embryonic time points (229,948 cells). Color represents the average expression level across all cells within a cluster, while the dot size indicates the percentage of cells expressed in that cluster. (B) E14.5 coronal hemisection stained with Hoechst, showing the integrity of the CSA in control mice and Gpnmb−/− mutants (open arrowheads) (ncontrols = 18, nGpnmbKO = 13, from at least 2 distinct litters). (C) L1 immunolabeling showing the integrity at the CSB in control mice and Gpnmb−/− mutants (open arrowheads) (ncontrols = 23, nGpnmbKO = 8, from at least two distinct litters). (D) CSA and CSB lesions in Spp1−/− mutants are transient and have resorbed, respectively, by E18.5 (ncontrols = 9; nSpp1KO = 3, from at least 2 distinct litters) and P3 (ncontrols = 6; nSpp1KO = 4, from at least two distinct litters). Graphs show the percentages of brain with lesions, but individual dots represent brains with lesion (100) or no lesion (0), to illustrate sample numbers. (E) UMAP visualization of all sorted cells (from wild-type [WT] and Spp1−/− E14.5 and E18.5 embryos) colored by annotated clusters (BroadCellType). (F) UMAP of all sorted cells split and colored by WT (light gray) and Spp1−/− (dark gray) conditions. (G) Dot plot of scaled average expression and percentage of top 5 differentially expressed genes (DEGs) by annotated macrophage clusters (RefinedCellType). Scale bars, 200 μm. ATM, axon-tract associated microglia; BAM, border associated macrophages; CC, corpus callosum; CSA, cortico-striato-amygdalar boundary; CSB, cortico-septal boundary; Fx, fornix; Ncx, neocortex; MG, microglia; PVM, perivascular macrophages; Se, septum; Str, striatum; WT, wild-type.
Figure 5
Figure 5
ATM-core factor Spp1 contributes to tissue integrity at the CSA and CSB (A) Coronal hemisections of E14.5 brains stained with Hoechst reveal CSA disruption in 50% of Spp1−/− mutants (solid arrowheads) compared to controls (open arrowheads) and in 100% of PLX3397-treated embryos (solid arrowheads) (ncontrols = 18, nSpp1KO = 21, nPLX3397 = 13). Quantification of CSA lesions across models. (B) L1 immunolabeling enables axon visualization (open arrowheads) and midline lesions (solid arrowheads) in approximately 70% of Spp1−/− mutants compared with 100% in PLX3397-exposed embryos (ncontrols = 23, nSpp1KO = 20, nPLX3397 = 8). Quantification of CSB lesions across models. (C and D) E14.5 (C) and E18.5 (D) coronal hemisections showing no differences in Mac2 and GPNMB co-expressing microglia at the CSA and CSB of controls (open arrowheads) and Spp1−/− embryos (ncontrols = 3, nSpp1KO = 3, at each stage from at least two distinct litters). (E) UMAP visualization of single-cell RNA sequencing (scRNA-seq) data representing macrophage subsets extracted from wild-type (WT) and Spp1−/− E14.5 and E18.5 embryos colored by annotated clusters (RefinedCellType). (F) Violin plot of normalized and scaled Spp1 expression across annotated clusters between wild-type (WT) (light gray) and Spp1−/− (KO)(dark gray) mice showing that Spp1 expression is largely restricted to WT ATM (cluster 5). (G) Volcano plot of differentially expressed genes (DEGs) between WT and Spp1−/− conditions in ATM cells (false discovery rate[FDR]-adjusted p < 0.05 and avgerage_log2FC > 0.3). Genes downregulated in Spp1−/− embryos are displayed in orange, while the upregulated ones are shown in green, and some genes were manually annotated. (H) Bar plots of top Metascape gene set enrichment of DEGs (G) in both WT or Spp1−/− conditions, highlighting upregulated (green) and downregulated pathways (orange) in Spp1−/− embryos versus controls, with pathways related to phagocytosis highlighted by a red arrowhead. (I) Brain sections from E15 Cx3cr1gfp/+ mice showing specific fibronectin 1 (FN1) labeling within GFP- and Mac2-positive ATM microglia at the CSA (performed on brain sections of at least three mice from two distinct litters). (J) High magnification confocal acquisition and 3D cell reconstructions (Imaris software) of immunolabeled sections from E14.5 embryonic brains showing Cx3cr1gfp-positive CSA microglia with FN1 signal inside cell bodies (performed on brain sections of at least three mice from two distinct litters). (K) Comparison of the percentage of FN1 volume measured (Imaris software) inside individual CSA microglia shows a reduction in Spp1 mutants versus controls (ncontrols = 17, nSpp1KO = 14, from at least two distinct litters). Graphs show percentages in (A) and (B) and means ± SEM for all others. Fisher’s exact test was performed to compare distributions of cases with lesions in controls, Spp1−/−, and PLX3397-exposed embryos (A and B), and Mann-Whitney U tests were performed for statistical comparison in all other graphs,p < 0.05; ∗∗p < 0.01; ∗∗∗p < 0.001; ns, non significant (p > 0.5). Scale bars: 200 μm (A, B low magnification, and D); 100 μm (C and F); 5 μm (G, left); and 2 μm (3D reconstructed cells in F and G). ATM, axon-tract-associated microglia; BAM, border associated macrophages; CC, corpus callosum; CSA, cortico-striato-amygdalar boundary; CSB, cortico-septal boundary; DEGs, differentially expressed genes; Fx, fornix; Intravasc mac, intravascular macrophages; Ncx, neocortex; PVM, perivascular macrophages; Se, Septum; Str, striatum; WT, wild type. See also Figure S4 and Table S3. Genes defining the clusters identified by single-cell transcriptomic analyses on all the sorted cells from wild type and Spp1−/−, related to Figures 5 and S4, Table S4. Genes defining the clusters identified by single-cell transcriptomic analyses on the macrophages from wild type and Spp1−/−, related to Figure 5, Table S5. DEGs in ATM in wild type versus Spp1−/−, related to Figure 5, Table S6. Metascape analyses of ATM in wild type versus Spp1−/−, related to Figure 5.
Figure 6
Figure 6
Local microglia repopulation at the CSA drives the rapid repair of cavitary lesions (A) Coronal sections showing the CSA region in controls and Csf1rΔFIRE/ΔFIRE pups, highlighting that cavitary lesions are systematically observed in P7 Csf1rΔFIRE/ΔFIRE pups (solid arrowheads), but absent in P7 controls or at P30 in both conditions (open arrowheads) (ncontrols-E18 = 5, nCSF1RFire-E18 = 6, ncontrols-P7 = 3, nCSF1RFire-P7 = 6, ncontrols-P30 = 3, nCSF1RFire-P30 = 5, from at least two distinct litters for each stage and condition). Graphs show percentages of brain with lesions, but individual dots represent brains with lesion (100) or no lesion (0) to illustrate variability. (B and C) Coronal sections of brains prenatally exposed to PLX3397 showing the CSA region (solid arrowheads) at P0, P3, P7, and P20. Cavitary lesions progressively resorbed, with a significant proportion being resorbed at P3, and almost all achieved by P7, concurrently with the overall repopulation of Cx3cr1gfp-positive cells, which accumulated at the site of lesion closure (solid arrowhead) (ncontrols-P0 = 6; nPLX3397-P0 = 6; ncontrols-P3 = 6; nPLX3397-P3 = 5; ncontrols-P7 = 5; nPLX3397-P7 = 8; ncontrols-P20 = 7; nPLX3397-P20 = 7, from at least two distinct litters for each stage and condition). Graph in (B) is presented as in (A), while graph in (C) displays means ± SEM. (D) Repopulating microglia numbers are comparable at the CSA of controls and PLX3397-exposed embryos at P3, even if microglia numbers remain lower in the surrounding area of resorbing brains (ncontrols-P3 = 6; nPLX3397-P3 = 5, from at least two distinct litters). Graph in (D) show means ± SEM. Fisher’s exact test (A and B) and Mann-Whitney U test (C and D) were performed for statistical comparison, p < 0.05; ∗∗p < 0.01; ∗∗∗p < 0.001; ns, non significant (p > 0.5). Scale bars: 300 μm in (B) and (C) and 200 μm in (A) and (D). Am, amygdala; CSA, cortico-striato-amygdalar boundary; Ncx, neocortex; Str, striatum. See also Figures S5 and S6.
Figure S5
Figure S5
CSB lesion closure timeline is similar to the one at the CSA, related to Figure 6 (A) Coronal sections counterstained with Hoechst showing the CSB region in Csf1rΔFIRE/ΔFIRE mice. Cavitary lesions (solid arrowheads) were systematically observed in mutants up to P7, while they were absent in controls or resorbed in mutants at P30 (open arrowheads), similarly to what was observed at the CSA (ncontrols-E18.5 = 6, nCSF1RFire-E18.5 = 5, ncontrols-P7 = 3, nCSF1RFire-P7 = 6, ncontrols-P30 = 3, nCSF1RFire-P30 = 5). (B) Coronal sections showing the CSB region (open arrowheads) in pups prenatally exposed to PLX3397 at P0, P3, P7, and P20. Cavitary lesions (solid arrowheads) progressively resorbed during the first post-natal week, with a similar timeline to the CSA (ncontrols-P0 = 6; nPLX3397-P0 = 3; ncontrols-P3 = 6; nPLX3397-P3 = 4; ncontrols-P7 = 5; nPLX3397-P7 = 10; ncontrols-P20 = 6; nPLX3397-P20 = 6). Graphs show the percentages of brain with lesions, but individual dots represent brains with lesion (100) or no lesion (0) to illustrate variability. Fisher’s exact test was performed for statistical comparison, p < 0.05; ∗∗p < 0.01; ns, non significant (p > 0.05). Scale bars, 200 μm. CC, corpus callosum; Ncx, neocortex; Se, septum.
Figure S6
Figure S6
Long-term impact on the CSA region after lesion closure, related to Figure 6 (A) P28 coronal hemisections of brains immunostained with the pan axonal neurofilament marker SMI-312 and myelin basic protein (MBP) and Hoechst reveal alterations in the CSA region in Csf1rΔFIRE/ΔFIRE mice. Axonal tracts of the amygdalar capsule, located between the neocortex and the basolateral nucleus of the amygdala (BLA), are disorganized in mutants (solid arrowheads) compared with controls (open arrowheads), highlighting long-term morphological consequences of microglial absence and early life CSA lesions, even after lesion closure (ncontrols = 4, nCSF1RFire = 4, from at least two distinct litters). (B) P20 coronal hemisections of brains immunostained with the pan axonal neurofilament marker SMI-312 and myelin basic protein (MBP) (left) or with MBP and FOXP2 (right) reveal alterations in the CSA region of mice prenatally exposed to PLX3397 (solid arrowheads) compared with controls (open arrowheads). Axonal tracts of the amygdalar capsule and associated FOXP2-positive inhibitory interneurons are disorganized, highlighting long-term morphological consequences of early microglial absence and transient CSA lesions (ncontrols-SMI/MBP = 9; nPLX3397-SMI/MBP = 7; ncontrols-MBP/Foxp2 = 5; nPLX3397-MBP/Foxp2 = 5; from at least two distinct litters for each condition). (C) Schematic representation of the experimental approach (left) used to record in P60 slices both excitatory post-synaptic currents (EPSCs) and inhibitory post-synaptic currents (IPSCs) from BLA pyramidal neurons in response to stimulation of the amygdalar capsule. Importantly, amygdalar capsule stimulation was designed to trigger EPSCs with an amplitude between −150 and −350 pA in both mutants and PLX3397-prenatally exposed mice, and IPSCs were subsequently measured by changing the holding potential in order to evaluate the inhibition/excitation ratio (I/E). EPSCs and IPSCs amplitude and I/E ratio (right) show an altered balance in PLX3397-exposed embryos, compared with controls at P60 (ncontrols = 18 cells from 5 animals and at least 2 distinct litters, nPLX3397 = 21 cells, from 5 animals and at least 2 distinct litters). Scale bars, 500 μm (A and B, low magnification) and 100 μm (B, high magnification). Graphs show means ± SEM. Mann-Whitney U tests were performed for statistical comparison, ∗∗∗∗p < 0.0001. Am, amygdala; ampl, amplitude; BLA, basolateral nucleus of the amygdala; CSA, cortico-striato-amygdalar boundary; EPSCs, excitatory post-synaptic currents; I/E, inhibition/excitation ratio; IPSCs, inhibitory post-synaptic currents; Ncx, neocortex.
Figure 7
Figure 7
ATM-factor Spp1 contributes to lesion repair (A) Cx3cr1gfp-positive cells accumulating at the site of lesion closure co-express ATM markers Spp1, Mac2, and GPNMB, as shown and quantified at P3 (ncontrols = 4; nPLX3397 = 4 for each marker, from at least two distinct litters). (B) Extracellular Spp1 signal, delineated by immunostaining and Hoechst labeling, accumulates at the resorbing CSA at P3. Graphs show the increased signal intensity at the CSA (dotted lines) compared with a mean between signal intensity measured in the surrounding neocortex (dotted lines) and amygdala (dotted lines) in PLX3397-exposed pups versus controls (ncontrols = 4; nPLX3397 = 4, from two distinct litters). (C) In contrast to controls, Spp1−/− mutants, and PLX3397-exposed controls, PLX3397-exposed Spp1−/− mutants reproducibly displayed lesions visible by Hoechst staining (solid versus open arrowheads) (ncontrols = 7; nSpp1KO = 8; ncontrol-PLX3397 = 11; nSpp1KO-PLX3397 = 7). Values represent the scoring of lesion severity, scored from 0 to 2, as detailed in Table S2. (D) While CSA IBA1-positive cells co-expressed Mac2 in resorbed PLX3397-treated controls at P7, they also accumulated around the lesions in PLX3397-treated Spp1 mutants, indicating that Spp1 inactivation did not prevent the expression of selected ATM markers (ncontrol-PLX3397 = 3; nSpp1KO-PLX3397 = 7). Graphs show means ± SEM. Mann-Whitney U test was performed for statistical comparison, p < 0.05; ∗∗p < 0.01; ∗∗∗p < 0.001; ns, non significant (p > 0.5). Scale bars: 200 μm in (A); 150 μm in (C) and (D); and 100 μm in (B). Am, amygdala; CSA, cortico-striato-amygdalar boundary; Ncx, neocortex; Str, striatum. See also Figure S7.
Figure S7
Figure S7
Microglia engulf fibronectin 1 during CSA lesion repair, related to Figure 7 (A) Fibronectin 1 (FN1) signal after immunostaining accumulates at the P3 resorbing CSA in Cx3cr1gfp/+ pups prenatally exposed to PLX3397 in both repopulating microglia and in the tissue surrounding them, whereas little FN1 signal is detected beyond blood vessels in controls. Dotted boxes represent the areas in which the intensity of the FN1 signal in the extracellular space was measured in the CSA, neocortex (Ncx) and amygdala (Am). The quantification (right) shows the intensity of CSA FN1 signal, normalized relative to the mean of neocortex and amygdala signals in both controls and prenatally exposed PLX3397 pups (ncontrols = 4; nPLX3397 = 4, from at least two distinct litters). (B) High magnification and 3D reconstruction of CSA microglia identified as Cx3cr1gfp-positive cells show a slight increase in the volume of FN1 inside microglia (ncontrols = 4 mice; nPLX3397 = 4 mice; from at least two distinct litters and at least 2 cells quantified and averaged per animal) and a significant increase in the number of microglia with FN1 inclusions in P3 resorbing brains compared with controls (ncontrols = 4; nPLX3397 = 5; mice from at least two distinct litters). Graphs show means ± SEM. Mann-Whitney U test was performed for statistical comparison, p < 0.05; ns, non significant (p > 0.05). Scale bars: 100 μm in (A); 5 μm in (B, immunolabelings); and 2 μm in (3D reconstructions). Am, amygdala; CSA, cortico-striato-amygdalar boundary; Ncx, neocortex.

References

    1. Colonna M., Butovsky O. Microglia Function in the Central Nervous System During Health and Neurodegeneration. Annu. Rev. Immunol. 2017;35:441–468. - PMC - PubMed
    1. Li Q., Barres B.A. Microglia and macrophages in brain homeostasis and disease. Nat. Rev. Immunol. 2018;18:225–242. - PubMed
    1. Hammond T.R., Robinton D., Stevens B. Microglia and the Brain: Complementary Partners in Development and Disease. Annu. Rev. Cell Dev. Biol. 2018;34:523–544. - PubMed
    1. Thion M.S., Ginhoux F., Garel S. Microglia and early brain development: An intimate journey. Science. 2018;362:185–189. - PubMed
    1. Sierra A., Paolicelli R.C., Kettenmann H. Cien Anos de Microglia: Milestones in a Century of Microglial Research. Trends Neurosci. 2019;42:778–792. - PubMed