. 2024 Apr 2;36(4):762-777.e9.
doi: 10.1016/j.cmet.2024.01.006. Epub 2024 Feb 2.

PHLDA2-mediated phosphatidic acid peroxidation triggers a distinct ferroptotic response during tumor suppression

Affiliations

PHLDA2-mediated phosphatidic acid peroxidation triggers a distinct ferroptotic response during tumor suppression

Xin Yang et al. Cell Metab. .

Abstract

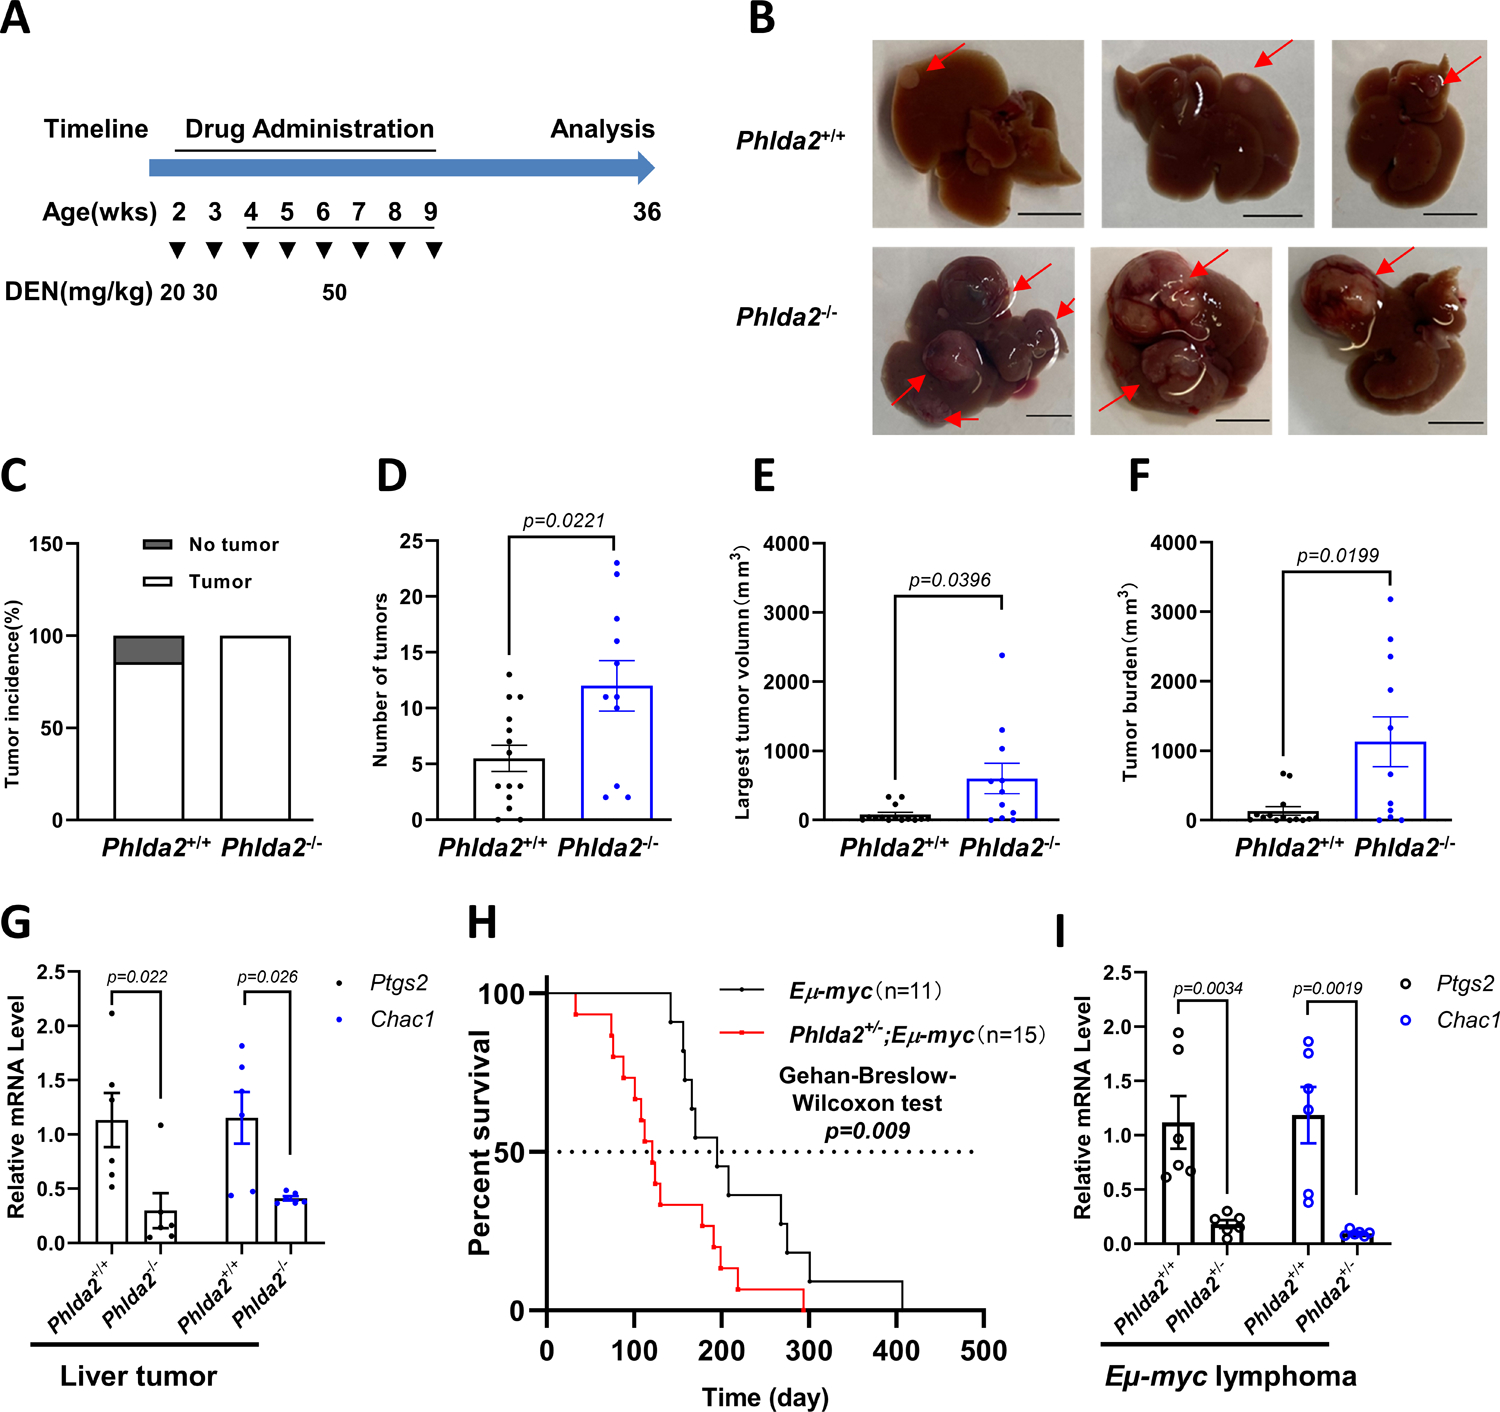
Although the role of ferroptosis in killing tumor cells is well established, recent studies indicate that ferroptosis inducers also sabotage anti-tumor immunity by killing neutrophils and thus unexpectedly stimulate tumor growth, raising a serious issue about whether ferroptosis effectively suppresses tumor development in vivo. Through genome-wide CRISPR-Cas9 screenings, we discover a pleckstrin homology-like domain family A member 2 (PHLDA2)-mediated ferroptosis pathway that is neither ACSL4-dependent nor requires common ferroptosis inducers. PHLDA2-mediated ferroptosis acts through the peroxidation of phosphatidic acid (PA) upon high levels of reactive oxygen species (ROS). ROS-induced ferroptosis is critical for tumor growth in the absence of common ferroptosis inducers; strikingly, loss of PHLDA2 abrogates ROS-induced ferroptosis and promotes tumor growth but has no obvious effect in normal tissues in both immunodeficient and immunocompetent mouse tumor models. These data demonstrate that PHLDA2-mediated PA peroxidation triggers a distinct ferroptosis response critical for tumor suppression and reveal that PHLDA2-mediated ferroptosis occurs naturally in vivo without any treatment from ferroptosis inducers.

Keywords: ALOX12; GPAT3; PHLDA2; ROS; cystine starvation; ferroptosis; lipid peroxidation; phosphatidic acid; phosphatidylethanolamine; tumor suppression.


Conflict of interest statement

Declaration of interests B.R.S. is an inventor on patents and patent applications involving small molecule drug discovery and ferroptosis; holds equity in Sonata Therapeutics; holds equity in and serves as a consultant to Exarta Therapeutics and ProJenX, Inc.; and serves as a consultant to Weatherwax Biotechnologies Corporation and Akin Gump Strauss Hauer & Feld LLP. X.J. is an inventor on patents related to autophagy and cell death and holds equity of and consults for Exarta Therapeutics and Lime Therapeutics.

Figures

Figure 1.
Figure 1.. Identification of PHLDA2 as a critical factor for ferroptosis induced by cystine starvation independent of GPX4 inhibition
(A) Western blot analysis of A375 cells expressing sgNC (negative control), sgPHLDA2, sgACSL4, or sgPHLDA2/ACSL4 (referred to as NC, PHLDA2−/−, ACSL4−/−, or PHLDA2−/−;ACSL4−/− A375 cells). (B)Time-dependent of cystine deprivation induced cell death of Negative control (NC), PHLDA2−/−, ACSL4−/−, or PHLDA2−/−;ACSL4−/−A375 cells. (C) Lipid peroxidation ratio of NC, PHLDA2−/−, ACSL4−/−, or PHLDA2−/−;ACSL4−/−A375 cells cultured in cystine deprived medium for 18h. (D) Cell viability of NC, PHLDA2−/−, ACSL4−/−, or PHLDA2−/−;ACSL4−/−A375 cells treated with RSL-3 for 8h. (E) Lipid peroxidation ratio of NC, PHLDA2−/−, ACSL4−/−, or PHLDA2−/−;ACSL4−/−A375 cells under RSL-3 (500nM) treatment for 4h. (F) Cell viability of A375 cells treated with TBH in the presence of DMSO, DFO (50μM), liproxstatin-1 (Lipro-1, 5μM), ferrostatin-1 (Ferr-1, 5μM), necrostatin-1 (Nec-1, 10μM), or z-VAD-FMK (20μM) for 8h. (G) Cell viability of A375 cells treated with CMH in the presence of DMSO, DFO (50μM), liproxstatin-1 (5μM), ferrostatin-1 (5μM), necrostatin-1 (10μM), or z-VAD-FMK (20μM) for 6h. (H) Cell viability of NC, PHLDA2−/−, ACSL4−/−, or PHLDA2−/−;ACSL4−/−A375 cells treated under TBH treatment for 6h. (I) Lipid peroxidation ratio of NC, PHLDA2−/−, ACSL4−/−, or PHLDA2−/−;ACSL4−/−A375 cells under TBH (200μM) treatment for 3h. (J) Western blot analysis of U2OS cells expressing sgPHLDA2 (referred to as PHLDA2−/− U2OS cells). (K) Cell viability of NC or PHLDA2−/− U2OS cells treated with TBH for 8h. (L) Lipid peroxidation ratio of NC or PHLDA2−/− U2OS cells treated with TBH for 4h. (M) Cell viability of NC or PHLDA2−/− U2OS cells treated with CMH for 6h. (N) Western blot analysis of MCF7 cells expressing sgPHLDA2 (referred to as PHLDA2−/− MCF7 cells). (O) Cell viability of NC or PHLDA2−/− MCF7 cells treated with TBH for 8h. (P) Cell viability of NC or PHLDA2−/− MCF7 cells treated with CMH for 8h. (Q) Western blot analysis of U2OS cells stably expressing empty vector (Vec) or PHLDA2. (R) Cell viability of U2OS Vec or PHLDA2-overexpressing cells TBH for 8h. (S) Western blot analysis of A549 cells stably expressing empty vector (Vec) or PHLDA2. (T)Cell viability of A549 Vec or PHLDA2-overexpressing cells TBH for 8h. Data are the mean ± SD of n = 3 biological repeats. p values were calculated using unpaired, two-tailed Student’s t-test.
Figure 2.
Figure 2.. PHLDA2 plays an important role in modulating ROS-induced ferroptosis by interacting the ALOX12 lipoxygenase
(A) Schematic diagram of the SFB-tagged ALOX12. PHLDA2 peptides identified from ALOX12 associated complexed by liquid chromatography mass spectrometry/mass spectrometry (LC–MS/MS) are shown. A total of 2 unique PHLDA2 peptides have 28.29% coverage of the whole PHLDA2 protein. SFB, triple S protein, Flag, and Streptavidin binding peptide. (B) Western blot of affinity-purified protein complexes from SFB-ALOX12 stable H1299 cells or the parental H1299 cells. (C and D) Western blot analysis of endogenous interaction between ALOX12 and PHLDA2 in U2OS cells. * : non-specific band. (E) U2OS cells were fixed and immune-stained with anti-ALOX12 antibody (red) or anti-PHLDA2 antibody (green). DAPI (blue) represents nucleus. Scale bar, 25 μm. (F) Western blot analysis of the interaction between overexpressed ALOX12 and/or PHLDA2, PHLDA3 in H1299 cells. IP, immunoprecipitation. FH, double epitope Flag and HA tag. (G) In vitro binding assay of GST fused PHLDA2 FL, PH, ΔPH and purified ALOX12. PHLDA2-FL, amino acids 1–152; PHLDA2-PH, amino acids 7–101; PHLDA2-ΔPH, amino acids 102–152. (H) Western blot analysis of NC or PHLDA2−/− ALOX12 Tet-on U2OS cells pre-incubated with doxycycline (0.5μg/mL; Tet-On) for 24h. (I) Representative phase-contrast SYTOX stained images of NC or PHLDA2−/− ALOX12 Tet-on U2OS cells pre-incubated with doxycycline (0.5μg/mL; Tet-On) for 24h then treated with TBH (300 μM) for 6h. Scale bars, 100 μm. (J) Cell death of NC or PHLDA2−/− ALOX12 Tet-on U2OS cells pre-incubated with doxycycline (0.5μg/mL; Tet-On) for 24h then treated with TBH (300μM) for 8h. (K) Lipid peroxidation ratio of NC or PHLDA2−/− ALOX12 Tet-on U2OS cells pre-incubated with doxycycline (0.5μg/mL; Tet-On) for 24h then treated with TBH (300μM) for 4h. (L) Western blot analysis of the interaction between overexpressed ALOX12 and/or PHLDA2 cancer hotspot mutant R35H, R46P in H1299 cells. (M) Cell death of PHLDA2−/− U2OS cells ectopically expressing Vector, GFP tagged PHLDA2 WT or R46P under TBH treatment for 8h. Data are the mean ± SD of n = 3 biological repeats. p values were calculated using unpaired, two-tailed Student’s t-test.
Figure 3.
Figure 3.. PHLDA2 preferentially binds phosphatidic acid (PA) for phospholipid peroxidation
(A) Binding of PHLDA2 to PIP Strips. The spots annotation and relative localization were shown in numbers. Bound PHLDA2 proteins were detected with K-TMBP substrate. (B) Binding of ALOX12 to PIP Strips through PHLDA2. Left: Workflow of ALOX12 binding to PIP Strips by interacting PHLDA2. Right: The spots annotation and relative localization were shown in numbers. Bound ALOX12 proteins were detected with K-TMBP substrate. (C) Oxidation of phospholipids by ALOX12 or ALOX12/PHLDA2 complex in DOPC liposomes. Stearoyl-arachidonoyl-Phosphatidylethanolamine (SAPE, 18:0/20:4-PE). (D) Fragmentation analysis shows typical MS2 spectra of 18:0/20:4-OOH-PE (m/z 798.5291) accumulated during oxidation of corresponding phospholipids by ALOX12 or ALOX12/PHLDA2 complex in DOPC liposomes. Fragmentation patterns of molecular ion with m/z 317.213 corresponds to 20:4-OOH minus water. The fragment with m/z 153.126 is diagnostic for the OOH-groups at position C12 sn2-20:4 of the fatty acyl chain. Inserts: displays structural analysis of phospholipids, where arrows show typical MS/MS fragments. (E) Oxidation of phospholipids by ALOX12 or ALOX12/PHLDA2 complex in DOPC liposomes. Stearoyl-arachidonoyl-Phosphatidic acid (SAPA, 18:0/20:4-PA). (F) Fragmentation analysis shows typical MS2 spectra of 18:0/20:4-OOH-PA (m/z 755.4882) accumulated during oxidation of corresponding phospholipids by ALOX12 or ALOX12/PHLDA2 complex in DOPC liposomes. Fragmentation patterns of molecular ion with m/z 317.213 corresponds to 20:4-OOH minus water. The fragment with m/z 153.126 is diagnostic for the OOH-groups at position C12 sn2-20:4 of the fatty acyl chain. Inserts: displays structural analysis of phospholipids, where arrows show typical MS/MS fragments. (G) Western blot analysis of ACSL4−/−;GPX4−/− A375 cells ectopically expressing Vector, ALOX12 and/or PHLDA2. WT cells were used as control. (H) Cell death ratio of ACSL4−/−;GPX4−/− A375 cells ectopically expressing Vector, ALOX12 and/or PHLDA2 under SAPA: DOPC liposome (25μM or 50μM) incubation with or without Ferr-1 (5μM) for 24h. Data are the mean ± SD of n = 6 (C), n=5 (E) or n=3 (H) biological repeats. p values were calculated using unpaired, two-tailed Student’s t-test.
Figure 4.
Figure 4.. Oxidation of phosphatidic acid (PA), but not phosphatidylethanolamine (PE) is critical for ROS-induced ferroptosis
(A) Western blot analysis of NC, sgGPAT3 #1, or sgGPAT3 #2 A375 cells (referred to as GPAT3−/− #1 or GPAT3−/− #2). * : non-specific band. (B) Cell viability of NC, GPAT3−/− #1, or GPAT3−/− #2 A375 cells treated with TBH for 8h. (C) Cell viability of NC, GPAT3−/− #1, or GPAT3−/− #2 A375 cells under cystine starvation for 24h. (D) Western blot analysis of NC, GPAT3−/− #1, or GPAT3−/− #2 re-expressed GPAT3 A375 cells. Arrows indicate the band of overexpression of GPAT3 (referred to as O.E.) and endogenous of GPAT3 (referred to as endo). * : non-specific band. (E) Cell viability of NC, GPAT3−/− #1, or GPAT3−/− #2 re-expressed GPAT3 A375 cells under cystine starvation for 24h. (F) Changes in PA content. Data are presented as heat map, autoscaled to z scores, and coded blue (low values) to red (high values). Note: A marked change was observed for the contents of PA esterified PUFA molecular species in WT A375 cells after treatment with TBH. In the presence of Ferr-1, the contents of PUFA-PA species remained unchanged in WT cells. (G-I) Total content of PUFA-PA molecular species (G), PUFA-PE (di-acyl and plasmalogen) molecular species (H), and PUFA-PC (di-acyl and plasmalogen) molecular species (I) in WT or GPAT3 KO A375 cells treated with or without TBH. The data show a significant difference in consumption of PUFA-PA for WT after TBH treatment. Peroxidation of PUFAs-PA leads to decrease of phospholipids content in WT A375 cells. (J-L) Total content of oxygenated PA (J), PE (K), and PC (L) in WT or GPAT3 KO A375 cells exposed to TBH with or without Ferr-1. For B, C, and E, data are the mean ± SD of n = 3 biological repeats. For F-L, three biological repeats were measured from NC or GPAT3 KO A375 cells without treatment or with TBH plus Ferr-1 treatment, and four biological repeats were measured from NC or GPAT3 KO A375 cells with TBH treatment. p values were calculated using unpaired, two-tailed Student’s t-test.
Figure 5.
Figure 5.. PHLDA2-mediated ferroptosis is required for tumor suppression in immunodeficient mouse models.
(A) Xenograft tumors of NC, PHLDA2−/−, or ACSL4−/− A375 cells in Nu/Nu mice. n = 8 independent tumors per group. Scale bars, 1cm. (B) Tumor weights from tumors harvested in (A). (C) RT-qPCR of PTGS2 mRNA from tumors harvested in (A). (D) Representative images of immunochemistry 4-HNE staining of the tissues from tumors harvested in (A). 20X, scale bars, 100μm. (E) Immunochemistry 4-HNE score from tumors harvested in (A). (F) Lipid peroxidation ratio of tumor derived cells from (A). (G) Quantification of cleaved caspase 3 positive ratio from (A). (H) Levels of relative Ki67 score from (A). (I) Xenograft tumors of A375 NC or PHLDA2−/− cells in Nu/Nu mice without or with 1mg/kg Ferr-1 treatment. n = 6 independent tumors per group. Scale bars, 1cm. (J) Tumor weights from tumors harvested in (I). (K) Lipid peroxidation ratio of tumor derived cells from (I). For B and J, data are mean ± SEM. of n = 8 (B) or n = 6 (J) tumors. Data are the mean ± SD of n = 8 (E), n=6 (F and K), or n = 4 (C, G, and H) biological repeats. p values were calculated using unpaired, two-tailed Student’s t-test.
Figure 6.
Figure 6.. PHLDA2-mediated ferroptosis is crucial for tumor suppression in the immunocompetent mice
(A) Scheme of the DEN induced HCC mouse model. DEN administration started from 2-week-old mice with indicated dosage. After 8-week DEN administration, mice were grown for additional 27 weeks before analysis. (B) Representative liver pictures from DEN-treated Phlda2+/+ and Phlda2−/− mice. Arrows indicate the locations of tumors. Scale bars, 1cm. (C-F) Tumor incidence (C), the total number of liver tumors (D), the largest tumor volume (E), and the total tumor burden (F) determined from Phlda2+/+ (n = 14) and Phlda2−/− (n = 11) mice. p values were calculated using unpaired, two-tailed Student’s t-test. (G) RT-qPCR of mouse Ptgs2 and Chac1 mRNA from liver tumors harvested from Phlda2+/+ or Phlda2−/− mice. Data are the mean ± SEM of n = 6 tumors. p values were calculated using unpaired, two-tailed Student’s t-test. (H) Kaplan-Meier survival curves of Eμ-Myc (n = 11) or Phlda2−/−; Eμ-Myc (n = 15) mice. p value was calculated using Gehan-Breslow-Wilcoxon test. (I) RT-qPCR of mouse Ptgs2 and Chac1 mRNA of tumors from Eμ-Myc mice and from Phlda2−/−;Eμ-Myc mice. Data are the mean ± SEM of n = 6 tumors. p values were calculated using unpaired, two-tailed Student’s t-test.

References

    1. Hadian K, and Stockwell BR SnapShot: ferroptosis. Cell 181, 1188–1188. e1181 (2020). - PMC - PubMed
    1. Dixon SJ, and Pratt DA Ferroptosis: A flexible constellation of related biochemical mechanisms. Molecular Cell 83, 1030–1042 (2023). - PMC - PubMed
    1. Chen X, Kang R, Kroemer G, and Tang D Broadening horizons: the role of ferroptosis in cancer. Nature reviews Clinical oncology 18, 280–296 (2021). - PubMed
    1. Lei G, Zhuang L, and Gan B Targeting ferroptosis as a vulnerability in cancer. Nature Reviews Cancer, 1–16 (2022). - PMC - PubMed
    1. Ubellacker JM, Tasdogan A, Ramesh V, Shen B, Mitchell EC, Martin-Sandoval MS, Gu Z, McCormick ML, Durham AB, and Spitz DR Lymph protects metastasizing melanoma cells from ferroptosis. Nature 585, 113–118 (2020). - PMC - PubMed