. 2024 Feb 3;15(1):1035.
doi: 10.1038/s41467-024-45336-6.

Gestational diabetes augments group B Streptococcus infection by disrupting maternal immunity and the vaginal microbiota

Affiliations

Gestational diabetes augments group B Streptococcus infection by disrupting maternal immunity and the vaginal microbiota

Vicki Mercado-Evans et al. Nat Commun. .

Abstract

Group B Streptococcus (GBS) is a pervasive perinatal pathogen, yet factors driving GBS dissemination in utero are poorly defined. Gestational diabetes mellitus (GDM), a complication marked by dysregulated immunity and maternal microbial dysbiosis, increases risk for GBS perinatal disease. Using a murine GDM model of GBS colonization and perinatal transmission, we find that GDM mice display greater GBS in utero dissemination and subsequently worse neonatal outcomes. Dual-RNA sequencing reveals differential GBS adaptation to the GDM reproductive tract, including a putative glycosyltransferase (yfhO), and altered host responses. GDM immune disruptions include reduced uterine natural killer cell activation, impaired recruitment to placentae, and altered maternofetal cytokines. Lastly, we observe distinct vaginal microbial taxa associated with GDM status and GBS invasive disease status. Here, we show a model of GBS dissemination in GDM hosts that recapitulates several clinical aspects and identifies multiple host and bacterial drivers of GBS perinatal disease.


Conflict of interest statement

The authors declare no competing interests.

Figures

Fig. 1
Fig. 1. Gestational diabetes enhances in utero group B Streptococcal fetal invasion in a murine model of ascending infection.
a Experimental timeline for GDM induction via a high-fat high-sucrose (HFHS) diet followed by mid-gestational GBS vaginal colonization, and tissue collection on E17.5. Mouse image created with BioRender.com. b Blood glucose concentration and area under the curve during glucose tolerance test on E13.5. c GBS burden in maternal reproductive tract tissues. Proportion of dams with (d) bacteremia (detectable CFU) or (e) fetal reabsorptions. f Fetal weights from control and GDM dams. g Percentage of placentae and fetal livers that were GBS positive (detectable CFU) and (h) corresponding GBS burdens. i Percentage of placental-fetal units that had GBS detected in the placenta with no detection in the corresponding fetal liver. j Placental and (k) fetal liver burdens stratified by fetal sex for a randomly selected subset. Data represent 2 independent (b) and 5 independent replicates (ck). Curves represent medians and error bars are the interquartile ranges (b). Points represent individual samples and lines indicate medians (b, c, f). Box and whisker plots extend from 25th to 75th percentiles and show all points (g, j, k). n = 26 control and 40 GDM dams (ce), n = 41 control and 75 GDM fetuses (f), n = 128 control and 232 GDM placentae, 123 control and 212 GDM fetal livers (g, h), n = 21 control (15 female, 14 male) and n = 30 GDM (19 female, 19 male) paired samples (j, k). Source data are provided as a Source Data file. Data was analyzed by two-tailed Mann−Whitney t test (b, c, f, h, j, k) and two-sided Fisher’s exact test (d, e, g, i).
Fig. 2
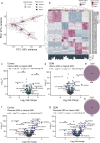
Fig. 2. GBS transcriptional profiling in control and gestational diabetic pregnancy identifies candidate genes important for ascension to the gravid uterus and placental invasion.
a Principal component analysis of GBS transcriptional profiles from vaginal (V), uterine (U), or placental tissue (P) of pregnant control (C) or GDM (G) mice on E17.5 (n = 8/group, two independent experiments for vaginal and uterine and one experiment for placental tissues). Each point represents a sample from an individual mouse, with vaginal-uterine-placental pairs indicated by numeric label. b Heatmap of 40 genes differentially expressed in GBS from uterine or placental tissue compared to GBS from vaginal tissue of pregnant controls and GDM mice. Tissue burden is indicated below the heatmap. Volcano plot of differentially expressed genes (DEGs) in uterine GBS vs. vaginal GBS in (c) pregnant controls or (d) GDM mice. e Venn diagram showing the proportion of GBS DEGs unique vs. shared between comparisons in (c, d). Volcano plot of differentially expressed genes (DEGs) in placental GBS vs. uterine GBS in (f) pregnant controls or (g) GDM mice. h Venn diagram showing unique vs. shared DEGs unique vs. shared between comparisons in (f, g). DEGs were identified via generalized linear model, Log2 fold change >1 and Wald tests with FDR adjusted p value < 0.05. (c, d, f, g). DEGs were identified from independent analysis of experiment 1 and analysis of experiment 1 and 2 combined. Also see Supplementary Tables 1 and 2.
Fig. 3
Fig. 3. Loss of YfhO limits GBS uterine ascension and placental invasion.
a Predicted AlphaFold2 structural modeling of YfhO (SAK_RS10730) protein structure. b E17.5 GBS burdens in the reproductive tract of mice challenged with WT A909, ΔcylE, or ΔyfhO. c Proportion of dams with uterine ascension (detectable CFU) of WT A909 or ΔyfhO. d Placental GBS burden in control and GDM groups. Data for WT A909 are aggregated from all experiments (bd), of which 5 pregnant controls and 10 GDM are from concurrent GBS mutant experiments (n = 39 pregnant controls, n = 61 GDM), mice challenged with ΔcylE (n = 6 pregnant controls, n = 7 GDM) are from 2 independent experiments, and mice challenged with ΔyfhO (n = 7 pregnant controls, n = 13 GDM) are from 5 independent experiments. For placental burdens (d), resulting placentas from dams challenged with WT A909 (n = 63 pregnant controls, n = 116 GDM), ΔcylE (n = 44 pregnant controls, n = 54 GDM), and ΔyfhO (n = 58 pregnant controls, n = 103 GDM) were subjected to CFU quantification. Points represent individual samples and lines indicate medians (b, d). Source data are provided as a Source Data file. Data were analyzed by Kruskal-Wallis followed by Dunn’s multiple comparisons test (b, d) and two-sided Fisher’s exact test (c).
Fig. 4
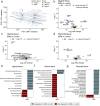
Fig. 4. The reproductive transcriptional landscape is altered in gestational diabetic mice during GBS challenge.
a Principal component analysis of host transcriptional profiles from vaginal (V), uterine tissue (U), or placental tissue (P) of pregnant control (C) or GDM (G) mice on E17.5 (n = 8/group, two independent experiments for vaginal and uterine tissues, one independent experiment for placental tissues). Each point represents a tissue from an individual mouse, with vaginal-uterine-placental pairs indicated by numeric label. Volcano plot of differentially expressed genes (DEGs) in (b) vaginal tissue, (c) uterine tissue, and (d) placental tissue from GDM mice vs. pregnant controls. Gene set enrichment analysis of (e) vaginal, (f) uterine, and (g) placental tissues in gestational diabetic mice vs. pregnant controls. NES = Normalized Enrichment Score. DEGs were identified via generalized linear model, Log2 fold change >1 and Wald tests with FDR adjusted p value < 0.05. fGSEA was performed with a gene set minimum of 15, a gene set maximum of 500, 10,000 permutations, and the Hallmark gene set collections from the Molecular Signatures Database.
Fig. 5
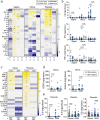
Fig. 5. Cytokine responses are altered in gestational diabetic mice in response to GBS challenge.
a Heatmap of 23 cytokines in vaginal, uterine and placental tissues on E17.5 from pregnant controls and GDM mice that were inoculated with A909 or mock-infected. Scale bar reflects Log 2-fold change. b Select cytokines that were significantly different between groups. Other cytokines are shown in Supplementary Fig. 3. c Heatmap comparing tissue cytokine levels by GBS status on E17.5. Scale bar reflects Log 2-fold change. Select cytokines that were significantly different in (d) uterine tissue and (e) placentae based on whether GBS CFU were detected or not. Other cytokines are shown in Supplementary Fig. 4. Data (a, b) are from 5 independent experiments with n = 14 vaginal, 27 uterine, and 48 placental tissue samples from infected controls, n = 25 vaginal, 37 uterine and 57 placental tissue samples from infected GDM, and n = 10 vaginal, 10 uterine and 7 placental tissues from mock-infected controls and 9 vaginal, 9 uterine, and 13 placental tissues from mock-infected GDM mice. Points represent individual samples and lines indicate medians (b, d, e). Source data are provided as a Source Data file. Cytokine data were analyzed by Kruskal-Wallis test followed by a two-stage linear step-up procedure of Benjamini, Krieger and Yekutieli to correct for multiple comparisons by controlling the false discovery rate (<0.05) (a, b), or by two-tailed Mann-Whitney t test (ce). For heatmaps (a, c), *p < 0.05. Exact p values are provided in Supplementary Figs. 3 and 4.
Fig. 6
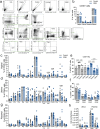
Fig. 6. Immune cell recruitment is dysregulated in gestational diabetic mice.
a Gating strategy for assessing recruitment of basophils (Baso), dendritic cells (DCs), eosinophils, macrophages (Mϕ), mast cells, monocytes, neutrophils (PMNs), NK cells (NKs), B cells, CD4+ T cells, CD4+ regulatory T cells (T regs) and CD8+ T cells by flow cytometry. b Frequency of CD45+ cells. Immune cell frequencies in (c) vaginal and (d) uterine tissues in GBS-infected dams. e Frequencies of CD69 + NK cells across tissues. f Uterine NK cell proportions stratified by CD69 and CD25 expression. g Immune cell frequencies in placentae collected from GBS-infected dams. h Total cell counts of neutrophil and NK cells from placentae. Data (bh) are from 3 independent experiments with each point representing an individual mouse sample (n = 7 pregnant controls and 9 GDM, with 1−2 placentae per dam for a total of n = 12 control placentae and 14 GDM placentae). Source data are provided as a Source Data file. Data were analyzed by two-tailed Mann−Whitney t tests per tissue (bd, fh) or Kruskal-Wallis followed by Dunn’s multiple comparisons test (e).
Fig. 7
Fig. 7. NK and neutrophil depletion differentially impact ascending GBS infection.
a Schematic of experimental timeline for immune cell depletion and subsequent GBS challenge in GDM and pregnant control (ctrl) mice. Mouse image created with BioRender.com. b Frequencies of uterine CD45+ cells in NK-depleted (α-NK1.1), neutrophil-depleted (α-Ly6G), and isotype-treated mice. c Frequencies of uterine NK1.1+ and Ly6G+ cells in isotype-treated or NK-depleted mice. d Frequencies of uterine Ly6G+ and CD11b+ cells in isotype-treated or neutrophil-depleted mice. eg GBS burdens of maternal reproductive tract tissues with (α-NK1.1 or α-Ly6G) or without (isotype control) immune cell depletion in GDM and pregnant control mice. h GBS positive proportions (detectable CFU) and (i) burdens of placentae with or without immune cell depletion in GDM and pregnant control mice. j GBS positive proportions (detectable CFU) and (k) burdens of fetal livers with or without immune cell depletion in GDM and pregnant control mice. Data for isotype treated mice are pooled from 7 independent experiments; 4 NK depletion experiments and 3 neutrophil depletion experiments. For NK depletion experiments, n = 7 pregnant controls and 9 GDM mice that were NK-depleted, n = 7 pregnant controls and 6 GDM mice that were isotype-treated. For neutrophil depletion experiments, n = 7 pregnant controls and 5 GDM mice that were neutrophil-depleted, n = 7 pregnant controls and 6 GDM mice that were isotype-treated. Experimental numbers for placenta-fetal pairs in each group are given as denominators in (h, j). Source data are provided as a Source Data file. Data were analyzed by multiple two-tailed Mann−Whitney t tests with correction for multiple comparisons (c, d), by Kruskal-Wallis test with a post-hoc Dunn’s multiple comparisons test (eg, i, k), or by two-sided Fisher’s exact test (h, j).
Fig. 8
Fig. 8. Gestational diabetes worsens neonatal outcomes associated with GBS infection.
a Survival of neonates from GDM or control dams that were inoculated with GBS on E14.5 and E15.5. n = 45 offspring from 9 control dams and 119 offspring from 19 GDM dams. All remaining neonates were sacrificed on d7 for burden quantification. b Neonatal weights on days 3 and 7 of life, n = 25 control pups and 35−42 GDM pups. GBS burden in pup livers and intestines (c) near time of death before d7 (n = 15 control neonates and 54 GDM neonates), or (d) on d7 (n = 17 control neonates and 35 GDM neonates). e Time to delivery following initial GBS inoculation. f Pup survival, (g) d7 pup weights, and (h) pup GBS liver burdens stratified by sex. All data are from 4 independent experiments. Points represent individual samples and lines indicate medians. Source data are provided as a Source Data file. Data were analyzed via Kaplan-Meier survival analysis with Holm-Šídák correction for multiple comparisons (a, f) and two-sided Mann−Whitney t test (be, g, h).
Fig. 9
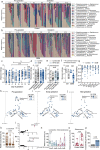
Fig. 9. Pregnancy and gestational diabetes influence the vaginal microbiota composition and specific taxa correlate with GBS offspring dissemination.
a Control (Ctrl) and (b) GDM mice were swabbed every three days from before mating (d-7) until E14 and relative frequency of taxa, collapsed to the genus level, are shown. c Shannon entropy of vaginal communities. d Composite Shannon entropy of all timepoints before (d-7 to −1) and during gestation (E2-E14). e Composite Shannon entropy of all timepoints before mating vs. after mating in non-pregnant mice on matched diets. f Shannon entropy on E14 of mice with or without GBS dissemination to offspring (GBS detected in fetal or pup livers). g Bray Curtis distances between sequential timepoints per mouse. Bray Curtis distance matrix principle coordinate analysis plots at (h) pre-gestation (d-7 to d-1), (i) early gestation (E2-E8), and (j) mid-gestation (E11-E14). k Relative abundance of S. succinus with GDM and control samples combined. l Analysis of Composition of Microbes (ANCOM) based on GDM status. m ANCOM based on GBS offspring dissemination. n Relative abundances of Lactobacillus and Enterobacteriaceae at mid-gestation, stratified by GBS dissemination. o Relative abundance of Enterococcus on E2. p Proportion of dams with Enterococcus (detectable CFU) in uterine or fetal tissues. Points represent individual samples and lines indicate medians. Box-and-whisker plots extend from 25th to 75th percentiles and show all points (cf, k, n, o). Data are from 4 independent experiments, n = 11 controls, n = 21 GDM mice, n = 8 non-pregnant mice on control diet, n = 11 non-pregnant mice on HFHS diet. For GBS dissemination (f, n), n = 7 controls and 16 GDM with GBS, and n = 4 controls and 5 GDM without GBS. For endogenous Enterococcus ascension (p), n = 16 control and 29 GDM dams aggregated from experiments shown in Fig. 1. Source data are provided as a Source Data file. Unless otherwise noted, vaginal samples totaled 360 from the following groups; n = 85 control, 160 GDM, 34 nonpregnant mice on control diet, 53 nonpregnant mice on HFHS diet, 28 negative controls/blanks. Data were analyzed by two-tailed Welch’s t test (c), two-tailed Mann−Whitney t test (df, n, o), two-sided Friedman’s tests with correction for multiple comparisons (g), Kruskal-Wallis test with a post-hoc Dunn’s multiple comparisons test (k) and two-sided Fisher’s exact test (p).

References

    1. Seale AC, et al. Estimates of the burden of group B Streptococcal disease worldwide for pregnant women, stillbirths, and children. Clin. Infect. Dis. 2017;65:S200–s219. doi: 10.1093/cid/cix664. - DOI - PMC - PubMed
    1. Gonçalves BP, et al. Group B streptococcus infection during pregnancy and infancy: estimates of regional and global burden. Lancet Glob. Health. 2022;10:e807–e819. doi: 10.1016/S2214-109X(22)00093-6. - DOI - PMC - PubMed
    1. Russell NJ, et al. Maternal colonization with group B streptococcus and serotype distribution worldwide: systematic review and meta-analyses. Clin. Infect. Dis. 2017;65:S100–s111. doi: 10.1093/cid/cix658. - DOI - PMC - PubMed
    1. Le Doare K, Heath PT. An overview of global GBS epidemiology. Vaccine. 2013;31:D7–D12. doi: 10.1016/j.vaccine.2013.01.009. - DOI - PubMed
    1. Romero R, et al. Evidence that intra-amniotic infections are often the result of an ascending invasion - a molecular microbiological study. J. Perinat. Med. 2019;47:915–931. doi: 10.1515/jpm-2019-0297. - DOI - PMC - PubMed