. 2024 Feb 3;15(2):110.
doi: 10.1038/s41419-024-06493-0.

Targeting AXL induces tumor-intrinsic immunogenic response in tyrosine kinase inhibitor-resistant liver cancer

Affiliations

Targeting AXL induces tumor-intrinsic immunogenic response in tyrosine kinase inhibitor-resistant liver cancer

Yunong Xie et al. Cell Death Dis. .

Abstract

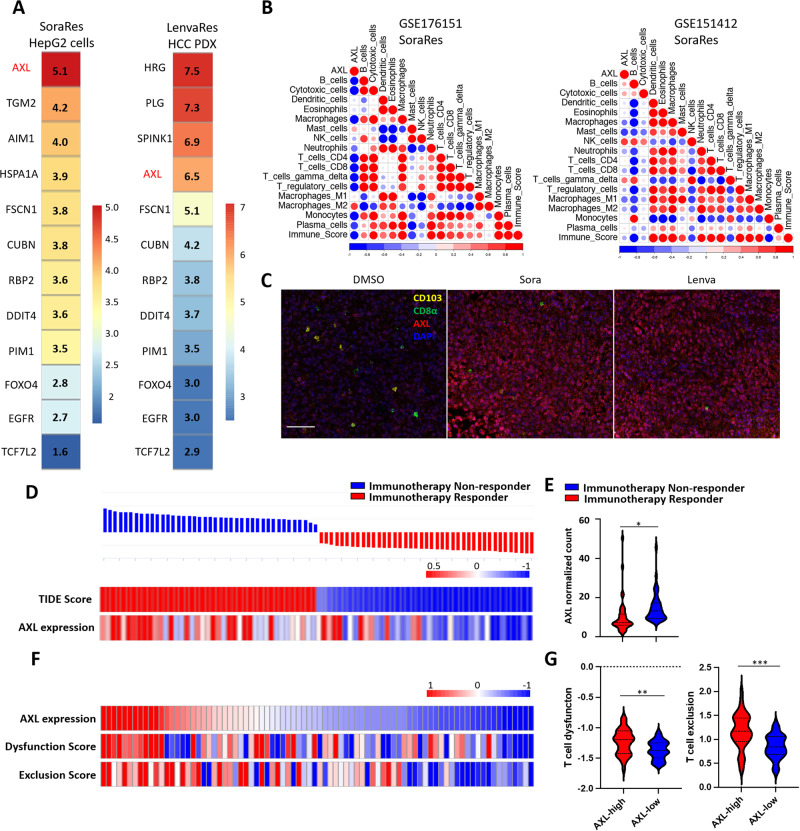
Hepatocellular carcinoma (HCC) is an aggressive malignancy without effective therapeutic approaches. Here, we evaluate the tumor-intrinsic mechanisms that attenuate the efficacy of immune checkpoint inhibitor (ICI) that is observed in patients with advanced HCC who progress on first-line tyrosine kinase inhibitor (TKI) therapy. Upregulation of AXL observed in sorafenib- and lenvatinib-resistant HCCs is correlated with poor response towards TKI and ICI treatments. AXL upregulation protects sorafenib-resistant HCC cells from oxidative stress, mitochondrial damage, and accompanying immunogenic cell death through suppressed tumor necrosis factor-α (TNF-α) and STING-type I interferon pathways. Pharmacological inhibition of AXL abrogates the protective effect and re-sensitizes TKI-resistant HCC tumors to anti-PD-1 treatment. We suggest that targeting AXL in combination with anti-PD-1 may provide an alternative treatment scheme for HCC patients who progress on TKI treatment.


Conflict of interest statement

The authors declare no competing interests.

Figures

Fig. 1
Fig. 1. TKI-resistant HCC is negatively associated with immune-related signatures and show altered infiltration of immune cells.
A Gene Set Enrichment Analysis (GSEA) of TKI sensitive (Sen) versus TKI-resistant (TKIRes) samples; left - Gene Oncology Biological Process (GOBP) and right - Hallmark. B Schematic of sorafenib (Sora), lenvatinib (Lenva) and vehicle control (DMSO) treatment in C57BL/6 N mice bearing xenografts established from murine HCC cell line RIL-175. C Tumor growth curves of C57BL/6 N mice bearing RIL-175 xenografts treated with Sora, Lenva, or DMSO. D Bar charts showing the percentages of intratumoral immune cell populations and CD8+/Foxp3+ ratio in mice treated with Sora, Lenva or DMSO (n = 7 per group). Data representative of two independent experiments. E Representative H&E and IHC images showing CD8α+ and CD103+ cells in the tumor sections treated with either Sora, Lenva, or DMSO. Scale bar = 100 µm and 25 µm (inset). Red arrows indicate positive signals of CD8α and CD103. F Bar charts showing the quantification of CD8α+ and CD103+ cells in three independent, randomly selected fields. *p < 0.05; **p < 0.01; ***p < 0.001; n.s. not significant on one-way ANOVA with Bonferroni’s multiple comparisons test.
Fig. 2
Fig. 2. AXL upregulation in TKI-resistant HCC inversely correlates with tumor infiltration of immune cells and may predict treatment response.
A Lists of upregulated druggable targets in sorafenib-resistant HepG2 cells and lenvatinib-resistant HCC patient-derived xenograft (PDX). The numbers and the color scale bar indicate the expression fold-change of resistant samples versus sensitive samples. B Bubble plots showing the correlation analysis of AXL with immune gene signatures in sorafenib-resistant samples from the datasets GSE176151 (left) and GSE151412 (right). The color scale bar and the size of the dots indicate the Pearson correlation coefficient. C Representative multiplex immunofluorescence images (top) of staining of CD103, CD8α, AXL, and DAPI in residual xenografts after treatment with DMOS, Sora, or Lenva. Scale bar = 50 µm. D Immunotherapy response prediction (top) of TCGA-LIHC patients using Tumor immune dysfunction and exclusion (TIDE) analysis. Heatmap (bottom) of TIDE scores and the corresponding AXL expression (normalized count) of patients from TCGA-LIHC dataset. E Violin plot of AXL expression in immunotherapy responders and non-responders as predicted by TIDE. F Heatmap showing AXL expression, T-cell dysfunction score, and T-cell exclusion score of patients from TCGA-LIHC dataset. G Violin plots of T-cell dysfunction score (left) and T-cell exclusion score (right) in AXL-high and AXL-low patients. *p < 0.05; **p < 0.01; ***p < 0.001 on a two-tailed unpaired Student’s t test.
Fig. 3
Fig. 3. AXL inhibition induces TNF-α expression and promotes STING-type I interferon pathway.
A Gene Set Enrichment Analysis (GSEA) of transcriptomes of AXL-low versus AXL-high HCC patients from TCGA-LIHC; left - Biocarta and right - Hallmark. B ELISA quantification of secretory TNF-α in sorafenib-sensitive (Sen) and sorafenib-resistant (SoraRes) HepG2 cells upon sorafenib treatment. C ELISA quantification of secretory TNF-α in Sen and SoraRes HepG2 cells upon BGB treatment. D Representative FACS plots (top) and percentages (bottom-right chart) of mitoSOX staining in Sen and SoraRes HepG2 cells upon BGB324 treatment. E qRT-PCR quantification of mt16S, mtDloop, and mtCYTB levels in the cytosol extract of Sen and SoraRes HepG2 cells upon BGB324 treatment. F WB analysis of STING pathway in SoraRes HepG2 cells upon BGB324 treatment. G ELISA quantification of secretory IFN-α in Sen and SoraRes HepG2 cells treated with BGB324. H qRT-PCR quantification of ISGs in Sen and SoraRes HepG2 cells treated with BGB324. I GSEA of AXL-high versus AXL-low HCC patients from TCGA-LIHC showing a negative correlation with interferon-stimulated gene signature. *p < 0.05; **p < 0.01; ****p < 0.0001; n.s. not significant on a two-tailed unpaired Student’s t test or one-way ANOVA with Bonferroni’s multiple comparisons test.
Fig. 4
Fig. 4. Knockdown of PDPK1 phenocopies AXL inhibition in sorafenib-resistant HCC.
A WB analysis of p-PDPK1, nuclear p-p65, nuclear histone H3, and TNF-α in SoraRes HepG2 cells with PDPK1 knockdown upon sorafenib treatment. B ELISA quantification of secretory TNF-α in SoraRes HepG2 cells with PDPK1 knockdown upon sorafenib treatment. C Representative FACS plots (left) and percentages (right chart) of mitoSOX staining in SoraRes HepG2 cells with non-target control (shNTC) or PDPK1 knockdown (shPDPK1-C2 and shPDPK1-C5). D qRT-PCR quantification of mt16S, mtDloop, and mtCYTB levels in the cytosol extract of SoraRes HepG2 cells with PDPK1 knockdown upon sorafenib treatment. E WB analysis of STING pathway in SoraRes HepG2 cells with PDPK1 knockdown. F WB analysis of IFN-α in SoraRes HepG2 cells with PDPK1 knockdown upon sorafenib treatment. G ELISA quantification of secretory IFN-α in SoraRes HepG2 cells with PDPK1 knockdown upon sorafenib treatment. H qRT-PCR quantification of mt16S, mtDloop, and mtCYTB levels in the cytosol extract of SoraRes HepG2 cells with PDPK1 knockdown. *p < 0.05; **p < 0.01; ***p < 0.001; ****p < 0.0001; n.s. not significant on one-way ANOVA with Bonferroni’s multiple comparisons test.
Fig. 5
Fig. 5. AXL inhibits sorafenib-induced immunogenic cell death, which could be rescued by TNF-α and IFN-α in sorafenib-resistant HCC.
A WB analysis of secretory HMGB1 in the conditioned media of Sen and SoraRes HepG2 cells upon sorafenib treatment at the indicated concentrations. B ATP concentrations in the conditioned media collected from Sen and SoraRes HepG2 cells upon sorafenib treatment. C Representative FACS plots (left) and percentages (right chart) of membrane calreticulin expression in Sen and SoraRes HepG2 cells upon sorafenib treatment. D WB analysis of secretory HMGB1 in the conditioned media of Sen and SoraRes HepG2 cells treated with BGB324 at the indicated concentrations. E ATP concentrations in the conditioned media collected from Sen and SoraRes HepG2 cells treated with BGB324. F Representative FACS plots (left) and percentages (right chart) of membrane calreticulin expression in Sen and SoraRes HepG2 cells treated with BGB324. G WB analysis of secretory HMGB1 in the conditioned media of SoraRes HepG2 cells treated with either IFN-α or TNF-α alone or combined IFN-α and TNF-α in the presence or absence of sorafenib. H ATP concentrations in the conditioned media collected from SoraRes HepG2 cells treated with either IFN-α or TNF-α alone or combined IFN-α and TNF-α in the presence or absence of sorafenib. I Representative FACS plots (top) and percentages (bottom chart) of membrane calreticulin expression in SoraRes HepG2 cells treated with either IFN-α or TNF-α alone or combined IFN-α and TNF-α in the presence or absence of sorafenib. *p < 0.05; **p < 0.01; ***p < 0.001; n.s. not significant on a two-tailed unpaired Student’s t test for (BF) and one-way ANOVA with Bonferroni’s multiple comparisons test for H, I.
Fig. 6
Fig. 6. Co-treatment of lenvatinib and AXL exerts therapeutic effects in preclinical HCC mouse model.
A Schematic diagram illustrating the treatment scheme of either BGB324 or lenvatinib alone, or in combination with lenvatinib and BGB324 in lenvatinib non-responsive spontaneous liver tumors established by hydrodynamic tail vein injection of oncogenic plasmids. B Representative images of livers resected from mice receiving either BGB324 or lenvatinib alone, or the combination treatment. Scale bar = 1 cm. C Liver to body weight ratio of mice after treatment (n = 8 per group). Data representative of one experiment. D Representative H&E and IHC images showing p-PDPK1, HMGB1, calreticulin, CD8α, and CD103 expression in the tumor sections after single or combination treatment. Scale bar = 100 µm and 50 µm (inset). Red arrows indicating positive signals of CD8α and CD103. E Bar charts showing the quantification of p-PDPK1, HMGB1, calreticulin staining intensities, and CD8α+ and CD103+ cells in three independent fields. **p < 0.01 on a Cox–Mantel log-rank test in the survival curve. *p < 0.05; **p < 0.01; ***p < 0.001; ****p < 0.0001; n.s. not significant on one-way ANOVA with Bonferroni’s multiple comparisons test.
Fig. 7
Fig. 7. AXL inhibition sensitizes TKI-resistant HCC tumors towards immunotherapy.
A Schematic diagram illustrating single and combined anti-PD-1 and BGB324 treatment in secondary xenografts established from residual RIL-175 HCC cells after sorafenib treatment. B Tumor growth curves across the treatment course (n = 7 per group). Data representative of one experiment. C Representative image of resected residual tumor nodules. D Bar chart showing the tumor weight of resected xenografts after treatment. E Representative H&E and IHC images showing p-PDPK1, HMGB1, calreticulin, CD8α, and CD103 expression in the tumor sections after single anti-PD-1 antibody, single BGB324, combined treatment, and respective controls. Scale bar = 100 µm and 25 µm (inset). Red arrows indicate positive signals of CD8α and CD103. E Bar charts showing the quantification of p-PDPK1, HMGB1, calreticulin staining intensities, and CD8α+ and CD103+ cells in three independent fields. *p < 0.05; **p < 0.01; ***p < 0.001; n.s. not significant on one-way ANOVA with Bonferroni’s multiple comparisons test.

References

    1. Vogel A, Meyer T, Sapisochin G, Salem R, Saborowski A. Hepatocellular carcinoma. Lancet. 2022;400:1345–62. doi: 10.1016/S0140-6736(22)01200-4. - DOI - PubMed
    1. Haas L, Elewaut A, Gerard CL, Umkehrer C, Leiendecker L, Pedersen M, et al. Acquired resistance to anti-MAPK targeted therapy confers an immune-evasive tumor microenvironment and cross-resistance to immunotherapy in melanoma. Nat Cancer. 2021;2:693–708. doi: 10.1038/s43018-021-00221-9. - DOI - PMC - PubMed
    1. Patel SA, Nilsson MB, Yang Y, Le X, Tran HT, Elamin YY, et al. IL6 mediates suppression of T- and NK-cell function in EMT-associated TKI-resistant EGFR-mutant NSCLC. Clin Cancer Res. 2023;29:1292–304. doi: 10.1158/1078-0432.CCR-22-3379. - DOI - PMC - PubMed
    1. Paccez JD, Vogelsang M, Parker MI, Zerbini LF. The receptor tyrosine kinase Axl in cancer: biological functions and therapeutic implications. Int J Cancer. 2014;134:1024–33. doi: 10.1002/ijc.28246. - DOI - PubMed
    1. Xu MZ, Chan SW, Liu AM, Wong KF, Fan ST, Chen J, et al. AXL receptor kinase is a mediator of YAP-dependent oncogenic functions in hepatocellular carcinoma. Oncogene. 2011;30:1229–40. doi: 10.1038/onc.2010.504. - DOI - PMC - PubMed

Publication types

MeSH terms