. 2024 Feb 3;15(1):1019.
doi: 10.1038/s41467-024-45391-z.

Micropillar arrays, wide window acquisition and AI-based data analysis improve comprehensiveness in multiple proteomic applications

Affiliations

Micropillar arrays, wide window acquisition and AI-based data analysis improve comprehensiveness in multiple proteomic applications

Manuel Matzinger et al. Nat Commun. .

Abstract

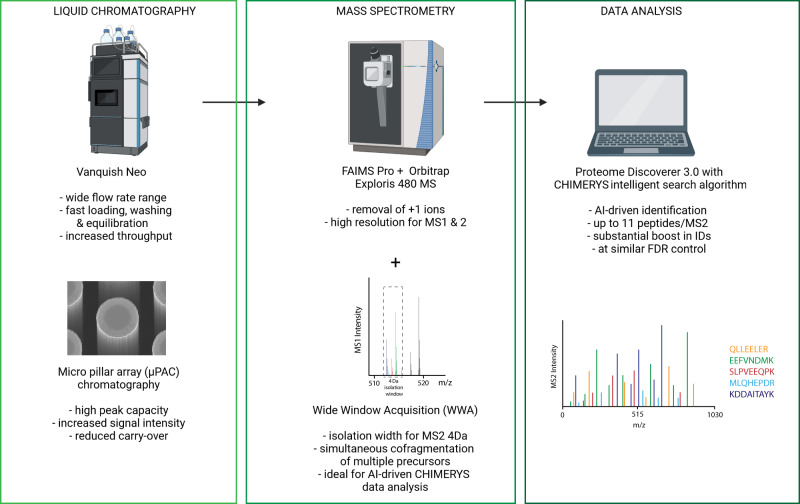
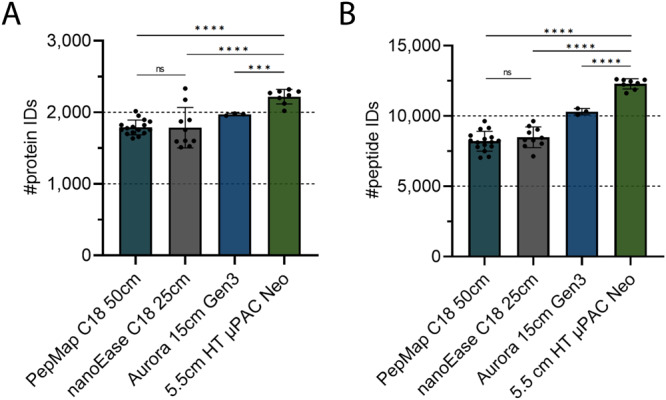
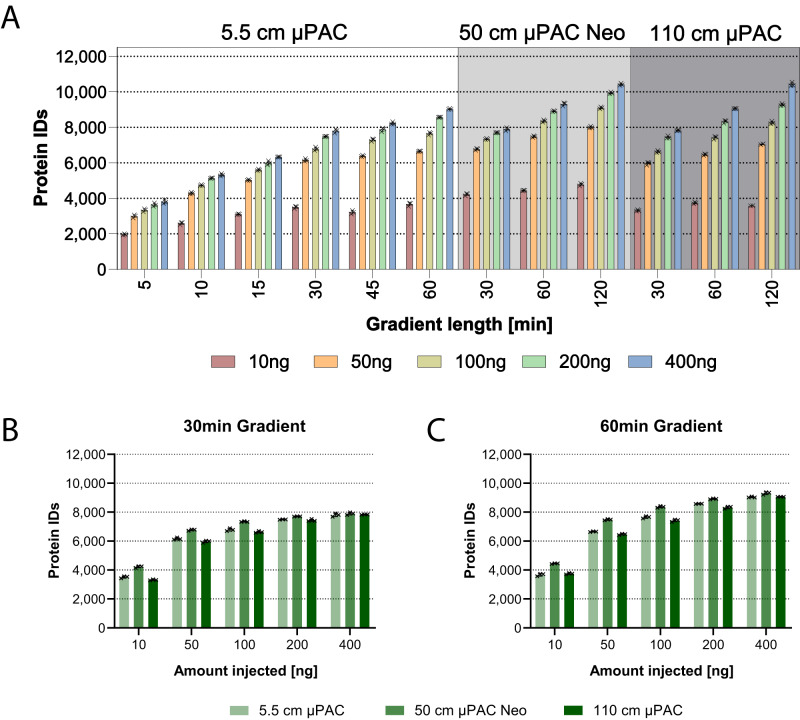
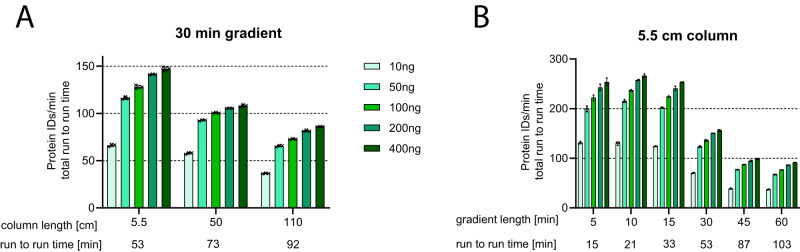
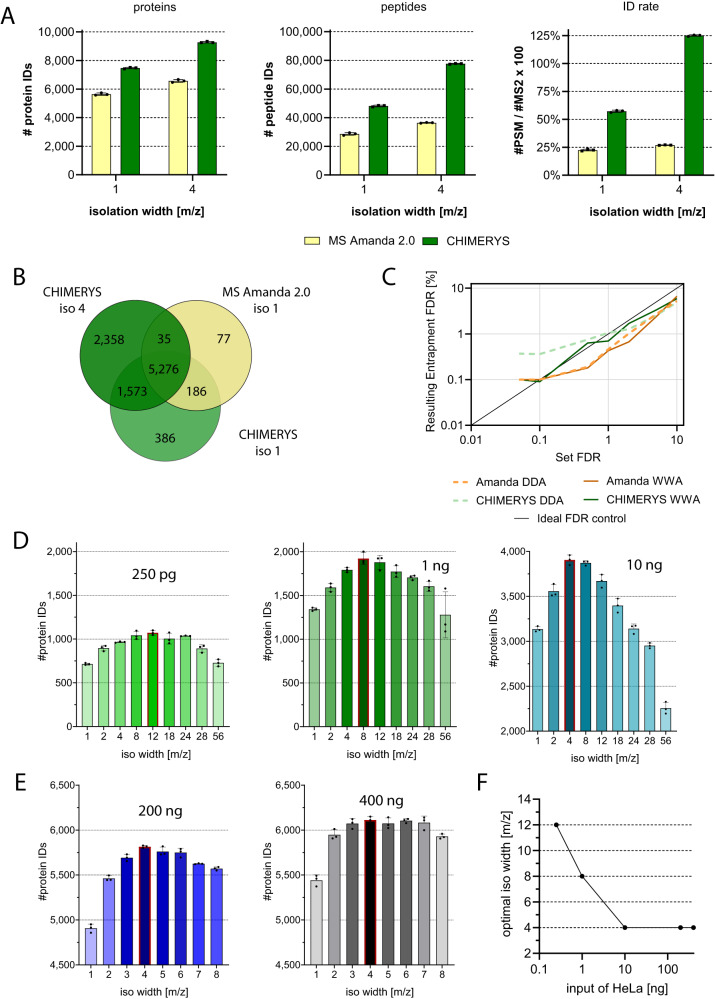
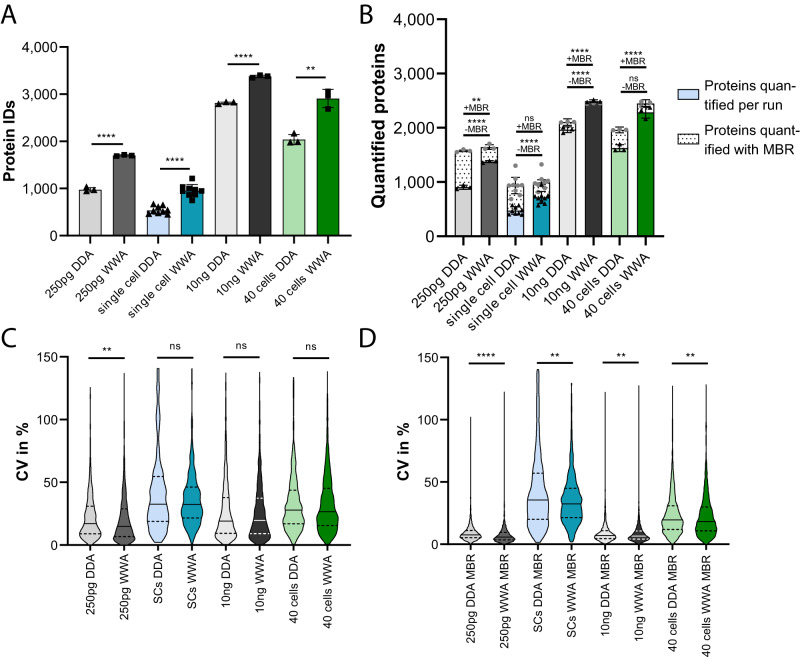
Comprehensive proteomic analysis is essential to elucidate molecular pathways and protein functions. Despite tremendous progress in proteomics, current studies still suffer from limited proteomic coverage and dynamic range. Here, we utilize micropillar array columns (µPACs) together with wide-window acquisition and the AI-based CHIMERYS search engine to achieve excellent proteomic comprehensiveness for bulk proteomics, affinity purification mass spectrometry and single cell proteomics. Our data show that µPACs identify ≤50% more peptides and ≤24% more proteins, while offering improved throughput, which is critical for large (clinical) proteomics studies. Combining wide precursor isolation widths of m/z 4-12 with the CHIMERYS search engine identified +51-74% and +59-150% more proteins and peptides, respectively, for single cell, co-immunoprecipitation, and multi-species samples over a conventional workflow at well-controlled false discovery rates. The workflow further offers excellent precision, with CVs <7% for low input bulk samples, and accuracy, with deviations <10% from expected fold changes for regular abundance two-proteome mixes. Compared to a conventional workflow, our entire optimized platform discovered 92% more potential interactors in a protein-protein interaction study on the chromatin remodeler Smarca5/Snf2h. These include previously described Smarca5 binding partners and undescribed ones including Arid1a, another chromatin remodeler with key roles in neurodevelopmental and malignant disorders.


Conflict of interest statement

The authors declare no competing interests.

Figures

Fig. 1
Fig. 1. Combination of cutting-edge technological advancements in liquid chromatography, mass spectrometry and data analysis to achieve unprecedented proteomic depth.
Scheme of the employed workflow including the use of the 2021-launched Vanquish Neo LC system and innovative µPAC columns, next to state-of-the-art FAIMS Pro and Orbitrap Exploris 480 mass spectrometry in conjunction with WWA as well as the versatile Proteome Discoverer 3.0 platform and the AI-driven CHIMERYS search algorithm. Created with BioRender.com.
Fig. 2
Fig. 2. Benchmarking packed vs µPAC columns.
12.5 ng of a K562 QC mix were injected each using a trap-and-elute setting. Peptides were separated over 30 min using a linear gradient over 30 min from 1–35% buffer B (80% acetonitrile, 0.1% formic acid). Data acquisition using a standard DDA method with an isolation window of m/z 1 and data analysis using CHIMERYS at 1% FDR on peptide and protein level, n = 16, 10, 3 and 8 technical replicates for the PepMap, nanoEase, Aurora and μPAC runs, respectively. Bars indicate means, while error bars indicate standard deviations. A Protein and (B) peptide identifications are visualized. Statistical significance between means of different groups was assessed by two-tailed, unpaired Student t tests for all comparisons but those involving nanoEase and Aurora protein IDs due to differences in variance, for which two-tailed, unpaired Welch’s tests were performed. ns not significant, ***p ≤ 0.001, ****p ≤ 0.0001. Exact p values for (A) µPAC Neo vs PepMap <0.0001, µPAC Neo vs nanoEase 0.0008, nanoEase vs PepMap 0.9715, µPAC Neo vs Aurora 0.0002, and (B) µPAC Neo vs PepMap <0.0001, µPAC Neo vs nanoEase <0.0001, nanoEase vs PepMap 0.3443, µPAC Neo vs Aurora <0.0001. Source data are provided as a Source Data file.
Fig. 3
Fig. 3. Benchmark of µPAC column designs and gradient lengths.
A Bars indicate average number of identified proteins at 1% FDR on protein level when acquiring using different column lengths, gradient times and input amounts indicated of a 8:1:1 H:Y:E proteome mix. Error bars indicate standard deviations, n = 2 technical replicates for 120 min 10 ng and 50 ng n = 3 technical replicates for all other conditions. Bars indicate means per condition. B Comparison of all columns for 30 min gradient from 10–400 ng peptide load. C Comparison of all columns for 60 min gradient from 10–400 ng peptide load. Data for (B) and (C) is already presented in panel A but displayed differently for easier visual comparison. Source data are provided as a Source Data file.
Fig. 4
Fig. 4. Assessment of protein IDs/min.
Identified proteins at 1% peptide and protein FDR were normalized to the complete time between each injection (“run-to-run time”) to evaluate how efficiently the mass spectrometer was utilized over the entire duration of the run. n = 3 technical replicates for each condition, error bars indicate standard deviations, bars indicate means per condition. A Comparison of column types using a fixed gradient length. B Comparison of different gradient lengths using the 5.5 cm column. Source data are provided as a Source Data file.
Fig. 5
Fig. 5. AI-driven search engine CHIMERYS boosts protein IDs substantially at well controlled FDR using wide window acquisition.
A 200 ng proteome-mix H:Y:E = 8:1:1 were separated over 120 min using the 110 cm column prior to MS acquisition and data analysis with the indicated strategy. Typical DDA measurements show improved ID rates on peptide and protein level using CHIMERYS. This boost is even more pronounced when using WWA with precursor isolation widths of m/z 4. n = 3 technical replicates, error bars represent standard deviation, bars indicate means. B CHIMERYS identifies the same proteins as MS Amanda 2.0, and additional proteins improving proteomic coverage of the sample under analysis. Venn diagram showing average protein ID numbers and overlap. n = 1 per condition. C Two mouse co-immunoprecipitation samples were searched with a target database and an additional custom-made decoy database to estimate the FDR control of CHIMERYS and MS Amanda 2.0. The results demonstrate excellent FDR control for both software tools and both the DDA as well as the WWA samples from 1% upwards. Peptide and PSM FDRs are illustrated in Supplementary Fig. 3. n = 1 per condition. D, E Different isolation window sizes were tested to identify the most well-suited precursor isolation window size for maximum identifications using tryptic HeLa digests. Red bars indicate isolation width with most IDs. Color shading reflects IDs: lightest colors indicate lowest and darkest colors highest ID counts/input. n = 3 technical replicates, error bars represent standard deviation, bars indicate means. D low sample input such as 250 pg up to 10 ng measured on the 5.5 cm column and (E) standard sample input from 200 to 400 ng measured on the 50 cm µPAC column. F Optimal isolation width is plotted against injected sample input. n = 1 per condition. Source data are provided as a Source Data file.
Fig. 6
Fig. 6. WWA boosts single cell protein IDs and offers precise protein quantification.
HeLa single and 40 cell digests as well as 250 pg and 10 ng bulk digests were recorded using DDA/WWA and analyzed via CHIMERYS and apQuant either file-by-file or in batches using match-between-runs (MBR). Batches were grouped by acquisition and sample type yielding four batches: (i) 250 pg & 10 ng HeLa bulk DDA, (ii) 250 pg & 10 ng HeLa bulk WWA, (iii) HeLa single & 40 cells DDA, and iv) HeLa single & 40 cells WWA. A shows protein IDs/run without MBR, while (B) depicts quantified proteins without (solid bars) or with MBR (dotted bars). Black triangles indicate quantified proteins/run and gray circles quantified proteins with MBR, n = 9 for single cells, n = 3 for 40 cells, 250 pg and 10 ng bulk digests. A, B Unpaired, two-sided Student t testing was performed except for 40 cells without MBR for which Mann–Whitney testing was employed (non-normality of data). Bars represent means, while error bars indicate standard deviations. A p value for 40 cells DDA vs WWA 0.0025, other p values < 0.0001. B p values without MBR left to right <0.0001, <0.0001, <0.0001, 0.1000, p values with MBR left to right 0.0064, 0.3537, <0.0001, <0.0001. C, D Coefficients of variation (CVs) of proteins quantified in the three replicates with the most quantified proteins/condition were assessed and their distribution plotted. While file-by-file analyses (C) resulted in similar CVs for both DDA and WWA, MBR (D) yielded slightly reduced CVs for all sample types. Full lines represent median CVs, dashed lines indicate quartiles. No data set passed Shapiro–Wilk normality mandating two-sided Mann–Whitney testing. Protein CV numbers/condition from left to right in graph (C) 694, 1055, 312, 565, 1,423, 1,896, 1,114 and 1,641 and in graph (D) 1504, 1579, 744, 826, 2068, 2384, 1854 and 2266. p values from left to right (C) 0.001, 0.5242, 0.6389, 0.4294 (D) <0.0001, 0.0013, 0.0046, 0.0025 (AD) *p ≤ 0.05, **p ≤ 0.01, ***p ≤ 0.001, ****p ≤ 0.0001. ns p > 0.05. Source data are provided as a Source Data file.
Fig. 7
Fig. 7. Recapitulation of well-known interactors from previous low input AP-MS data and additional insights into interactions for mouse Smarca5.
AC Previous low input AP-MS data from ref. was reanalyzed via aforementioned AI-based data analysis and compared to the results reported by Furlan and colleagues. Number of experiments n = 1 for all conditions. A As compared to the MaxQuant data analysis performed by Furlan et al., CHIMERYS allowed the quantification of 76–232% more proteins for two different baits and three different input amounts (4 µg and 12,000 cells for SMC1A, 25,000 cells for CDK8). B Average number of identified peptides/protein is depicted for all proteins (left) and interactors (right), both of which were increased by CHIMERYS for all baits and input amounts (see Supplementary Data 4). C Overlay of all interactors identified at 1% FDR for both data analysis platforms indicated near-identical results (see Supplementary Data 4). DG Six mouse co-immunoprecipitation samples were measured using (i) a 50 cm PepMap column and m/z 1 precursor isolation width, (ii) a µPAC 110 cm column and m/z 1 precursor isolation width, and (iii) a µPAC 110 cm column with m/z 4 precursor isolation width (Supplementary Data 5). D demonstrates continuous improvement upon implementation of the different analytical platform constituents. Number of experiments n = 1 for all conditions. E, F display Volcano plots of the basic and the advanced analytic platforms, respectively, based on limma analyses yielding differential enrichment between flag-tagged and WT Smarca5 bait. Finely dashed lines indicate 1% FDR, the lower line indicates 5% FDR. Green area indicates potential Smarca5 interactors. n = number of proteins included in the volcano plot, E n = 666. F n = 1496. Statistical significance was calculated for both 1% and 5% FDR as described by ref. . G The advanced analytical platform shows high overlap with the classical approach, but identifies more unique potential interactors. Source data are provided as a Source Data file.

References

    1. Shishkova E, Hebert AS, Coon JJ. Now, more than ever, proteomics needs better chromatography. Cell Syst. 2016;3:321–324. doi: 10.1016/j.cels.2016.10.007. - DOI - PMC - PubMed
    1. Bekker-Jensen DB, et al. An optimized shotgun strategy for the rapid generation of comprehensive human proteomes. Cell Syst. 2017;4:587–599.e4. doi: 10.1016/j.cels.2017.05.009. - DOI - PMC - PubMed
    1. Ctortecka C, Mechtler K. The rise of single-cell proteomics. Anal. Sci. Adv. 2021;2:84–94. doi: 10.1002/ansa.202000152. - DOI - PMC - PubMed
    1. Matzinger M, Mayer RL, Mechtler K. Label-free single cell proteomics utilizing ultrafast LC and MS instrumentation: a valuable complementary technique to multiplexing. PROTEOMICS. 2023;23:2200162. doi: 10.1002/pmic.202200162. - DOI - PMC - PubMed
    1. Orsburn BC. Evaluation of the sensitivity of proteomics methods using the absolute copy number of proteins in a single cell as a metric. Proteomes. 2021;9:34. doi: 10.3390/proteomes9030034. - DOI - PMC - PubMed