. 2024 Feb 3;15(1):1038.
doi: 10.1038/s41467-024-45308-w.

ANKRD1 is a mesenchymal-specific driver of cancer-associated fibroblast activation bridging androgen receptor loss to AP-1 activation

Affiliations

ANKRD1 is a mesenchymal-specific driver of cancer-associated fibroblast activation bridging androgen receptor loss to AP-1 activation

Luigi Mazzeo et al. Nat Commun. .

Abstract

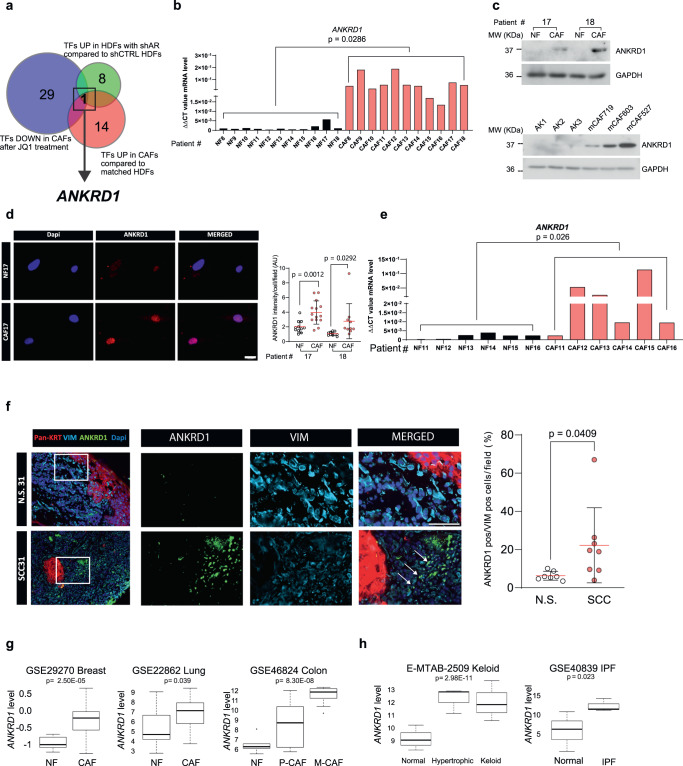
There are significant commonalities among several pathologies involving fibroblasts, ranging from auto-immune diseases to fibrosis and cancer. Early steps in cancer development and progression are closely linked to fibroblast senescence and transformation into tumor-promoting cancer-associated fibroblasts (CAFs), suppressed by the androgen receptor (AR). Here, we identify ANKRD1 as a mesenchymal-specific transcriptional coregulator under direct AR negative control in human dermal fibroblasts (HDFs) and a key driver of CAF conversion, independent of cellular senescence. ANKRD1 expression in CAFs is associated with poor survival in HNSCC, lung, and cervical SCC patients, and controls a specific gene expression program of myofibroblast CAFs (my-CAFs). ANKRD1 binds to the regulatory region of my-CAF effector genes in concert with AP-1 transcription factors, and promotes c-JUN and FOS association. Targeting ANKRD1 disrupts AP-1 complex formation, reverses CAF activation, and blocks the pro-tumorigenic properties of CAFs in an orthotopic skin cancer model. ANKRD1 thus represents a target for fibroblast-directed therapy in cancer and potentially beyond.


Conflict of interest statement

The authors declare no competing interests.

Figures

Fig. 1
Fig. 1. ANKRD1 is a mesenchymal-specific cancer-associated fibroblast (CAF) marker.
a Differentially expressed transcription factors and co-factors (TFs) in published data sets. (1) TFs upregulated (UP) in cancer-associated fibroblasts (CAFs, red, GSE122372), and present in Animal Transcription Factor database (http://bioinfo.life.hust.edu.cn/AnimalTFDB/). (2) TFs downregulated (DOWN) in CAFs treated with BET inhibitor JQ1 (blue, GSE81406). (3) TFs upregulated (UP) in human dermal fibroblasts (HDFs) following AR silencing (green, GSE107321). For all datasets: logFC > 2, p< 0.05 two-way ANOVA test. b RT-qPCR analysis of ANKRD1 expression in skin-SCC patient-derived CAFs and matched normal fibroblasts (NFs) (#8 to #18), amplification cycle normalized to RPLP0 (ΔΔCT). n(strains) = 11, two-tailed unpaired t-test. c ANKRD1 and GAPDH Immunoblot analysis (WB). Top: one experiment including 2 patient’s CAFs and matched HDFs n(strains) = 4. Bottom: second independent experiment with melanoma-derived CAFs and unmatched HDFs n(strains) = 6. d Representative immunofluorescence (IF) images of ANKRD1 (red), DAPI (blue) in CAFs and matched NFs. n(strains) = 2, n(fields) = 11 for NF17 and NF18, 14 for CAF17, 10 for CAF18, mean ± SD, two-tailed unpaired t-test. Scale bar: 20 µm. e RT-qPCR analysis of ANKRD1 mRNA in Laser capture microdissection (LCM) samples from patients’ stroma underlying and flanking in situ skin SCC lesions. Amplification cycles were normalized to ACTB (ΔΔCT). n(strains) = 6, two-tailed unpaired t-test. f ANKRD1 (green), Pan-KRT (red) and VIMENTIN (blue) IF in skin SCC and matched normal skin (NS). n(fields) = 7 for normal, and 8 for SCC, mean ± SD, two-tailed paired t-test with Mann-Whitney correction. Scale bar: 50 µm. The experiment was repeated in other 2 SCC tissues as reported in Supplementary Fig. 1e. g, h ANKRD1 expression in CAFs versus NFs from breast (GSE29270, n = 63), lung (GSE22862, n = 30), colon (GSE46824, n = 34), normal fibroblasts (NF), n = 9, primary tumor CAF (P-CAF), n = 14, metastatic CAF (M-CAF), n = 11. ANKRD1 expression in fibroblasts from hypertrophic scar and keloids (E-MTAB-2509, n = 27), normal fibroblasts = 9, hypertrophic fibroblasts = 9, keloid fibroblasts = 9, and from idiopathic pulmonary fibrosis (IPF) (GSE40839, n = 21), control fibroblasts = 10 and IPF = 11. Moderated t-statistic for two-class comparison. Moderated F-statistic for three-group comparison with Benjamini-Hochberg correction. Minimum value, first quartile (lower box bound), median (centre), third quartile (top box bound), maximum value. Whisker length is a maximum of 1.5 times the interquartile range. Points represent values outside intervals.
Fig. 2
Fig. 2. ANKRD1 is under direct negative control of AR.
a Left: AR-binding peaks (BEDGRAPH) to the ANKRD1 gene in human primary foreskin fibroblasts (HFF = SG1) by ChIPmentation sequencing. Shown is the IGV representation of 13 KB region encompassing the ANKRD1 gene. Right: RPL10 gene was used as negative control for AR binding, no binding peaks were detected. b Validation of AR binding peaks shown in a in three HDF strains to the ANKRD1 promoter versus a negative site (exon 8 of ANKRD1) by ChIPmentation RT-qPCR. AR binding was quantified relative to non-immune IgGs via qPCR amplification. n(strains) = 3, two-way ANOVA. c Global prediction of transcription factor binding using the Cistrome DB toolkit (http://dbtoolkit.cistrome.org/). Regulatory potential (RP) scores for indicated transcription factors are represented with box plots, with boxes showing the interquartile range, center line representing the median value; minimum and maximum values delineate the range of data points. n(total ChIP datasets analyzed) = 200, top 6 TF are shown. Each point represents a separate ChIP-seq dataset. d ChIP-seq data of transcription factors showing the highest overlap ratio in the genomic region bound by AR (Site 1) using the CistromeDB toolkit. AR and other transcription factors are represented using box plots, with boxes showing the interquartile range, center line representing the median value; minimum and maximum values delineate the range of data points. n(total ChIP datasets analyzed) = 83, top 6 TF are shown. Each point represents a separate ChIP-seq dataset. e RT-qPCR analysis of different HFF strains with or without AR silencing using two different shRNAs (shAR#1, shAR#2) versus shRNA control (shCTRL). Fold change (FC) relative to shCTRL, mRNA normalized to RPLP0. n(strains) = 5. Two-way Anova with Dunnett’s multiple comparison’s correction. f WB for ANKRD1 and AR in HDFs with AR silencing (shAR#1 and shAR#2) compared to control HDFs (shCTRL). Anti-GAPDH was used as a loading control. n(strains) = 3. g RT-qPCR analysis of UT-155-treated HDFs (1 µM, 48 h) compared to DMSO-treated HDFs; expressed as relative FC compared to DMSO. mRNA levels are normalized to RPLP0. n(biological replicates) = 5, mean ± SD, unpaired t-test. h IF of ANKRD1 (green), DAPI (blue) in UT-155-treated HDFs (1 µM, 48 h) compared to DMSO-treated HDFs. n(fields) = 13 (DMSO), 9 (UT-155), mean ± SD, unpaired two-tailed t-test. Scale bar: 20 µm. Data points indicate the average number of cells/fields from three independent experiments. i WB of ANKRD1 and TUBULIN in patient-derived JQ1-treated CAFs (0.5 μM, 48 h) versus DMSO treatment. n(strains)=3.
Fig. 3
Fig. 3. ANKRD1 is required for cancer-associated fibroblast (CAF) maintenance.
a RT-qPCR of the indicated genes of patient-derived CAFs infected with ANKRD1-targeting (shANKRD1#1 and #2) and control shRNA (shCTRL), relative to shCTRL and expressed as amplification cycle thresholds normalized to RPLP0. n(strains) = 3, mean ± SD, one-way ANOVA with Dunnett’s multiple comparisons test. b Immunofluorescence analysis of Ki67 in two strains of primary CAFs after ANKRD1 silencing, shown as the percentage of Ki67 positive cells per field. Number of fields for shCTRL in CAF1 (=27) and CAF2 (=27), for shANKRD1#1 in CAF1 (=24), and CAF2 (=28), for shANKRD1#2 in CAF1 (=20) and CAF2 (=27). Mean ± SD. One-way ANOVA with Dunnett’s multiple comparisons test. Ns=non-significant. c Growth enhancing activity of CAFs infected with ANKRD1-targeting (shANKRD1#1 and #2) and control shRNA (shCTRL) on neighboring SCC cells (FaDu) by co-culture assays. Immunofluorescence for Pan-keratin (Pan-KRT; for FaDu cells) and Vimentin (VIM; for CAFs). n(independent experiments) = 3, n(fields) for shCTRL, shANKRD1#1 and shANKRD1#2: 16 (Exp#1 and Exp#2), 10 (Exp#3). n(fields) for FaDu: 11 (Exp#1), 10 (Exp#2 and Exp#3), mean ± SD. One-way ANOVA with Holm-Šídák’s multiple comparisons test. Scale bar: 100 µM. d Representative phase contrast images of spheroid formation. CAFs infected with ANKRD1- targeting and control shRNA (shCTRL) were co-cultured with SCC13 cells on Matrigel-coated plates. Double IF analysis with anti-keratin and -vimentin antibodies. Mean ± SD, n(fields) = 20 (shCTRL), 18 (shANKRD1#1), 20 (shANKRD1#2), One-Way ANOVA with Dunnett’s multiple comparison’s test. Scale bar: 500 µm. Data point show the total fields imaged, from 4 independent experiments. e Organoid invasion assay of admixed CAFs infected with ANKRD1- targeting and control shRNA (shCTRL) and SCCs. Representative bright field images, and VIMENTIN and Pan-KRT IF analysis. Quantification of the invasion area was measured as the difference between the core and the invading area, delimited with dotted lines. n(fields) = 15 (shCTRL), 13 (shANKRD1#1), 12 (shANKRD1#2), 8 (Fadu), mean ± SD, One-way ANOVA with Dunnett’s multiple comparisons test. Scale bar: 200 µm. Data point show the total fields imaged, from 2 independent experiments. f Representative images of H&E staining of back lesions formed by FaDu cells co-injected with CAF#2 cells infected with either shANKRD1#1 or shCTRL vectors in contralateral mouse back skin. n(mice) = 5, mean ± SD. Orange dot: outlier identified by Grubbs test α < 0.1, two-tailed unpaired t-test, p = 0.0291. Scale bar: 500 µm, higher magnification: 100 µm. g Altered FaDu cell density and proliferation were quantified as the number of Pan-KRT positive cells per field. n(mice) = 5. Data points show the n(fields analyzed) = 25 for Control and n(fields analyzed) = 24 for shANKRD1. Mean ± SD, unpaired two-tailed t-test. p = 0.0003. Scale bar: 100 µm.
Fig. 4
Fig. 4. ANKRD1 regulates a CAF transcriptional program of clinical significance.
a Four different primary CAFs were infected with two shRNA targeting ANKRD1 (shANKRD1#1, #2) or shRNA control (shCTRL) were examined by cDNA microarray hybridization and analyzed using the Transcriptomic Analysis Console software (TAC), p-values were calculated by two-way ANOVA test. Volcano-Plot of differentially expressed genes (DEG) was generated by filtering for genes downmodulated or upregulated by shANKRD1 (FC > 1.5, p value < 0.05 and FC < −1.5, p value < 0.05, respectively). Black dotted lines separate genes filtered by FC (x-axis) and p.value (y-axis). b Gene Set Enrichment Analysis (GSEA) of skin CAF signature, myofibroblastic CAF (myCAF) and inflammatory CAF (iCAF) were applied to ANKRD1 silenced and control CAFs. c GSEA analysis of ANKRD1-silenced CAF profile using deposited gene sets of CAF-related pathways. Signatures were downloaded from the GSEA web page (http://www.gsea-msigdb.org/gsea/msigdb/human/genesets.jsp), and the TGFB signature was downloaded from GSE79621. d Cell type expression analysis using the ENRICHR tool (https://maayanlab.cloud/Enrichr/). Analysis was performed by computing genes downmodulated by shANKRD1 (FC < −2, <0.05 p value, measured with two-way ANOVA) into an extensive collection of RNA-seq data sets available through the ARCHS4 web resource (https://maayanlab.cloud/archs4/). The bar graph shows the cell type for which the genes are enriched. Values are expressed as –Log10 (p value). All the genes regulated by ANKRD1 and expressed by the cell types identified through ARCHS4 were used to build the ANKRD1 mesenchymal signature of 269 genes. e Uniform manifold approximation and projection (UMAP) of scRNA-seq in head and neck SCC (HNSCC). The clusters of the different cell types are as reported in ref. . Red boxes indicate the fibroblasts population (left), overlapping with cells expressing ANKRD1 signature (right), 5902 cells from 18 patients were analyzed. f Pearson’s correlation analysis of ANKRD1 signature score and CAFs signature score (GSE122372) in the scRNA-seq of HNSCC shown in (e). g Spearman’s correlation between ANKRD1 expression and ANKRD1 signature in indicated patient’s cohorts derived from the TCGA database (LUSC = 485 patients, CESC = 297 patients, HNSC = 504 patients). h Kaplan-Meier (KM) survival analysis of indicated TCGA cohorts relative to ANKRD1 expression. Cox regression analysis. Results are adjusted for linear variables (age, sex, and stage). P values are indicated for each tumor cohort.
Fig. 5
Fig. 5. ANKRD1 is sufficient for converting HDFs to CAFs.
a Left: immunoblot analysis of ANKRD1 in ANKRD1-overexppressing (ANKRD1OE) or empty vector-control (CTRL) infected HDFs compared to two CAF strains. Right: immunoblot analysis of ANKRD1 and AR expression in HDFs infected with two shRNA targeting AR and/or shCTRL, compared to ANKRD1OE- or CTRL-infected HDFs. Anti-GAPDH was used as a loading control. Panels are derived from the same gel. The experiment was performed once. b RT-qPCR analysis of indicated genes in HDF strains infected with ANKRD1OE relative to CTRL infected HDFs, normalized to RPLP0. n(strains) = 4, mean ± SD, two-tailed unpaired t-test. c Volcano-Plot of differentially expressed genes (DEG) of three different primary HDFs infected with ANKRD1OE or CTRL vectors, generated by filtering for genes downmodulated or upregulated by ANKRD1 overexpression (FC > 1.5, p value < 0.05 and FC < −1.5, p value < 0.05 respectively, two-way ANOVA). Black dotted lines separate genes filtered by FC and p value. d Gene Set Enrichment Analysis (GSEA) was performed using the Affymetrix expression profile of HDFs infected with ANKRD1OE or CTRL vectors. e GSEA analysis of myCAF and iCAF signatures generated by Somerville, et al., 2020 (GSE93313). f Top: GSEA of a gene signature derived from AR silenced HDFs (shAR_UP_signature, GSE107321) was used in the ANKRD1OE profile. The bimodal distribution of AR signature was marked in red for the genes enriched in ANKRD1OE (shAR_UP_ANKRD1OE) and in green for the genes enriched in CTRL (shAR_UP_CTRL). g Pseudo-bulk points using signature averages over fibroblast sub-populations defined by the authors cluster annotations: CAF = Cancer-associated fibroblast, myo = myofibroblast, rest = resting fibroblast. The plot shows average signature scores of the iCAF signature (x-axis) versus the myCAF signature (y-axis). Size of the points represents size of the cluster in terms of cell counts. The color gradient shows average ANKRD1 scores extracted from the top 250 up-regulated genes in ANKRD1 overexpressed cells. Student’s t-test. h GSEA was performed using a gene signature of pulmonary fibrosis derived from the webtool HARMONIZOME (https://maayanlab.cloud/Harmonizome/) under the MeSH ID: D011658. i Violin plots showing the expression of the ANKRD1 signature score in control and ILD derived mesenchymal cells from Habermann et al. (GSE135893). Center line= median. Student t-test. P value is shown for HAS1+ population compared to all other control fibroblasts. j Heatmap displaying read count per million for ANKRD1-ChIP-seq peaks around the TSS (+/− 5 kb). Analysis was performed using deeptools for ChIP analysis (https://deeptools.readthedocs.io/en/develop/). k Direct targets of ANKRD1 obtained by overlapping the list of genes bound by ANKRD1 with the list of genes upregulated by ANKRD1OE (Two-Way ANOVA, FC > 1.5, p value < 0.05). The overlapping genes (ANKRD1 direct UP) were used as gene set for GSEA analysis in the transcriptomic profile of skin CAFs (GSE122372). l Illustration of ANKRD1 binding peaks to ACTA2, HAS2, and COL1A1 promoters displayed using IGV software. Top layer: ANKRD1 binding peaks (black), bottom layer: H3K27ac peaks derived from ENCODE (https://genome.ucsc.edu/ENCODE/) were used to map histone modifications overlapping with ANKRD1 binding regions and downloaded from human dermal fibroblasts (green), human lung fibroblasts (blue), and human foreskin fibroblast (orange).
Fig. 6
Fig. 6. ANKRD1 forms a complex with AP-1.
a Motif analysis of ANKRD1 ChIP-seq, assessed and quantified using MEME and DREME software (https://meme-suite.org/meme/tools/dreme). Values are expressed as log10 E-value. Shown are the top three transcription factor families enriched in ANKRD1 peak profile. b Prediction of transcription factors binding using the GIGGLE score. GIGGLE represents the similarity between user-defined peak profile with deposited ChIP-seq profiles in the Cistrome DB toolkit (http://dbtoolkit.cistrome.org/). GIGGLE scores for top-ranking AP1 family members on ANKRD1-bound CAF genes are represented with box plots, showing the interquartile range, and the center line representing the median value; the minimum and maximum values delineate the range of data points. Each point represents a separate ChIP-seq dataset. c Predicted 3D structure of ANKRD1-AP1(JUN/FOS)-DNA complex. ANKRD1 3D structure was predicted using Alphafold (https://alphafold.ebi.ac.uk/), the partial crystal structure of JUN/FOS/DNA complex was available at PDB protein databank (https://www.rcsb.org/structure/1FOS. HADDOCK software (https://wenmr.science.uu.nl/haddock2.4/) was used to dock the two structures. Shown are the clusters with the lowest HADDOCK score. d Van der Waals energy and Electrostatics energy scores for the top eight protein clusters derived from HADDOCK docking of the ANKRD1-AP1(JUN/FOS)-DNA complex. Represented with box plots, showing the interquartile range, and the center line representing the median value; the minimum and maximum values delineate the range of data points. e Schematic view of ANKRD1-JUN predicted interacting residues. The predicted ANKRD1-AP1(JUN/FOS)-DNA complex was used in 3DBionote (https://3dbionotes.cnb.csic.es/ws) for predicting the interacting residues between ANKRD1 and JUN protein. ANKRD1 is predicted to interact with JUN through the DNA-binding domain (DBD) and Leucine zipper domain (bZip) of JUN. f Glutathione-conjugated beads were used to immunoprecipitate GST-tagged ANKRD1 (100 ng) recombinant protein mixed with the following recombinant proteins, DNA or AP1 inhibitor: Heat-denatured JUN (100 ng), native JUN (100 ng), HIS-tagged FOS (100 ng), DNA oligo enriched with AP1 consensus motif (50 ng), or T-5224 (20 µM). Western blot analysis for ANKRD1, JUN, and FOS. The experiment was repeated once. g In vitro protein interactions. Glutathione-conjugated beads were used to immunoprecipitate GST-tagged ANKRD1 (100 ng) recombinant protein mixed with the following recombinant proteins: HIS-tagged JUN (truncated form 1-241aa, 100 ng), full-length JUN (100 ng), or HIS-tagged FOS (100 ng). Western blot analysis for ANKRD1, JUN, and FOS. All Co-IP proteins were run in the same nitrocellulose membrane. Similarly, all the inputs (1%) were blotted on the same membrane (also for 6f). Experiment was repeated once.
Fig. 7
Fig. 7. ANKRD1 regulates CAF activation through AP-1 interaction.
a Immunoprecipitation assays (IP) with anti-V5 (ANKRD1) or nonimmune (IgG) antibodies from HEK293 cells lysates infected with ANKRD1OE vector followed by immunoblotting for ANKRD1, JUN, and FRA2. IgG: nonspecific signal of IgG heavy chains. The experiment was performed twice. PLA with anti-ANKRD1 or JUN antibodies in HDFs cells infected with ANKRD1OE or CTRL vectors. For ANKRD1-JUN interaction, n(biological replicates) = 2, for ANKRD1-FRA2 interactions, n(biological replicates) = 2 (b) or CAFs matched with HDFs n(strains) = 2; (c). Fluorescence puncta from the juxtaposition of anti-ANKRD1 and JUN antibodies (red), DAPI (blue). Left: representative images. Right: number of puncta per cell, n(cells)>100 per condition, mean ± SD, unpaired two-tailed t-test. Scale bar: 20 µm. PLA with anti-JUN or FRA2 antibodies in HDFs cells infected with an ANKRD1OE or CTRL vector (d) or shCTRL or shANKRD1#1 vector-injected CAFs. Fluorescence puncta from the juxtaposition of anti-FRA2 and JUN antibodies (red), DAPI (blue). Left: representative images Right: number of puncta per cell, n(strains) = 3, n(cells) >100 per condition, mean ± SD, unpaired two-tailed t-test. Scale bar: 20 µm. For d n(biological replicates) = 3, e n(independent experiments) = 2 f ChIPmentation analysis with anti-JUN antibody and non-immune IgGs of three ANKRD1OE or CTRL-vector-infected HDF strains (coloured dots). qPCR amplification of the indicated regions of the ACTA2 and HAS2 genes, expressed as relative enrichment folds over non-immune IgG in ANKRD1 overexpressing versus control HDFs. n(strains) = 3, mean ± SD. g ChIPmentation analysis with anti-V5 (ANKRD1) antibody versus non-immune IgGs of three T-5224 or DMSO-treated (48 h) ANKRD1OE–infected HDF strains (coloured dots). Results of qPCR amplification of the indicated regions for the ACTA2 and HAS2 genes are expressed as enrichment folds over non-immune IgGs in T-5224-treated versus DMSO controls. n(strains) = 3, mean ± SD, unpaired t-test with FDR multiple comparison’s correction. h ChIPmentation analysis with anti-ANKRD1 antibody versus non-immune IgGs of two T-5224 or DMSO-treated (48 h) CAF strains. qPCR amplification of indicated regions for the ACTA2 and HAS2 genes, expressed as enrichment folds over non-immune IgGs in T-5224-treated versus DMSO controls. n(strains) = 2, mean ± SD. i RT-qPCR analysis of indicated genes in T-5224- or DMSO-treated (48 h) HDFs infected with ANKRD1OE or CTRL vectors, expressed relative to CTRL after housekeeping gene normalization. n(strains) = 3, mean ± SD. Two-way ANOVA test.
Fig. 8
Fig. 8. ANKRD1 targeting reproduces the effects of AP1 inhibition on CAF activation.
a RT-qPCR analysis of indicated genes in multiple CAF strains transfected with 100 nM of ANKRD1-FANA or Scrambled-FANA for 72 h. Values are expressed relative to Scrambled-FANA; after house-keeping gene normalization. n(biological replicates) = 6, mean ± SD, two-tailed unpaired t-test. b Immunofluorescence images of ANKRD1 (green), αSMA (red), or DAPI (blue) in CAF#7 transfected with 100 nM of ANKRD1-FANA or Scrambled-FANA for 72 h (left) and quantification (right). n(independent experiment) = 3, mean ± SD, n(fields/condition>10), n(cells/field)>100, two-tailed unpaired t-test. Scale bar: 100 µm. c PLA with anti-JUN and FRA2 antibodies in CAF#7 transfected with 100 nM of ANKRD1-FANA or Scrambled-FANA for 72 h. Fluorescence puncta from the juxtaposition of anti-FRA2 and JUN antibodies (red), DAPI (blue), number of puncta per cell shown. n(independent experiment) = 2, n(cells) >100 per condition, mean ± SD, two-tailed unpaired t-test. Scale bar: 20 µm. d ChIPmentation analysis with anti-JUN antibody of three CAF strains (CAF#1, 2, 7) with an additional independent repeat of CAF7 (CAF7 rep), transfected with 100 nM of ANKRD1-ASO or Scrambled-ASO for 72 h. Results of qPCR amplification of indicated regions of the ACTA2 and HAS2 genes are expressed as enrichment folds over non-immune IgG in ANKRD1-ASO treated CAFs versus scrambled ASO. Results per individual CAF strains are shown as coloured dots. n(biological replicates) = 4, mean ± SD, multiple unpaired t-test. e IF for Pan-KRT (red) and VIM (green) to identify FaDu cells and CAFs, respectively. FaDu cells were co-cultured for 5 days with CAF#7 transfected ANKRD1-FANA or Scrambled-FANA (100 nM, 72 h). n(biological replicates) = 4, n(fields/condition>10), n(cells/field)>100. Mean ± SD, unpaired two-tailed t-test. Scale bar: 100 µm. f Images of H&E-stained back lesions formed by FaDu cells co-injected with CAF#2 transfected with ANKRD1-FANA or Scrambled-FANA (100 nM, 72 h) intradermally in contralateral mouse back skin, following cell embedding in Matrigel. n(mice) = 4, mean ± SD, unpaired two-tailed t-test. Scale bar: 500 µm. g FaDu cell density and proliferation, quantified as Pan-KRT positive cells per field. n(mice) = 4; 4–5 fields/tumor were analyzed. n(fields) = 25 for Scrambled and n(fields) = 27 for ANKRD1-ASO. Mean ± SD, unpaired two-tailed t-test. Scale bar: 100 µm.
Fig. 9
Fig. 9. Schematic representation of the role of ANKRD1 in CAF activation and potential translational relevance.
AR binding to the promoter of the ANKRD1 gene and suppresses its expression (1). Downmodulation of AR at early steps of CAF activation leads to upregulation of ANKRD1 (2). ANKRD1 associates with the AP1 (JUN-FRA2) transcriptional complex and promotes AP1-dependent expression of CAF effector genes (3). Direct targeting of ANKRD1 through stabilized anti-sense oligonucleotides (ASOs), or indirect targeting of ANKRD1 by the AP1 inhibitor T-5224 (4) disrupt the AP1 transcriptional complex and reverses CAF activation (5), suppressing cancer-stromal cell expansion. Created with Biorender.com (https://www.biorender.com/).

References

    1. Koliaraki V, Dotto GP, Buckley CD, Kollias G. Mesenchymal cells in health and disease. Nat. Immunol. 2022;23:1395–1398. doi: 10.1038/s41590-022-01318-8. - DOI - PubMed
    1. Davidson S, et al. Fibroblasts as immune regulators in infection, inflammation and cancer. Nat. Rev. Immunol. 2021;21:704–717. doi: 10.1038/s41577-021-00540-z. - DOI - PubMed
    1. Faget DV, Ren Q, Stewart SA. Unmasking senescence: context-dependent effects of SASP in cancer. Nat. Rev. Cancer. 2019;19:439–453. doi: 10.1038/s41568-019-0156-2. - DOI - PubMed
    1. Chen Y, McAndrews KM, Kalluri R. Clinical and therapeutic relevance of cancer-associated fibroblasts. Nat. Rev. Clin. Oncol. 2021;18:792–804. doi: 10.1038/s41571-021-00546-5. - DOI - PMC - PubMed
    1. Kalluri R. The biology and function of fibroblasts in cancer. Nat. Rev. Cancer. 2016;16:582–598. doi: 10.1038/nrc.2016.73. - DOI - PubMed

MeSH terms