. 2024 Feb 3;15(1):1028.
doi: 10.1038/s41467-024-45429-2.

Local structural preferences in shaping tau amyloid polymorphism

Affiliations

Local structural preferences in shaping tau amyloid polymorphism

Nikolaos Louros et al. Nat Commun. .

Abstract

Tauopathies encompass a group of neurodegenerative disorders characterised by diverse tau amyloid fibril structures. The persistence of polymorphism across tauopathies suggests that distinct pathological conditions dictate the adopted polymorph for each disease. However, the extent to which intrinsic structural tendencies of tau amyloid cores contribute to fibril polymorphism remains uncertain. Using a combination of experimental approaches, we here identify a new amyloidogenic motif, PAM4 (Polymorphic Amyloid Motif of Repeat 4), as a significant contributor to tau polymorphism. Calculation of per-residue contributions to the stability of the fibril cores of different pathologic tau structures suggests that PAM4 plays a central role in preserving structural integrity across amyloid polymorphs. Consistent with this, cryo-EM structural analysis of fibrils formed from a synthetic PAM4 peptide shows that the sequence adopts alternative structures that closely correspond to distinct disease-associated tau strains. Furthermore, in-cell experiments revealed that PAM4 deletion hampers the cellular seeding efficiency of tau aggregates extracted from Alzheimer's disease, corticobasal degeneration, and progressive supranuclear palsy patients, underscoring PAM4's pivotal role in these tauopathies. Together, our results highlight the importance of the intrinsic structural propensity of amyloid core segments to determine the structure of tau in cells, and in propagating amyloid structures in disease.


Conflict of interest statement

The authors declare no competing interests.

Figures

Fig. 1
Fig. 1. Profiling the aggregation propensity of the tau repeat domain.
a Sequence of tau (top) and sliding window approach (15-residue windows incorporating 3-residue increments) used to generate a peptide library spanning the tau repeat domain. b Aggregation score profile of the tau repeat domain, as predicted by CORDAX (purple line) and WALTZ (cyan area). The five regions predicted in total, including PAM4 and the previously identified PHF6* and PHF6, are highlighted in colour-shaded boxes. c, d End-state fluorescence analysis using Th-T (top) and pFTAA (bottom). Peptides showing increased fluorescence compared to the vehicle control (shown as a black bar) were identified as positive for aggregation. Windows containing each one of the predicted APRs are shown in colour-shaded areas as in b. Bar plots indicate mean values +/− SD (n = 3 biologically independent samples). Statistical significance was determined using one-way ANOVA with Tukey’s test for multiple comparisons. e Electron micrographs validating the formation of amyloid-like fibril aggregates by the identified peptide windows. Colour-coded outlines matching the shaded areas shown in bd are used to highlight the corresponding predicted APRs contained in each peptide window. Underlined segments represent the sequences predicted in b. A single representative image is shown (n = 3 independent repeats).
Fig. 2
Fig. 2. Biophysical characterisation of the amyloid-like properties of PAM4.
a Concentration-dependent Th-T kinetic assays of the PAM4 peptide (n = 3 independent repeats), along with end-state Th-T fluorescence values shown in the right bar plot, with individual values shown as points. b Cross-β diffraction pattern produced by oriented fibres containing PAM4 peptide fibrils. Intensity quantification along the meridional and equatorial axis of the pattern indicate the presence of an intense 4.7 Å and 10.9 Å reflection, respectively. c FTIR spectrum produced from fibril deposits of the PAM4 peptide. The prominent 1631 cm−1 and 1680 cm−1 peaks are indicative of a dominant β-sheet secondary structure. d Polarised microscopy reveals an apple-green birefringence shown by PAM4 peptide deposits which typically signifies the presence of amyloid aggregates. (Scale Bar = 100 μM). e Atomic force microscopy imaging of PAM4 fibrils. Multiple helical morphologies can be observed in a single field of view. A single representative image is shown (n = 3 independent repeats). f Electron micrograph of fibrils formed by assembly of the PAM4 peptide. Higher magnifications of individual fibrils (lower images) showcase the presence of highly polymorphic amyloid fibrils. A single representative image is shown (n = 3 independent repeats). gh Concentration-dependent seeding quantification performed by counting the percentage of expressing cells containing fluorescent puncta (n = 3 independent repeats) and representative images of the dose-dependent seeding of tauRD-YFP conjugate construct with PAM4. (Scale bar = 20 μm). i, j Representative images (Bar = 20 μm) and quantification of puncta-positive cells transiently expressing the tauRD-YFP construct, following transduction with 5 μM of peptide seeds. The individual points are colour-coded to match the regions highlighted in Fig. 1, with underlined segments representing the aggregation motifs predicted by Cordax and Waltz. Bar plots represent mean values ± SEM (n = 4 independent samples). The solid and dashed horizontal lines indicate the mean and SEM corresponding to the untreated biosensor condition. Statistical significance was determined using one-way ANOVA with Dunnett’s correction for multiple comparisons.
Fig. 3
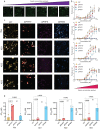
Fig. 3. Cellular screening using deletion constructs of the tauRD reveals a differential relationship of APRs to tau aggregate strains.
a Intracellular seeding of cells expressing tauRD-YFP is reported by counting the number of cells with a punctuate morphology in a concentration-dependent manner upon treatment with rTau seeds. (Scale bar = 20 μm). b Dose-response curves after the treatment of cells expressing tauRD (WT) ΔPHF6*, ΔPHF6 or ΔPAM4 with various concentrations of rTau seeds or seeded with extracts isolated from three independent AD cases (n = 6, three independent samples with two technical repeats for each case). Individual points presented as mean values with ±SD. c Representative images of treated cells with selected seed concentrations (shown in arrow in b, Scale bar = 20 μm). d Inverted effects of the ΔPAM4 and ΔPHF6* on seeding efficiencies, shown as changes in EC50 values, of recombinantly produced or AD extracted tau aggregates validates indicate that a bias towards specific tau polymorphs, in contrast to ΔPHF6 that is generally critical for tau aggregation. Bar plots represent mean values ± SD (n = 3 independent samples).
Fig. 4
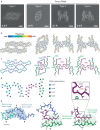
Fig. 4. Cryo-EM structures of PAM4 fibrils show a diversity of folds.
a Slices through the cryo-EM map of each PAM4 fibril structure, made by averaging the central 6x slices of the post-processed, sharpened map to display approximately a single helical layer. Scale bar = 3 nm. b Cryo-EM maps (grey, transparent surface) with fitted atomic models for each solved structure, displayed in the same order as in a. Each peptide chain is coloured blue-to-red from N- to C-terminus and a single helical layer is shown. c PAM4 structures represented as cartoon loops, coloured by subunit fold as indicated in d and with the N-terminal acetyl-Val or Fmoc-Val and C-terminal amide-His residues shown as sticks and labelled. Structures are displayed in the same order as in a. d Schematic representation of individual residues for the distinct monomeric conformations adopted by PAM4 and identified by cryo-EM. e Close-up views of the minimal repeating unit in each structure, displayed with cartoon backbone and stick side chains coloured by subunit as in c. Inter-protofilament steric zipper interactions are highlighted with shaded backgrounds, with arrows indicating the location of the GS-bend formed by Gly355 and Ser356. The insert highlights the formation of an intramolecular salt bridge between Lys353 and Asp358 that further stabilises the monomeric PAM4 FoldC.
Fig. 5
Fig. 5. Polymorphism of ex vivo derived tau fibrils traces back to the innate structural features of PAM4 fibrils.
The PAM4 folds recovered in isolation match its conformation in patient-derived tau amyloid fibril structures belonging to each branch of their previously proposed structural classification, including 3R, 4R and 3R/4R isoforms. Structural alignments reveal that the PAM4 FoldC matches the AD conformation and shows reasonable fit to CTE (3R/4R), as shown by their respective RMSD calculations (1.43 Å and 1.63 Å, respectively). Similarly, FoldB matches the PSP conformation and shows a mismatch at the C-terminal of the region in the PiD conformation, respectively (RMSD values of 0.53 Å and 1.69 Å). Finally, FoldD perfectly overlaps the CBD and AGD (4 R) conformations (RMSD values of 1.19 Å and 1.06 Å, respectively). Zoom-in inlets highlight the superposed PAM4 segments from tau polymorphs and the individual folds observed in isolation using cryoEM. Tau structures are coloured in grey, whereas individual PAM4 folds are coloured as in Fig. 4d.
Fig. 6
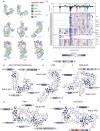
Fig. 6. Thermodynamic analysis of tau fibril polymorphs.
a Mapping the positions of identified aggregation motifs on tau fibrils polymorphs of major structural classes. b, c Heatmap plot indicating the per residue energy contributions for structurally determined tau amyloid fibril cores derived from different patient extracts or fibrils produced in vitro. PDB IDs of individual tau fibril structures are shown on the Y-axis, separated by dashed lines based on disease type, whereas the X-axis indicates tau residue numbers. The top panel bar plot (b) indicates the sum of energy contributions per residue for all structures shown in the heatmap, with the identified aggregation motif regions shown in shaded boxes and coloured as in a. dh Tau fibril polymorphs are stabilised primarily by the identified aggregation motifs. Residue sidechains are shown in ball representation, with important aggregation motif interactions highlighted and the rest of the residue sidechains faded out. Residues are coloured based on the calculated energies shown in c.

References

    1. Kovacs GG. Tauopathies. Handb. Clin. Neurol. 2017;145:355–368. doi: 10.1016/B978-0-12-802395-2.00025-0. - DOI - PubMed
    1. Goedert M, Spillantini MG, Jakes R, Rutherford D, Crowther RA. Multiple isoforms of human microtubule-associated protein tau: sequences and localization in neurofibrillary tangles of Alzheimer’s disease. Neuron. 1989;3:519–526. doi: 10.1016/0896-6273(89)90210-9. - DOI - PubMed
    1. Jeganathan S, von Bergen M, Mandelkow EM, Mandelkow E. The natively unfolded character of tau and its aggregation to Alzheimer-like paired helical filaments. Biochemistry. 2008;47:10526–10539. doi: 10.1021/bi800783d. - DOI - PubMed
    1. Gong CX, Iqbal K. Hyperphosphorylation of microtubule-associated protein tau: a promising therapeutic target for Alzheimer disease. Curr. Med Chem. 2008;15:2321–2328. doi: 10.2174/092986708785909111. - DOI - PMC - PubMed
    1. Wesseling H, et al. Tau PTM Profiles Identify Patient Heterogeneity and Stages of Alzheimer’s Disease. Cell. 2020;183:1699–1713 e1613. doi: 10.1016/j.cell.2020.10.029. - DOI - PMC - PubMed