. 2024 Feb 3;15(1):1042.
doi: 10.1038/s41467-024-45101-9.

Programmed microalgae-gel promotes chronic wound healing in diabetes

Affiliations

Programmed microalgae-gel promotes chronic wound healing in diabetes

Yong Kang et al. Nat Commun. .

Abstract

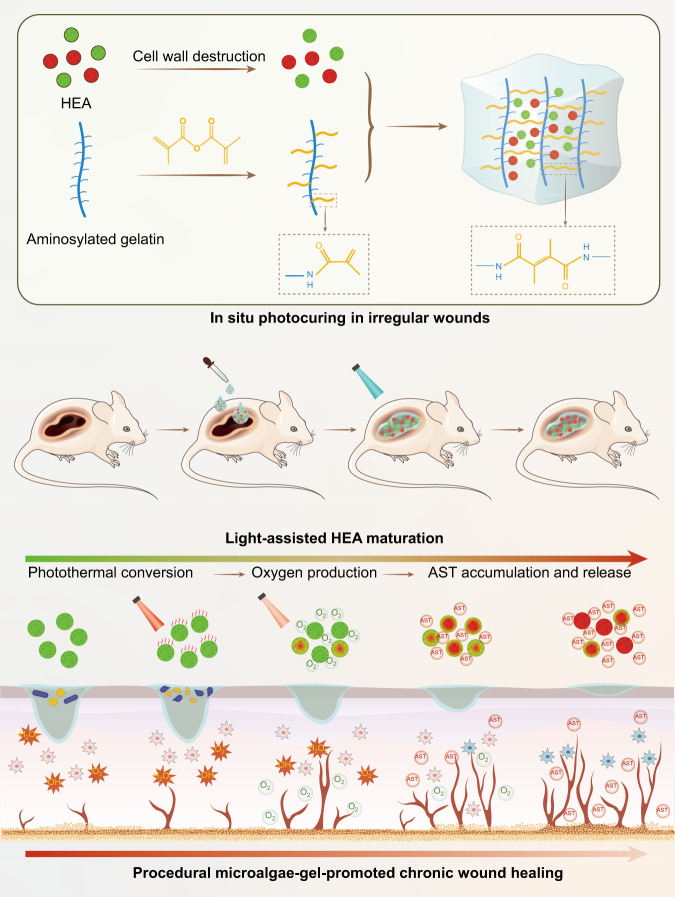
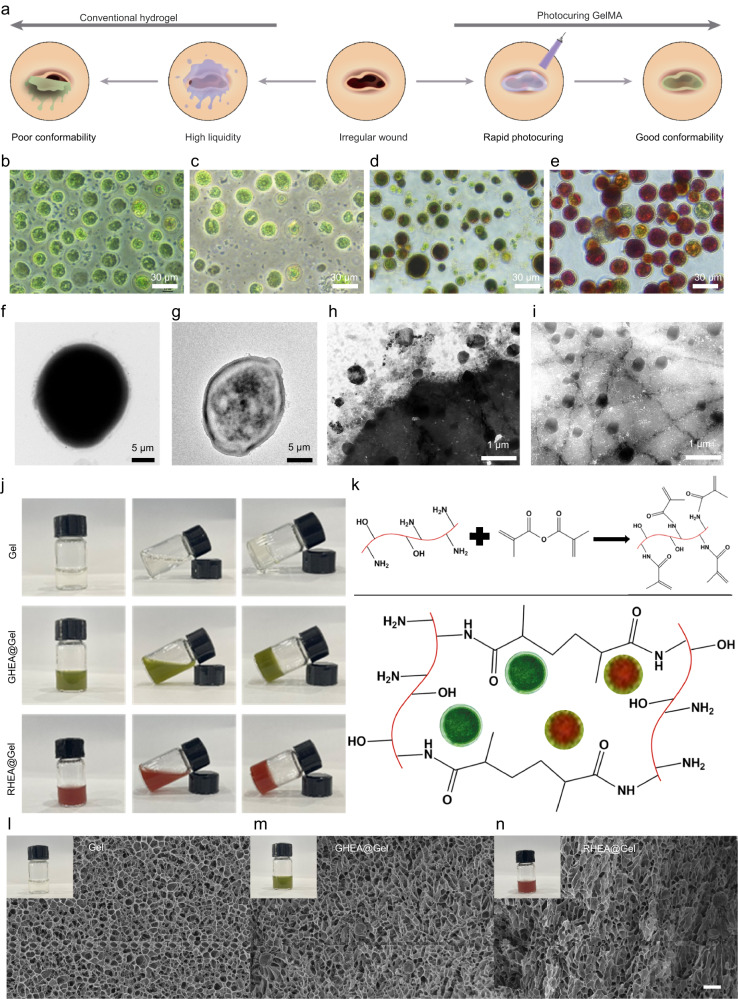
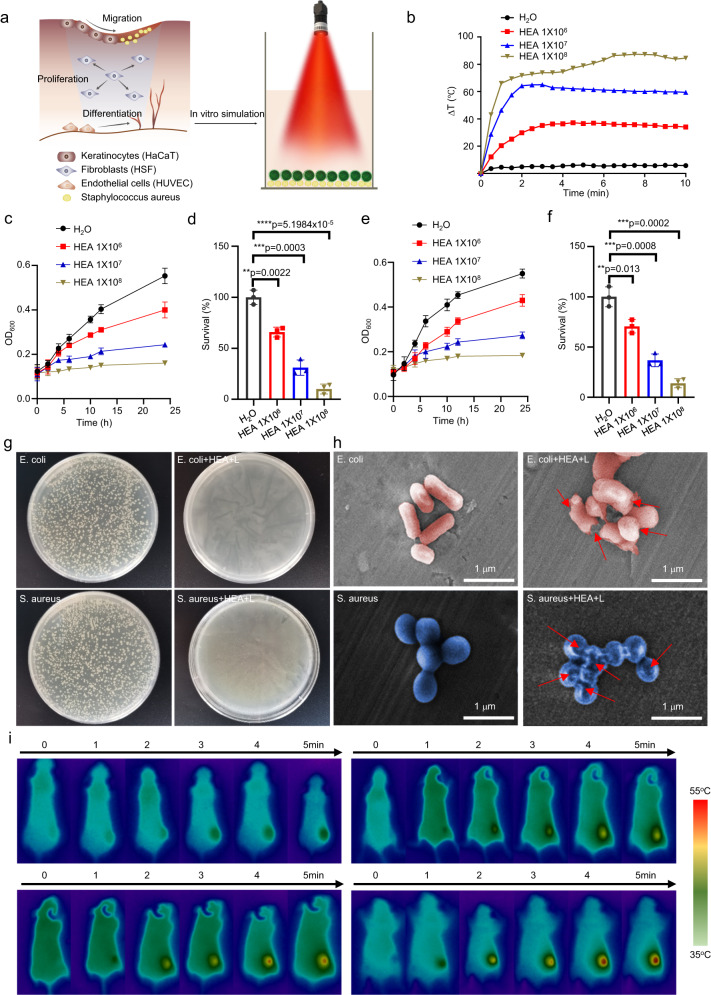
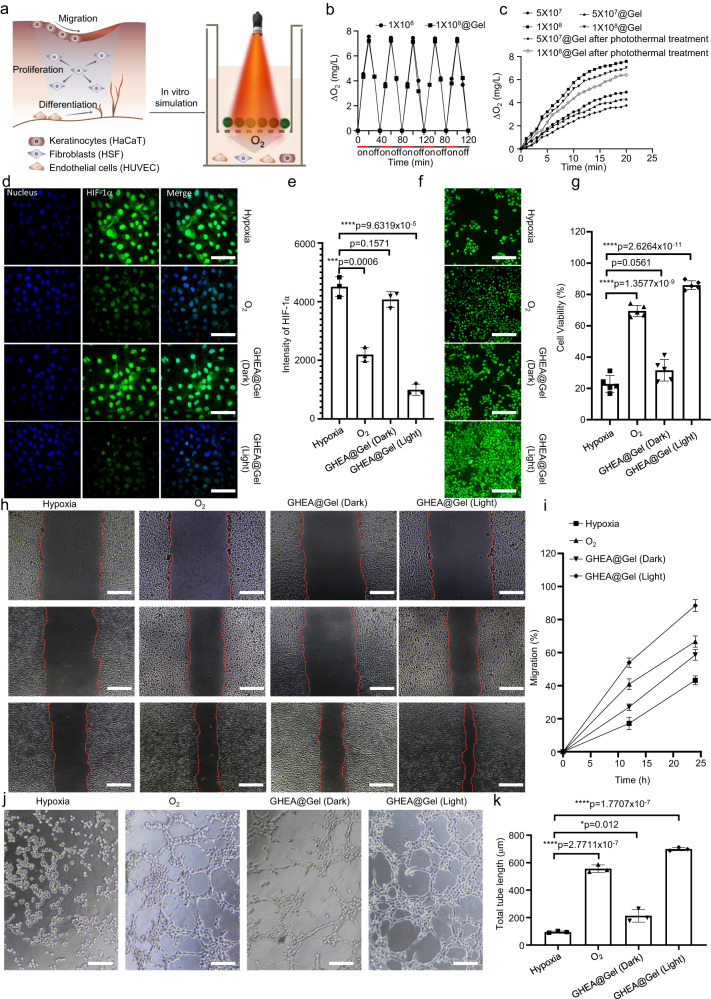
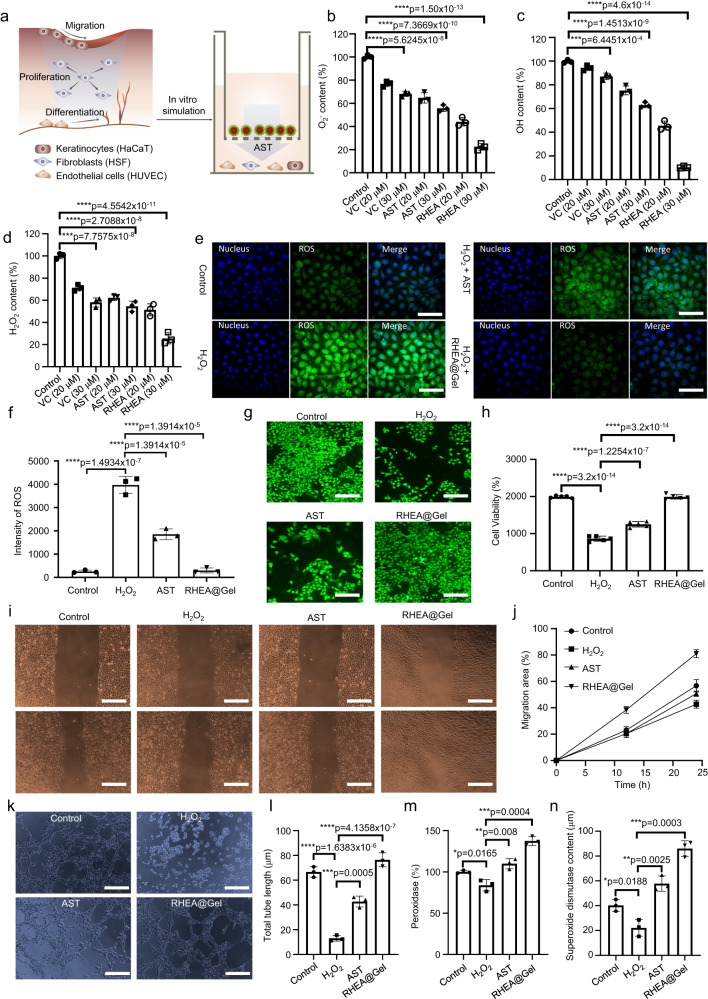
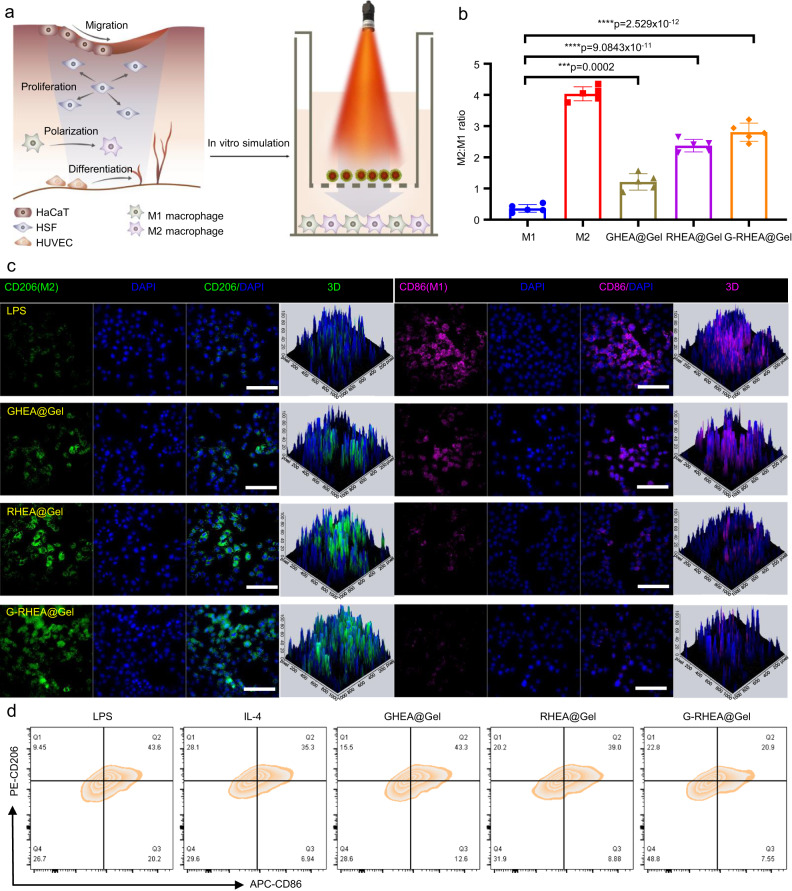
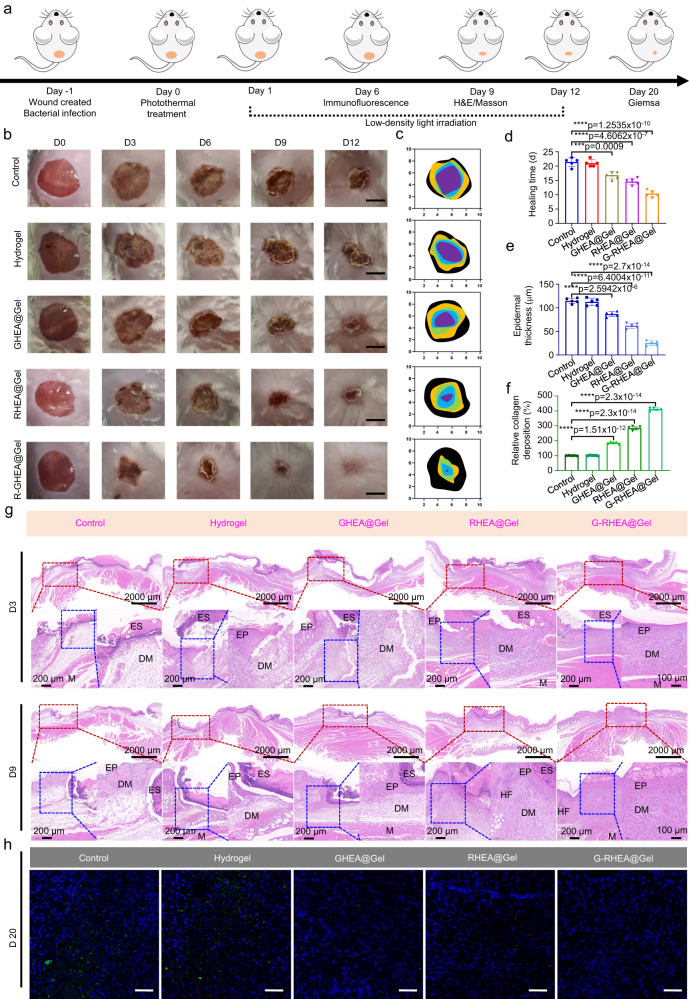
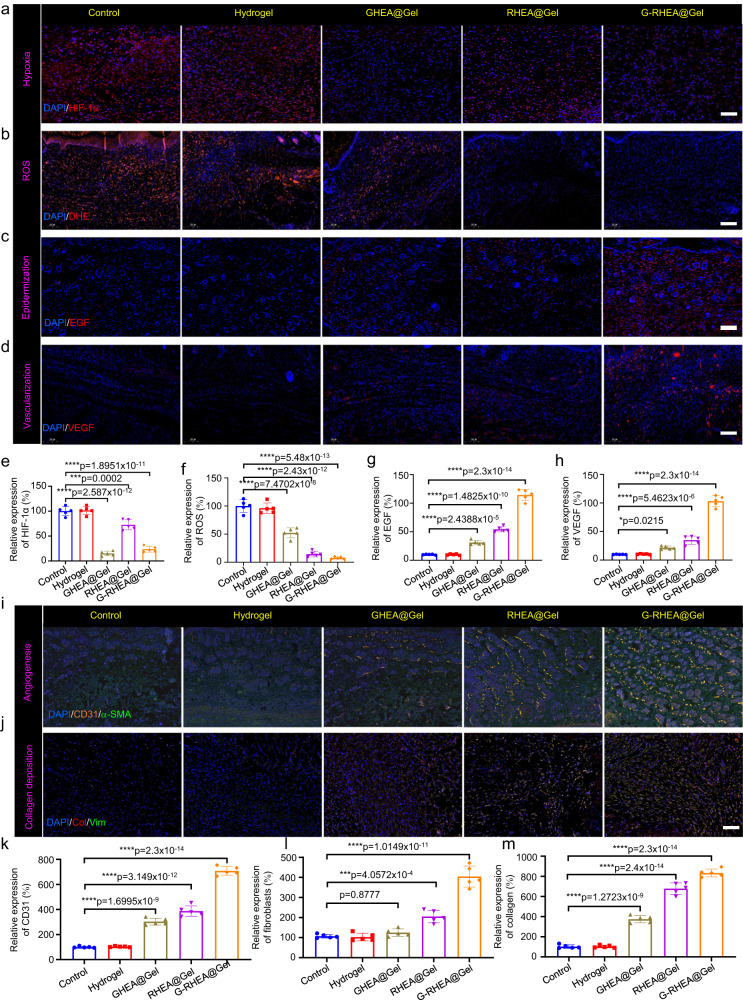
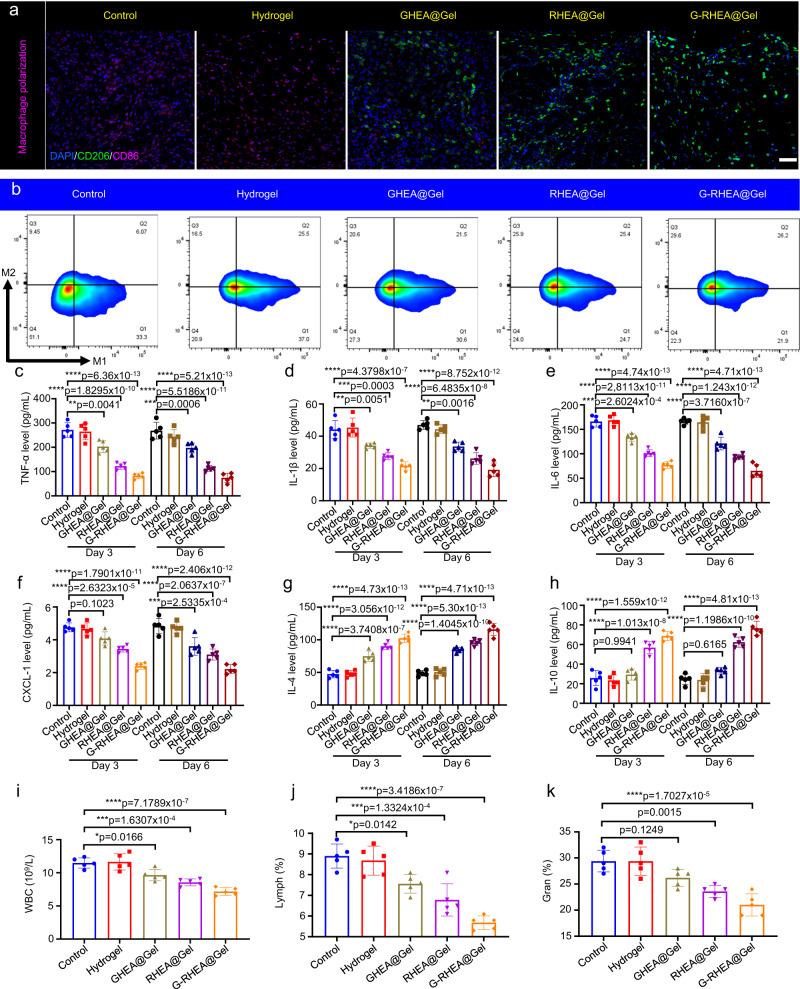
Chronic diabetic wounds are at lifelong risk of developing diabetic foot ulcers owing to severe hypoxia, excessive reactive oxygen species (ROS), a complex inflammatory microenvironment, and the potential for bacterial infection. Here we develop a programmed treatment strategy employing live Haematococcus (HEA). By modulating light intensity, HEA can be programmed to perform a variety of functions, such as antibacterial activity, oxygen supply, ROS scavenging, and immune regulation, suggesting its potential for use in programmed therapy. Under high light intensity (658 nm, 0.5 W/cm2), green HEA (GHEA) with efficient photothermal conversion mediate wound surface disinfection. By decreasing the light intensity (658 nm, 0.1 W/cm2), the photosynthetic system of GHEA can continuously produce oxygen, effectively resolving the problems of hypoxia and promoting vascular regeneration. Continuous light irradiation induces astaxanthin (AST) accumulation in HEA cells, resulting in a gradual transformation from a green to red hue (RHEA). RHEA effectively scavenges excess ROS, enhances the expression of intracellular antioxidant enzymes, and directs polarization to M2 macrophages by secreting AST vesicles via exosomes. The living HEA hydrogel can sterilize and enhance cell proliferation and migration and promote neoangiogenesis, which could improve infected diabetic wound healing in female mice.


Conflict of interest statement

The authors declare no competing interests.

Figures

Fig. 1
Fig. 1. Schematic illustration of the preparation and mechanism of the HEA@Gel-based wound healing strategy.
Irregular wound dressings were obtained by in-situ photocuring. By modulating light intensity, HEA@Gel can be programmed to perform antibacterial activity, oxygen supply, ROS scavenging, and immune regulation. HEA Haematococcus, AST astaxanthin.
Fig. 2
Fig. 2. HEA@Gel preparation and characterization.
a Schematic representation of the benefits of photocuring GelMA. be Photographs of various stages of the HEA. f TEM image of the HEA. g TEM image of HEA protoplasts. hi TEM images of AST vesicles released from HEA. j Photographs of Gel, GHEA@Gel, and RHEA@Gel. k The photocrosslinking mechanism of GelMA. Cryo-scanning electron microscopy images of (l) Gel, (m) GHEA@Gel, and (n) RHEA@Gel. Scale bars, 20 μm. The insets in (ln) represented the photographs of of Gel, GHEA@Gel, and RHEA@Gel, respectively. For these morphological characterizations of the fabricated Gel, GHEA@Gel, and RHEA@Gel, each experiment was repeated three times independently with similar results.
Fig. 3
Fig. 3. GHEA@Gel photothermal conversion and sterilization.
a Schematic illustration of the photothermal conversion and sterilization of GHEA@Gel. b Photothermal transformation of GHEA@Gel. The data are presented as the mean ± s.d. (n = 3 independent experiments). c, d Quantitative measurement of E. coli cells treated with GHEA and a 658 nm laser (0.5 W/cm2). The data are presented as the mean ± s.d. (n = 5 biologically independent cells). Statistical differences were analyzed by Student’s two-sided t-test. e, f Quantitative measurement of S. aureus cells treated with GHEA and a 658 nm laser (0.5 W/cm2). The data are presented as the mean ± s.d. (n = 5 biologically independent cells). Statistical differences were analyzed by Student’s two-sided t-test. g The corresponding digital images of S. aureus and E. coli bacterial colonies grown on LB agar plates subjected to various treatments. Each experiment was repeated independently three times with similar results. h The corresponding SEM images of S. aureus and E. coli bacteria subjected to various treatments. Each experiment was repeated independently three times with similar results. i Photothermal images of mice receiving various treatments. Each experiment was repeated independently three times with similar results.
Fig. 4
Fig. 4. O2 release from the GHEA@Gel.
a Schematic representation of O2 release from GHEA@Gel. b Comparison of the dissolved O2 release of GHEA@Gel under light and dark conditions. The data are presented as the mean ± s.d. (n = 3 independent experiments). c The release of dissolved O2 at various GHEA concentrations and laser intensities. d, e GHEA@Gel decreased HIF-1α expression in HSFs induced by high glucose concentrations. Scale bars, 100 μm. Each experiment was repeated independently three times with similar results. The data are presented as the mean ± s.d. (n = 3 independent cells). Statistical differences were analyzed by Student’s two-sided t-test. f, g Proliferation of HSF cells treated with 33 mM glucose under hypoxia (6 h) for various durations. Scale bars, 200 μm. Each experiment was repeated independently three times with similar results. The data are presented as the mean ± s.d. (n = 3 independent cells). Statistical differences were analyzed by Student’s two-sided t-test. h, i Representative images and quantification of the migration of HaCaT cells. The scale bars are 200 μm. Each experiment was repeated independently three times with similar results. The data are presented as the mean ± s.d. (n = 3 independent cells). j, k Representative images and quantification of HUVEC tube formation. Scale bars, 200 μm. Each experiment was repeated independently three times with similar results. The data are presented as the mean ± s.d. (n = 3 independent cells). Statistical differences were analyzed by Student’s two-sided t-test.
Fig. 5
Fig. 5. ROS scavenging ability of RHEA@Gel.
a Schematic representation of ROS scavenging by RHEA@Gel. b O2-, (c) OH-, and (d) H2O2-scavenging performance in response to various treatments. The data are presented as the mean ± s.d. (n = 3 independent cells). Statistical differences were analyzed by Student’s two-sided t-test. e, f ROS scavenging ability of RHEA@Gel in HSF. Scale bars, 100 μm. Each experiment was repeated independently three times with similar results. The data are presented as the mean ± s.d. (n = 3 independent cells). Statistical differences were analyzed by Student’s two-sided t-test. g, h The proliferation of HSF cells treated with 33 mM glucose and H2O2 in different groups. Scale bars, 200 μm. Each experiment was repeated independently three times with similar results. The data are presented as the mean ± s.d. (n = 3 independent cells). Statistical differences were analyzed by Student’s two-sided t-test. i, j Images and quantification of the migration of HaCaT cells. Scale bars, 200 μm. Each experiment was repeated independently three times with similar results. The data are presented as the mean ± s.d. (n = 3 independent cells). k, l Representative images and quantitative analysis of tube formation in HUVECs. Scale bars, 200 μm. Each experiment was repeated independently three times with similar results. The data are presented as the mean ± s.d. (n = 3 independent cells). m Peroxidase and (n) superoxide dismutase expression in the different groups. The data are presented as the mean ± s.d. (n = 3 independent cells). Statistical differences were analyzed by Student’s two-sided t-test.
Fig. 6
Fig. 6. Regulation of macrophage polarization by RHEA@Gel.
a Schematic illustration of the regulation of macrophage polarization by RHEA@Gel. b Relative quantification of the ratio of M2 to M1 macrophages. The data are presented as the mean ± s.d. (n = 5 independent cells). Statistical differences were analyzed by Student’s two-sided t-test. c Characteristic fluorescence images of Raw264.7 cells stained with CD206 (green) and CD86 (pink) under inflammatory stimulation. Scale bar: 100 µm. d Flow cytometry analysis of macrophage polarization after different treatments. Each experiment was repeated independently three times with similar results.
Fig. 7
Fig. 7. Effects of HEA@Gel on enhancing wound healing in infected diabetic mice.
a Schematic depiction of the sequence of animal experiments conducted to evaluate the therapeutic efficacy of HEA@Gel. b Photographs of representative wounds from various treatment groups. c Quantitative investigation of the wound area. Each experiment was repeated five times independently with similar results. d Statistical analysis of the healing time. The data are presented as the mean ± s.d. (n = 5 independent mice). Statistical differences were analyzed by Student’s two-sided t-test. e, f Relative quantitative analysis of collagen deposition and epidermal thickness on day 9. The data are presented as the mean ± s.d. (n = 5 independent mice). Statistical differences were analyzed by Student’s two-sided t-test. g HE staining on days 3 and 9. Each experiment was repeated five times independently with similar results. h Immunohistochemical staining of the wound on day 20. The scale bar is 100 μm. Each experiment was repeated five times independently with similar results.
Fig. 8
Fig. 8. Analysis of the processes and mechanisms of wound healing for various treatments.
a HIF-1α expression, (b) ROS content, (c) EGF expression, and (d) VEGF expression on day 6 under various treatments. The scale bar is 100 μm. Each experiment was repeated independently three times with similar results. eh Quantitative investigation of HIF-1α, ROS, EGF, and VEGF expression on day 6 in response to various treatments. The data are presented as the mean ± s.d. (n = 5 independent mice). Statistical differences were analyzed by Student’s two-sided t-test. Double immunofluorescence staining of (i) α-SMA (yellow) and CD31 (green) and (j) the fibroblast markers vimentin (green) and collagen (red) in response to various treatments on day 6. Scale bar, 100 μm. Each experiment was repeated independently three times with similar results. km Quantitative investigation of CD31 expression, neovascularization, and collagen I deposition on day 6 in response to various treatments. The data are presented as the mean ± s.d. (n = 5 independent mice). Statistical differences were analyzed by Student’s two-sided t-test.
Fig. 9
Fig. 9. Regulation of macrophage polarization and the immune microenvironment by HEA@Gel in vivo.
a Double immunofluorescence staining of CD206 (green) and CD86 (pink) on day 6 in response to various treatments. Scale bar, 100 μm. Each experiment was repeated independently three times with similar results. b Analysis of the ratio of M2 to M1 macrophages in response to various treatments by flow cytometry on day 6. Each experiment was repeated independently three times with similar results. In vivo wound concentrations of (c) TNF-α, (d) IL-1β, (e) IL-6, (f) CXCL-1, (g) IL-4, and (h) IL-10 after 3 and 6 days of treatment. i White blood cell count, (j) lymphocyte count, and (k) neutrophil percentage (gran%) in peripheral blood. The data are presented as the mean ± s.d. (n = 5 independent mice). Statistical differences were analyzed by Student’s two-sided t-test.

References

    1. Chen H, et al. Dissolved oxygen from microalgae-gel patch promotes chronic wound healing in diabetes. Sci. Adv. 2020;6:eaba4311. doi: 10.1126/sciadv.aba4311. - DOI - PMC - PubMed
    1. Hart T, Milner R, Cifu A. Management of a diabetic foot. JAMA. 2017;318:1387–1388. doi: 10.1001/jama.2017.11700. - DOI - PubMed
    1. Botusan IR, et al. Stabilization of HIF-1α is critical to improve wound healing in diabetic mice. Proc. Natl Acad. Sci. 2008;105:19426–19431. doi: 10.1073/pnas.0805230105. - DOI - PMC - PubMed
    1. Thangarajah H, et al. HIF-1α dysfunction in diabetes. Cell Cycle. 2010;9:75–79. doi: 10.4161/cc.9.1.10371. - DOI - PubMed
    1. Thangarajah H, et al. The molecular basis for impaired hypoxia-induced VEGF expression in diabetic tissues. Proc. Natl Acad. Sci. 2009;106:13505–13510. doi: 10.1073/pnas.0906670106. - DOI - PMC - PubMed