. 2024 Feb 3;21(1):41.
doi: 10.1186/s12974-024-03032-8.

Immunoregulatory and neutrophil-like monocyte subsets with distinct single-cell transcriptomic signatures emerge following brain injury

Affiliations

Immunoregulatory and neutrophil-like monocyte subsets with distinct single-cell transcriptomic signatures emerge following brain injury

Erwin K Gudenschwager Basso et al. J Neuroinflammation. .

Abstract

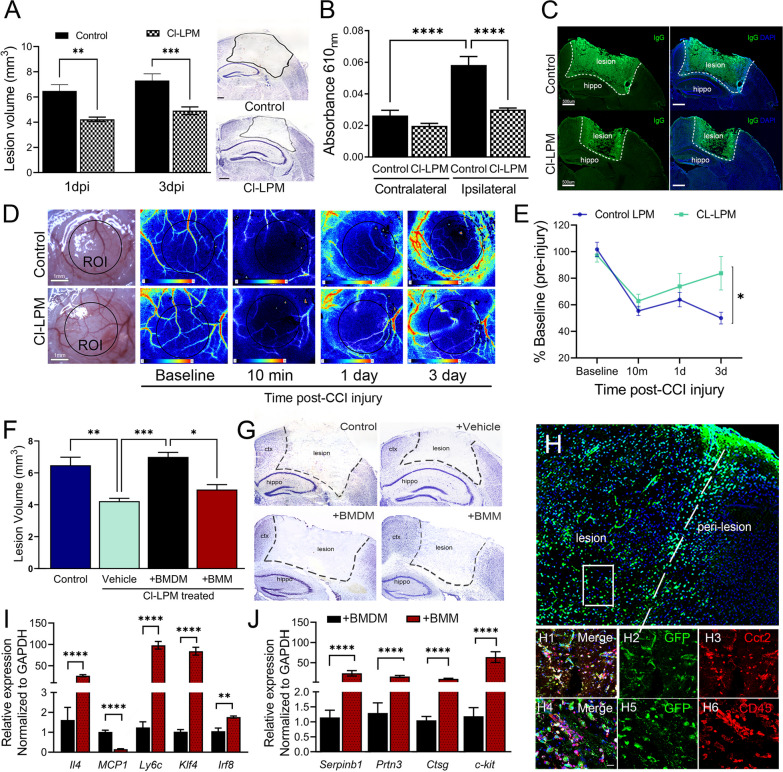
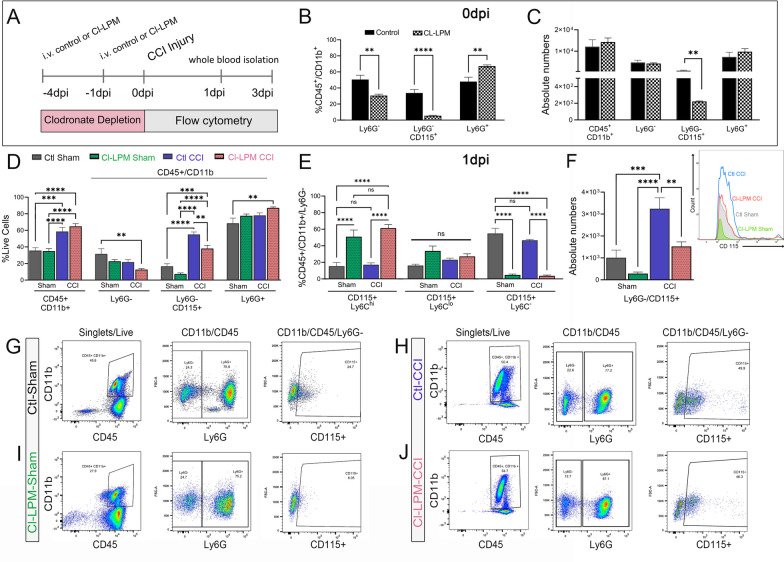
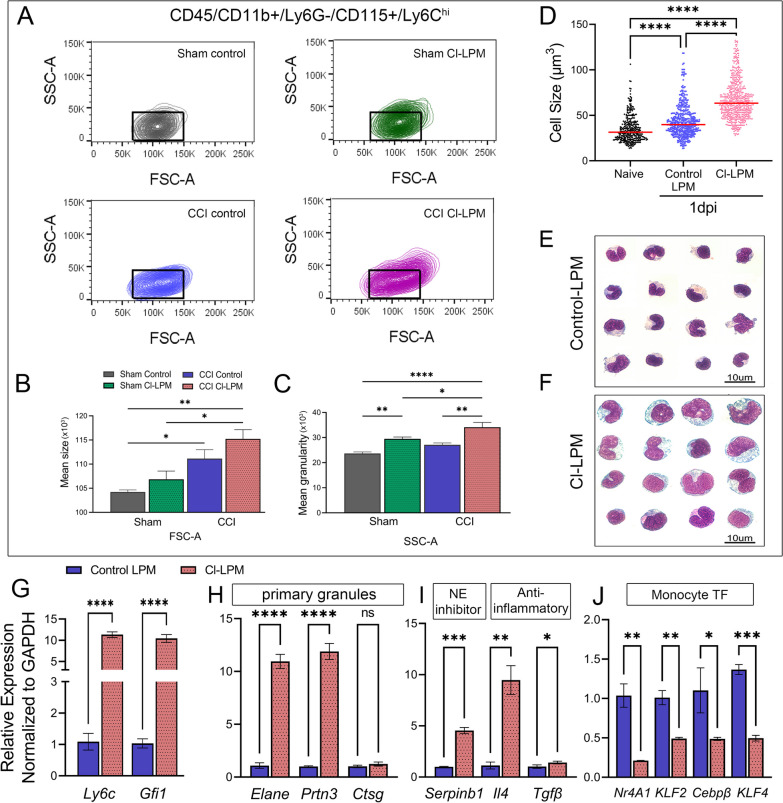
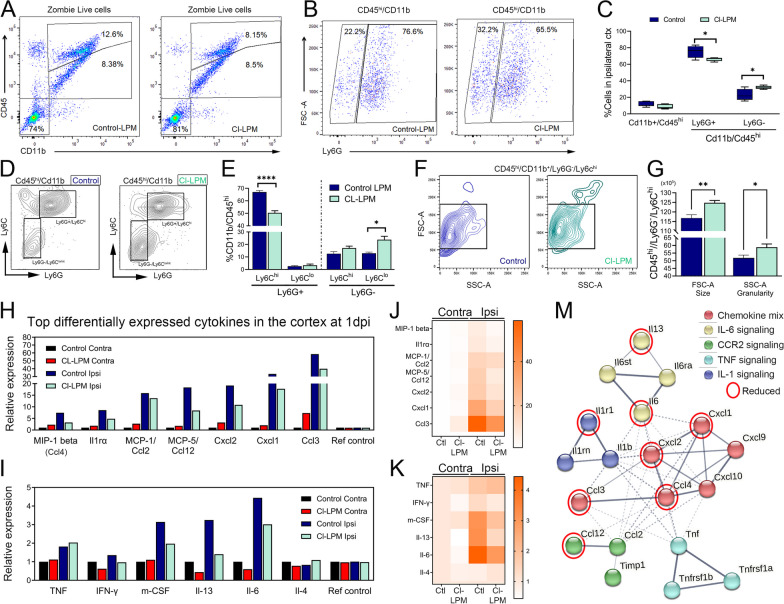
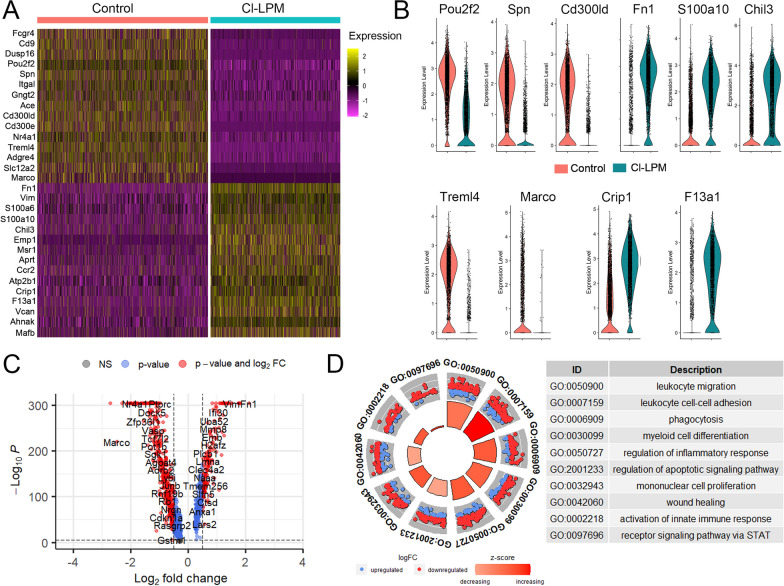
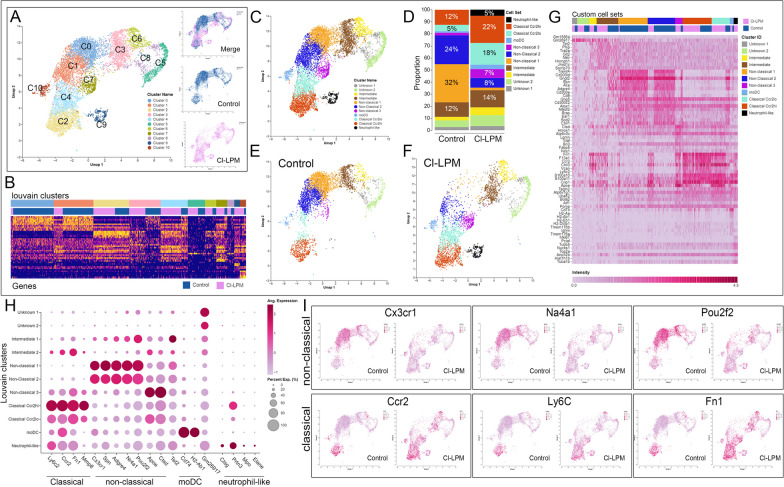
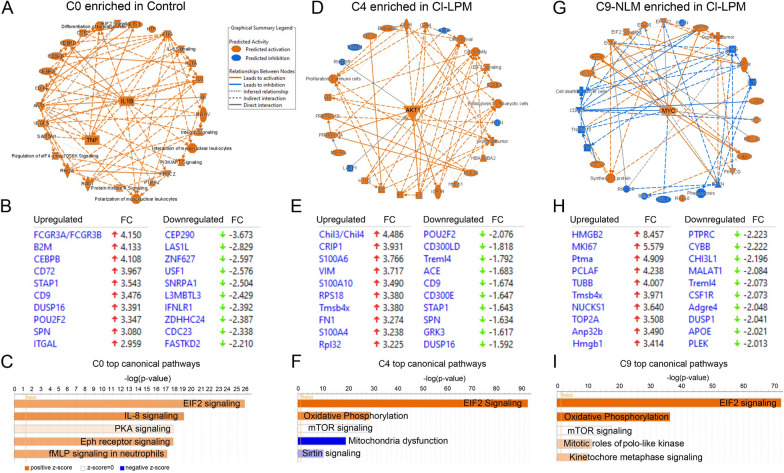
Monocytes represent key cellular elements that contribute to the neurological sequela following brain injury. The current study reveals that trauma induces the augmented release of a transcriptionally distinct CD115+/Ly6Chi monocyte population into the circulation of mice pre-exposed to clodronate depletion conditions. This phenomenon correlates with tissue protection, blood-brain barrier stability, and cerebral blood flow improvement. Uniquely, this shifted the innate immune cell profile in the cortical milieu and reduced the expression of pro-inflammatory Il6, IL1r1, MCP-1, Cxcl1, and Ccl3 cytokines. Monocytes that emerged under these conditions displayed a morphological and gene profile consistent with a subset commonly seen during emergency monopoiesis. Single-cell RNA sequencing delineated distinct clusters of monocytes and revealed a key transcriptional signature of Ly6Chi monocytes enriched for Apoe and chitinase-like protein 3 (Chil3/Ym1), commonly expressed in pro-resolving immunoregulatory monocytes, as well as granule genes Elane, Prtn3, MPO, and Ctsg unique to neutrophil-like monocytes. The predominate shift in cell clusters included subsets with low expression of transcription factors involved in monocyte conversion, Pou2f2, Na4a1, and a robust enrichment of genes in the oxidative phosphorylation pathway which favors an anti-inflammatory phenotype. Transfer of this monocyte assemblage into brain-injured recipient mice demonstrated their direct role in neuroprotection. These findings reveal a multifaceted innate immune response to brain injury and suggest targeting surrogate monocyte subsets may foster tissue protection in the brain.

Keywords: Clodronate; Innate immunity; Neuroinflammation; Traumatic brain injury.


Conflict of interest statement

The authors have declared that no conflict of interest exists. The authors declare no competing financial interests.

Figures

Fig. 1
Fig. 1
CCI-injured mice pre-treated with Cl-LPM show reduced lesion volume, maintained BBB integrity, and restored cortical blood perfusion. A Lesion volume at 1- and 3-dpi alongside representative Nissl images at 1dpi. B Evans blue absorbance (610 nm) analysis in the cortex at 1dpi. C Representative images for ipsilateral cortex of control and CL-LPM-treated mice stained with mouse anti-IgG (green) at 1dpi. D Representative gross images of baseline brain-meningeal surface after craniectomy and laser speckle contrast imaging. Scale bar = 1 mm. E Quantification of perfusion units (percent of baseline) following CCI injury. (n = 5–8 per group). *p < 0.05; **p < 0.01; ***P < 0.001; ****p < 0.0001. Two-way ANOVA with Bonferroni post hoc. Scale bar in A and C = 500 µm. F Lesion volume of control LPM or Cl-LPM treated mice, reconstituted with GFP+ BMMs or BMDMs at 1 dpi. G Representative Nissl-stained coronal sections. H Confocal image analysis showing GFP+ cells located in the damaged ipsilateral cortex, confirming co-labeling with monocyte-specific marker Ccr2 (H1H3) or CD45 (H4H6) Scale bar = 100um. I, J Relative mRNA expression in BMDMs vs. BMMs. n = 5–10 mice/group. **p < 0.01; ***p < 0.001, ****p < 0.0001. One-way ANOVA with Bonferroni post hoc (B, F); t-test (A, I, J); 2-way ANOVA repeated measures (E)
Fig. 2
Fig. 2
Monocyte population shift in blood following CCI injury and CL-LPM treatment. A Schematic representation of experimental timeline. B, C Flow cytometry analysis for the percentage (%) of CD45+/CD11b+ cell population that are Ly6G, Ly6G/CD115+, or Ly6G+ in CL-LPM or control-LPM treated naïve mice (0 dpi, B) as well as absolute numbers (C). D, E Flow cytometry analysis for the percentage (%) of myeloid population, including absolute numbers (F). GJ Flow cytometry gating strategy to select live/singlets, CD11b+/CD45+, and Ly6G/CD115+ monocytes. n = 5 per group. *p < 0.05; **p < 0.01; ***p < 0.001; ****p < 0.00001. Student’s t-test (B, C); one-way ANOVA with Bonferroni post hoc (DF)
Fig. 3
Fig. 3
Distinctive morphology and gene expression signature in circulating CD115 + /Ly6Chi monocytes of sham and CCI-injured mice pre-treated with control or Cl-LPM at 1dpi. A Representative contour plots of side (SSC-A) and forward (FSC-A) scattering of Ly6Chi monocytes from sham and CCI-injured mice pre-treated with control or CL-LPM at 1 dpi. B The mean size (FSC-A) of Ly6Chi monocytes is significantly increased in Cl-LPM or control LPM- treated CCI-injured mice compared to control sham cells. C The mean granularity (SSC-A) of Ly6Chi monocytes is significantly increased in Cl-LPM-treated CCI-injured mice compared to other groups. D Cell size of whole blood monocytes from Cl-LPM treated mice at 1 dpi. E, F Representative images of differential quick cytology. GJ Relative mRNA expression Ly6c and neutrophil-like gene Gfi1 (G), primary granules (H), anti-inflammatory (I), and monocytes TF (J) in circulating CL-LPM monocytes relative to control injured mice at 1 dpi. n = 5/group, *p < 0.05; **p < 0.01; ****p < 0.0001. One-way ANOVA with Bonferroni post hoc (BD); t-test (GJ)
Fig. 4
Fig. 4
Phenotypic shift of infiltrating immune cells and reduced inflammatory cytokines in the cortex of Cl-LPM injured mice. A, B Flow cytometry gating for CD45hi/CD11b + cells and CD54lo/CD11b + microglia (A) followed by Ly6G+ selection of neutrophils and Ly6G myeloid (B). C Percentage of CD11b+/CD45hi infiltrating immune cells, CD11b+/CD45hi/Ly6G+ neutrophils, and CD11b+/CD45hi/Ly6G-myeloid/macrophages in the ipsilateral cortex of Cl-LPM or control CCI-injured mice at 1 dpi. D Representative gating of Ly6C and Ly6G expressing cells from CD11b+/CD45hi infiltrating immune cells in the damaged cortex. E The percentage of CD11b+/CD45hi/Ly6G+ and CD11b+/CD45hi/Ly6G cells co-labeled as Ly6Chi or Ly6Clo expression. F Representative FSC-A/SSC-A gating to evaluate size and granularity of Ly6Chi cells in the injured cortex. G Quantification for the size and granularity of CD11b + /CD45hi/Ly6G-/Ly6C.hi cell in the injured cortex at 1 dpi. H–K Cytokine Array protein quantification showing the top differentially expressed cytokines in the ipsilateral cortex at 1 dpi. M String analysis of the top differentially expressed cytokines. n = 5/group, *p < 0.05; **p < 0.01; ****p < 0.0001. t-test (C, E, G)
Fig. 5
Fig. 5
Single-cell RNA sequencing analysis shows distinctive transcriptomics of blood monocytes treated with Cl-LPM compared to control at 1 dpi. ScRNAseq was performed on monocytes isolated from blood of mice pre-treated with Cl-LPM or Control-LPM at 1 dpi. A Heatmap plotting of the top 15 up and down differentially expressed genes from CL-LPM compared to control-LPM pre-treated mice. B Violin plots of selected genes differentially expressed in CL-LPM monocytes vs control-LPM. C Enhanced volcano plot of DGEs. D GO plot shows top 10 relevant GO pathways related to all significant up and down regulated genes in CL-LPM relative to control monocytes
Fig. 6
Fig. 6
scRNAseq analysis displays altered monocyte clustering for blood monocytes isolated from Cl-LPM and control mice at 1 dpi. A Monocytes from control and Cl-LPM treated mice are clustered based on RNA gene expression in a Uniform Manifold Approximation and Projection (UMAP) plot. B Heatmap distinguishing each of the 11 clusters between samples. C UMAP following custom cell annotation and the percentage of cell types in each sample (D). E, F UMAP of control and Cl-LPM, respectively. G Heatmaps of top 10 up DEG’s DGE (Y axis) per cluster (X axis) for control and Cl-LPM samples showing distinctive gene expression profiles. H Dot plot of top genes expressed by annotated cell types. I Feature maps highlighting spatial expression across clusters of Cx3cr1, Na4a1, Pou2f2, Ccr2, Ly6c, Fn1 in control and Cl-LPM cells
Fig. 7
Fig. 7
Top DGEs and Gene Ontology using scRNAseq cluster analysis of control and Cl-LPM monocytes. A Heatmap of top 10 genes in each annotated cell cluster in control monocytes. B Cell trajectory analysis using pseudotime shows a hub in Cluster (C) 0. C Volcano plot of DGEs in C0, non-classical. D GO analysis shows migration, cell–cell adhesion, actin assembly, regulation of inflammatory response and TNF production as top biological processes in C0. E Top 5 UP and down regulated genes in C0 that show inverse expression compared to C4. F Heatmap of top 10 genes in each annotated cell cluster in Cl-LPM monocytes. G Cell trajectory analysis using pseudotime. H Volcano plot of DGEs in C0, non-classical. I GO analysis shows oxidative phosphorylation, aerobic respiration, etc., as top biological processes in C0. J Top 5 UP and down regulated genes in C0. K Analysis of top DGE in neutrophil-like monocytes, C9. L GO analysis for C0. MO Transfer of peripheral-derived monocytes (PDMs) by i.v. injection immediately following CCI injury. P, Q Gross images of injured brain at 1dpi shows tissue protection in mice receiving Cl-LPM PDMs (R). n = 5–8 *p < 0.05; one-way ANOVA, Bonferroni post hoc. Scale = 500 um in M–O and 0.5 cm in P and Q
Fig. 8
Fig. 8
IPA analysis of C0, C4 and C9. A, D, G Graphical summary of top signaling predicted to be activated (orange) or inhibited (blue). B, E, H Top analysis ready molecules. C, F, I Horizontal bar of top canonical pathways identified for each monocyte cluster base don −log(p-value). Orange = predicted to be activated; blue = predicted to be inhibited

Similar articles

Cited by

References

    1. Simon DW, et al. The far-reaching scope of neuroinflammation after traumatic brain injury. Nat Rev Neurol. 2017;13(3):171–191. doi: 10.1038/nrneurol.2017.13. - DOI - PMC - PubMed
    1. Hsieh CL, et al. Traumatic brain injury induces macrophage subsets in the brain. Eur J Immunol. 2013;43(8):2010–2022. doi: 10.1002/eji.201243084. - DOI - PMC - PubMed
    1. Makinde HM, et al. Nonclassical monocytes mediate secondary injury, neurocognitive outcome, and neutrophil infiltration after traumatic brain injury. J Immunol. 2017;199(10):3583–3591. doi: 10.4049/jimmunol.1700896. - DOI - PMC - PubMed
    1. Yamasaki R, et al. Differential roles of microglia and monocytes in the inflamed central nervous system. J Exp Med. 2014;211(8):1533–1549. doi: 10.1084/jem.20132477. - DOI - PMC - PubMed
    1. Gyoneva S, Ransohoff RM. Inflammatory reaction after traumatic brain injury: therapeutic potential of targeting cell–cell communication by chemokines. Trends Pharmacol Sci. 2015;36(7):471–480. doi: 10.1016/j.tips.2015.04.003. - DOI - PMC - PubMed