

Completing the picture of field-grown cereal crops: a new method for detailed leaf surface models in wheat
- PMID: 38310295
- PMCID: PMC10837940
- DOI: 10.1186/s13007-023-01130-x
Completing the picture of field-grown cereal crops: a new method for detailed leaf surface models in wheat
Abstract
Background: The leaf angle distribution (LAD) is an important structural parameter of agricultural crops that influences light interception, radiation fluxes and consequently plant performance. Therefore, LAD and its parametrized form, the Beta distribution, is used in many photosynthesis models. However, in field cultivations, these parameters are difficult to assess and cereal crops in particular pose challenges since their leaves are thin, flexible, and often bent and twisted around their own axis. To our knowledge, there is only a very limited set of methods currently available to calculate LADs of field-grown cereal crops that explicitly takes these special morphological properties into account.
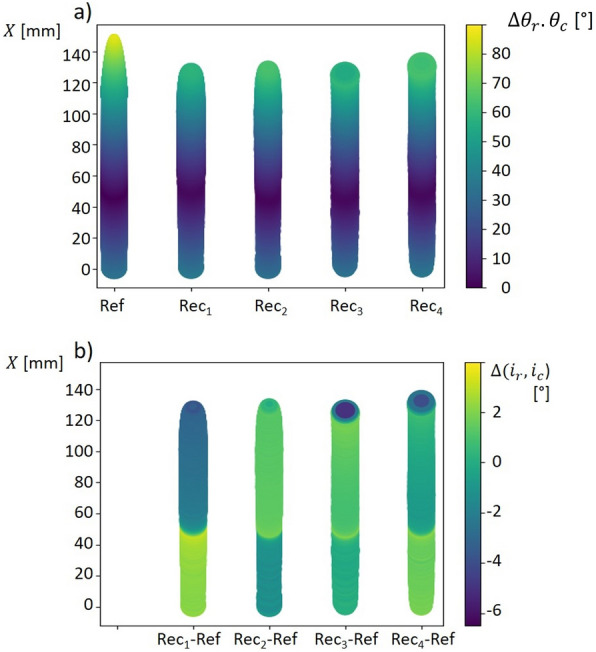
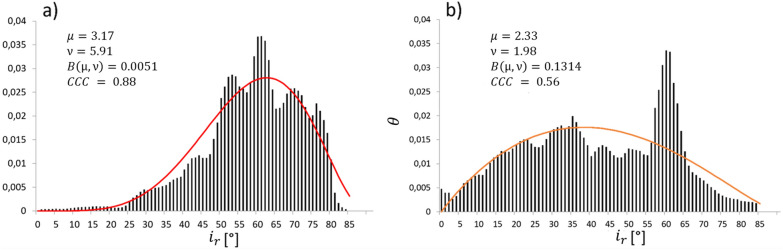
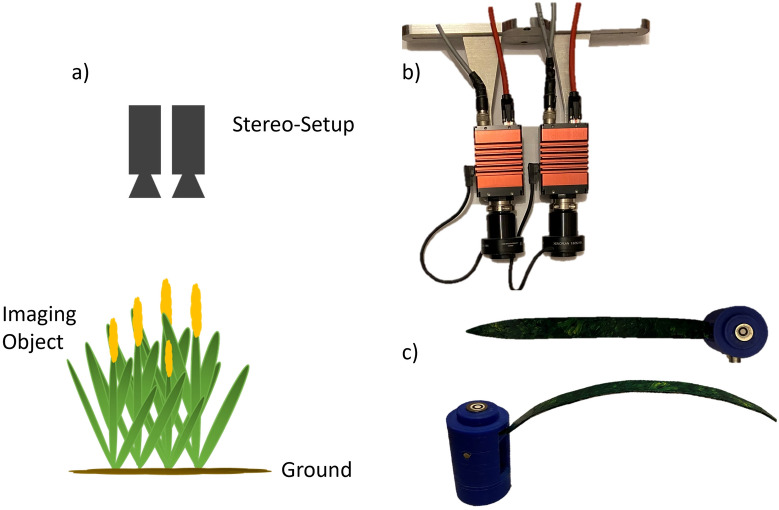
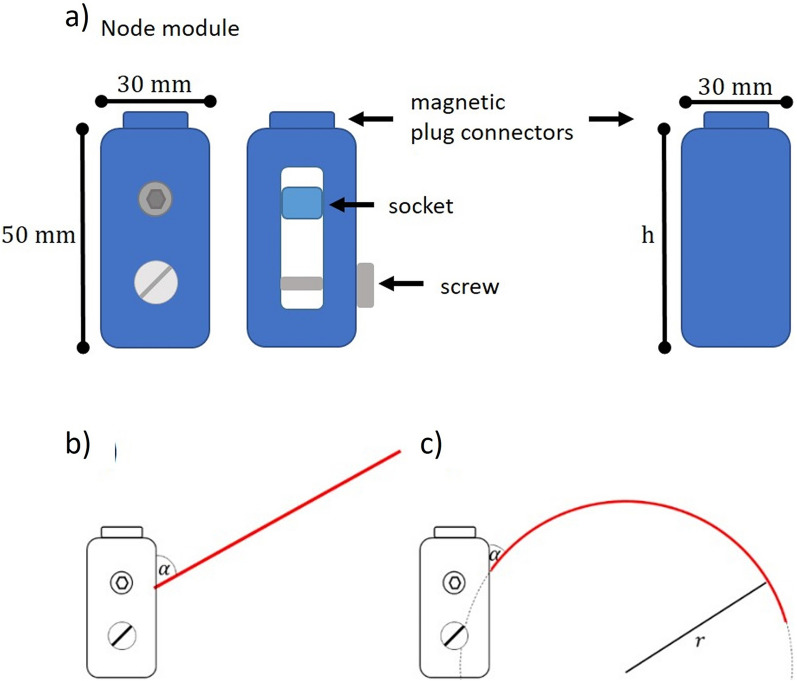
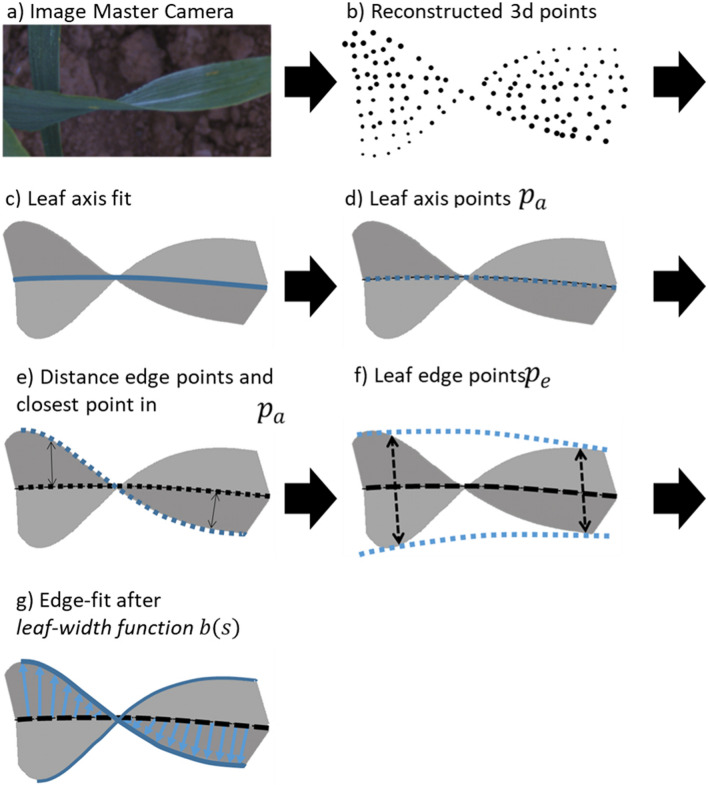
Results: In this study, a new processing pipeline is introduced that allows for the generation of realistic leaf surface models and the analysis of LADs of field-grown cereal crops from 3D point clouds. The data acquisition is based on a convenient stereo imaging setup. The approach was validated with different artificial targets and results on the accuracy of the 3D reconstruction, leaf surface modeling and calculated LAD are given. The mean error of the 3D reconstruction was below 1 mm for an inclination angle range between 0° and 75° and the leaf surface could be quantified with an average accuracy of 90%. The concordance correlation coefficient (CCC) of 99.6% (p-value = [Formula: see text]) indicated a high correlation between the reconstructed inclination angle and the identity line. The LADs for bent leaves were reconstructed with a mean error of 0.21° and a standard deviation of 1.55°. As an additional parameter, the insertion angle was reconstructed for the artificial leaf model with an average error < 5°. Finally, the method was tested with images of field-grown cereal crops and Beta functions were approximated from the calculated LADs. The mean CCC between reconstructed LAD and calculated Beta function was 0.66. According to Cohen, this indicates a high correlation.
Conclusion: This study shows that our image processing pipeline can reconstruct the complex leaf shape of cereal crops from stereo images. The high accuracy of the approach was demonstrated with several validation experiments including artificial leaf targets. The derived leaf models were used to calculate LADs for artificial leaves and naturally grown cereal crops. This helps to better understand the influence of the canopy structure on light absorption and plant performance and allows for a more precise parametrization of photosynthesis models via the derived Beta distributions.
Keywords: 3D plant reconstruction; Beta distribution; Cereal crops; Leaf angle; Leaf angle distribution; Plant phenotyping; Stereo imaging; Structural leaf model.
© 2024. The Author(s).
Conflict of interest statement
The authors declare that they have no competing interests.
Figures


Similar articles
-
Estimating canopy leaf angle from leaf to ecosystem scale: a novel deep learning approach using unmanned aerial vehicle imagery.New Phytol. 2025 Jul;247(1):408-425. doi: 10.1111/nph.70197. Epub 2025 May 10. New Phytol. 2025. PMID: 40346911
-
Image-based dynamic quantification and high-accuracy 3D evaluation of canopy structure of plant populations.Ann Bot. 2018 Apr 18;121(5):1079-1088. doi: 10.1093/aob/mcy016. Ann Bot. 2018. PMID: 29509841 Free PMC article.
-
Quantification of light interception within image-based 3-D reconstruction of sole and intercropped canopies over the entire growth season.Ann Bot. 2020 Sep 14;126(4):701-712. doi: 10.1093/aob/mcaa046. Ann Bot. 2020. PMID: 32179920 Free PMC article.
-
Differential manipulation of leaf angle throughout the canopy: current status and prospects.J Exp Bot. 2017 Dec 16;68(21-22):5699-5717. doi: 10.1093/jxb/erx378. J Exp Bot. 2017. PMID: 29126242 Review.
-
Leaf angle: a target of genetic improvement in cereal crops tailored for high-density planting.Plant Biotechnol J. 2022 Mar;20(3):426-436. doi: 10.1111/pbi.13780. Epub 2022 Feb 15. Plant Biotechnol J. 2022. PMID: 35075761 Free PMC article. Review.
References
-
- Leihner DE, Ortiz F. G: Improvement of durum wheat-plant type, yield potential, and adaptation. Euphytica. 1978;27:785–799. doi: 10.1007/BF00023715. - DOI
-
- Sassenrathcole G. Dependence of canopy light distribution on leaf and canopy structure for two cotton (Gossypium) species. Agric For Meteorol. 1995;77:55–72. doi: 10.1016/0168-1923(95)02238-S. - DOI
-
- Lambers H, Chapin FS, Pons TL. Plant physiological ecology: field methods and instrumentation. Dordrecht: Springer, Netherlands; 1989.
-
- Zou X, Mõttus M, Tammeorg P, Torres CL, Takala T, Pisek J, Mäkelä P, Stoddard FL, Pellikka P. Photographic measurement of leaf angles in field crops. Agric For Meteorol. 2014;184:137–146. doi: 10.1016/j.agrformet.2013.09.010. - DOI
LinkOut - more resources
Full Text Sources
Research Materials
