. 2024 Apr 3;32(4):1125-1143.
doi: 10.1016/j.ymthe.2024.01.036. Epub 2024 Feb 3.

DLK1/DIO3 locus upregulation by a β-catenin-dependent enhancer drives cell proliferation and liver tumorigenesis

Affiliations

DLK1/DIO3 locus upregulation by a β-catenin-dependent enhancer drives cell proliferation and liver tumorigenesis

Julie Sanceau et al. Mol Ther. .

Abstract

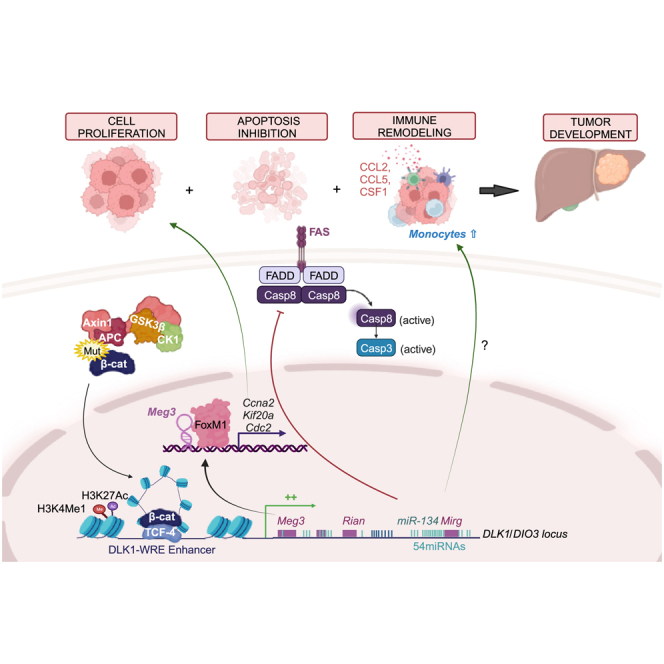
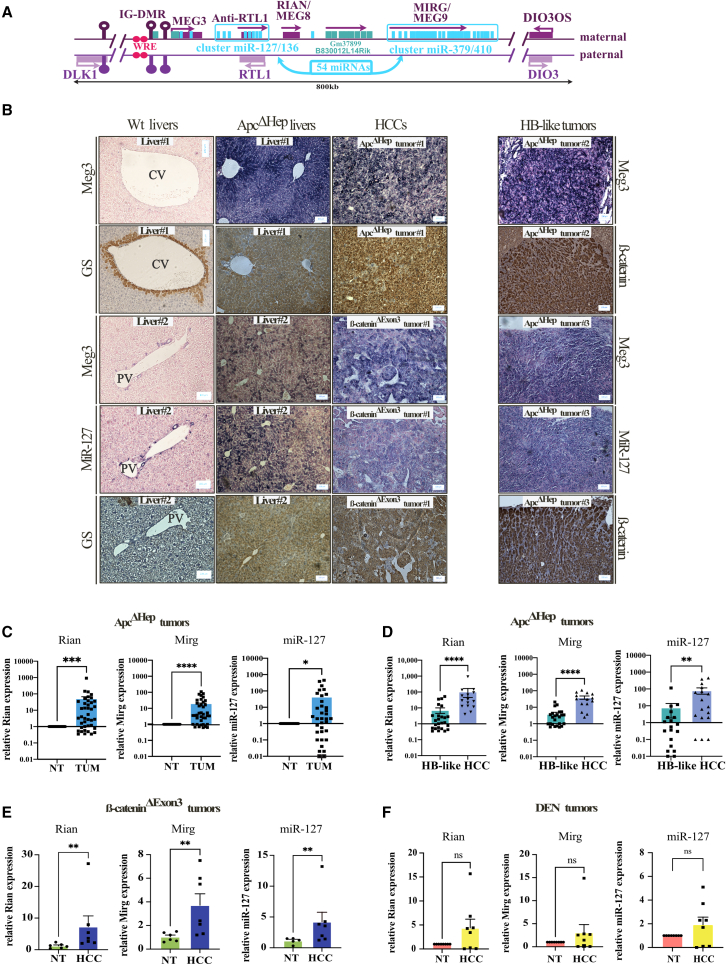
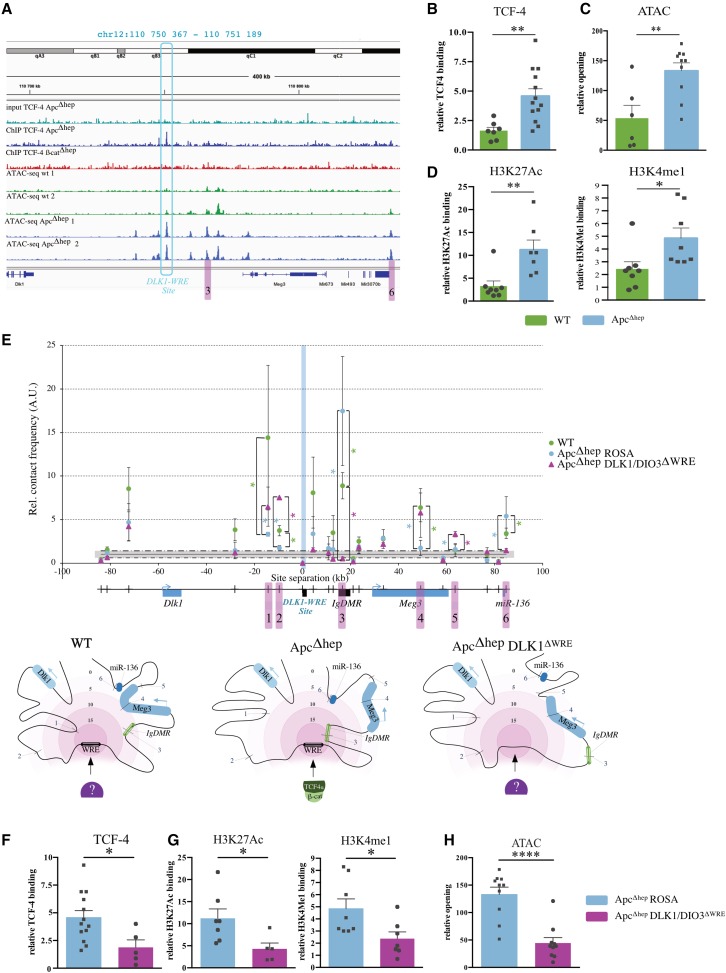
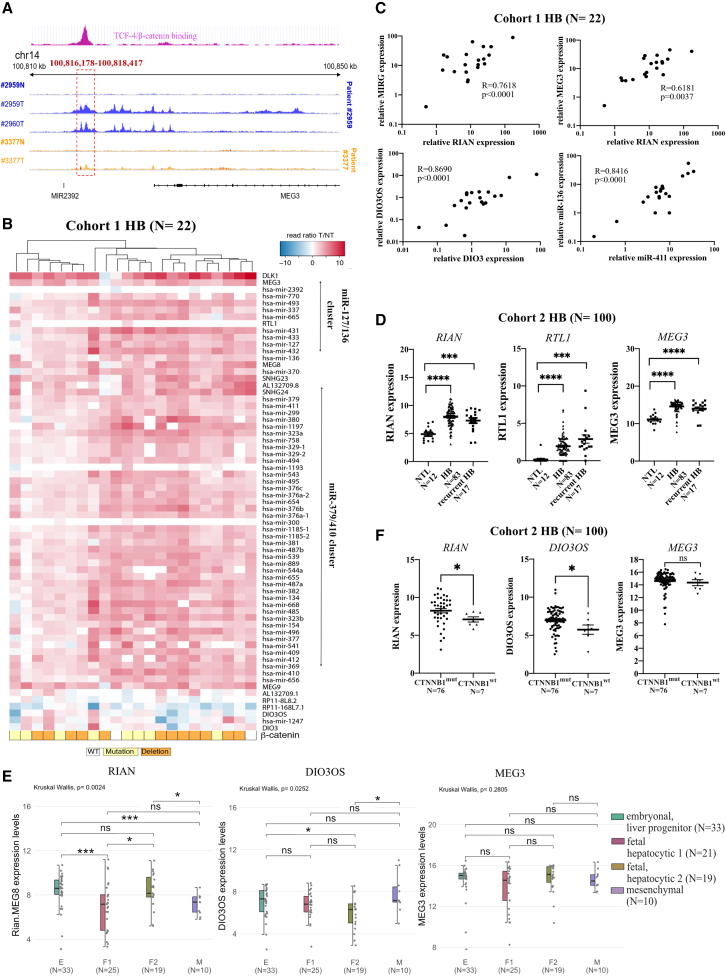
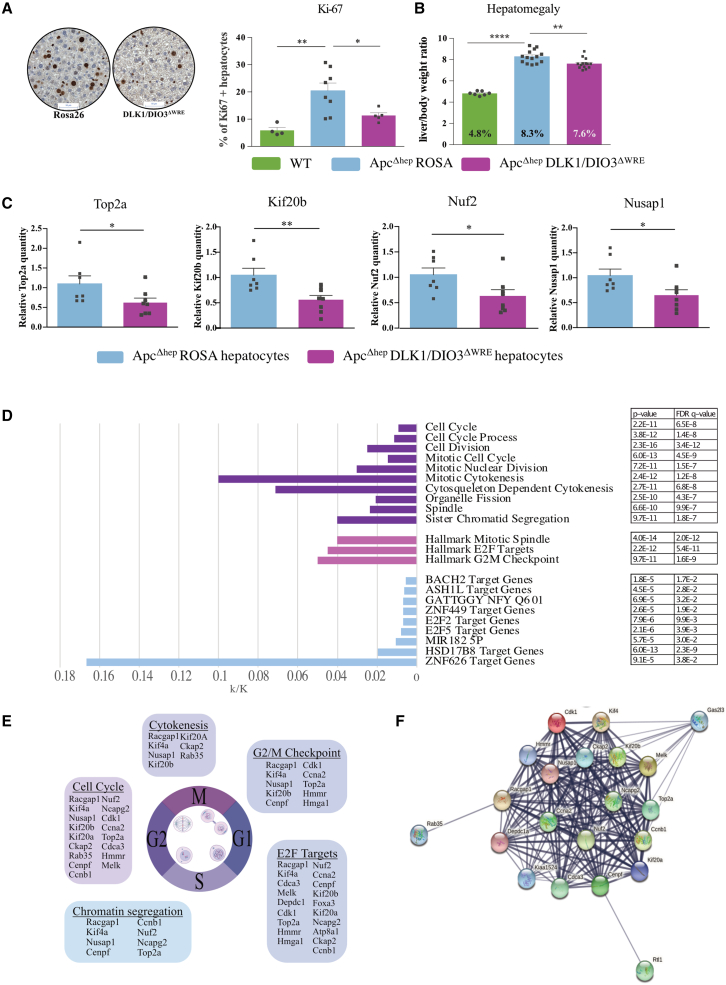
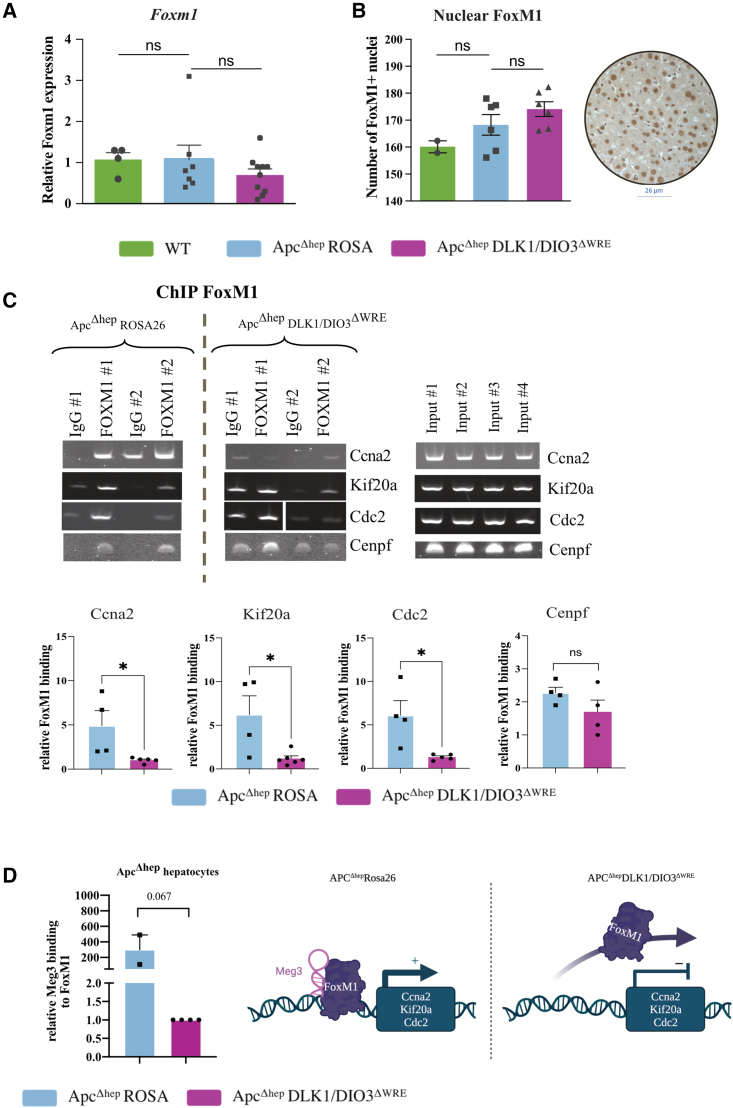
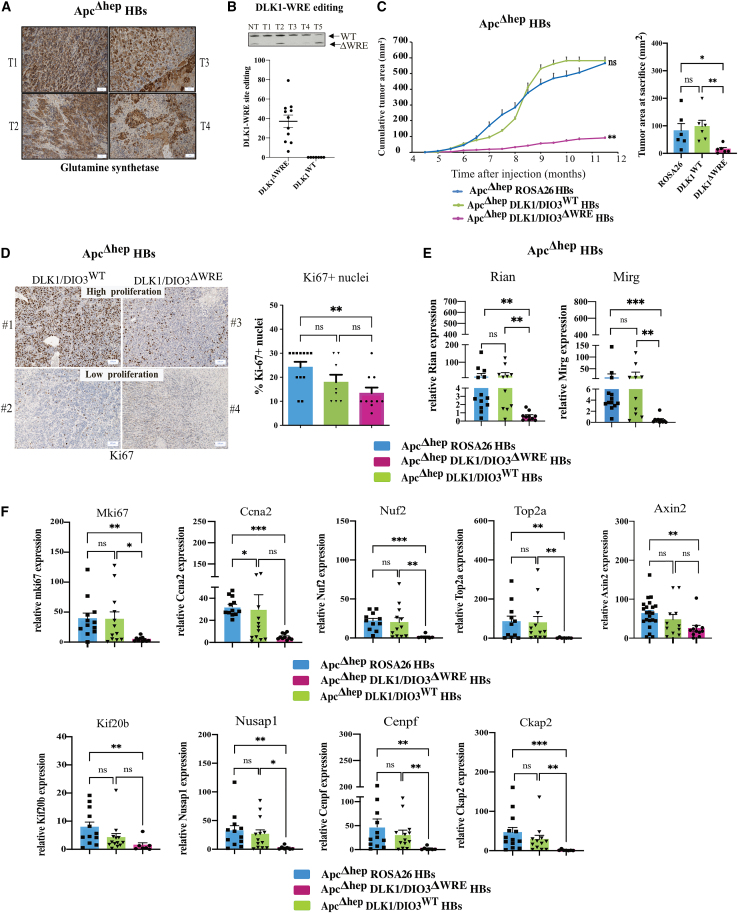
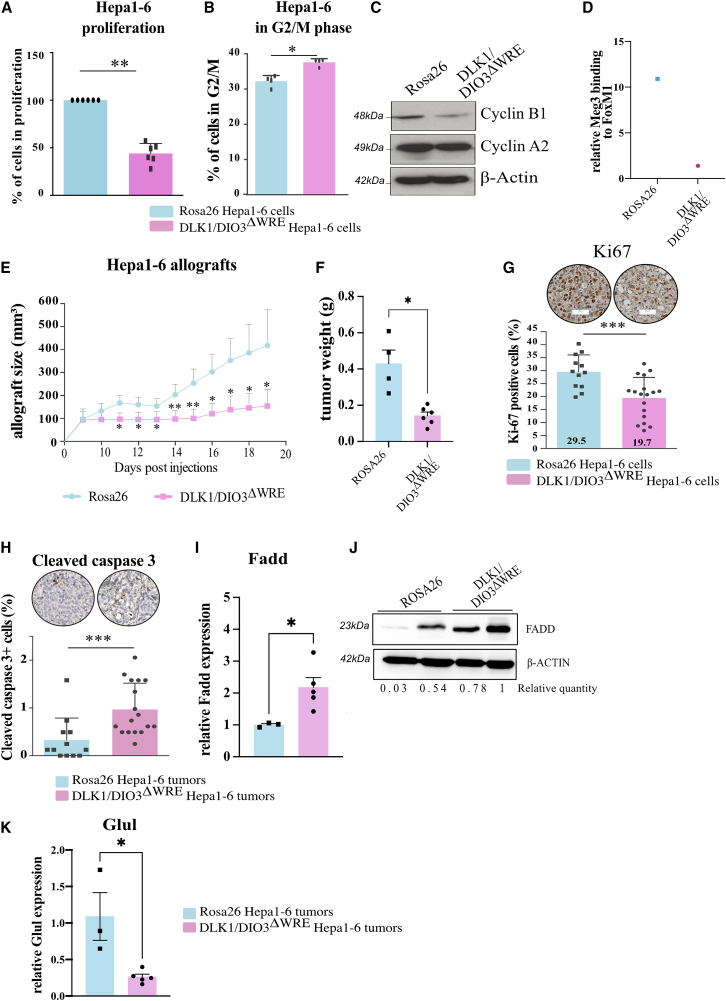
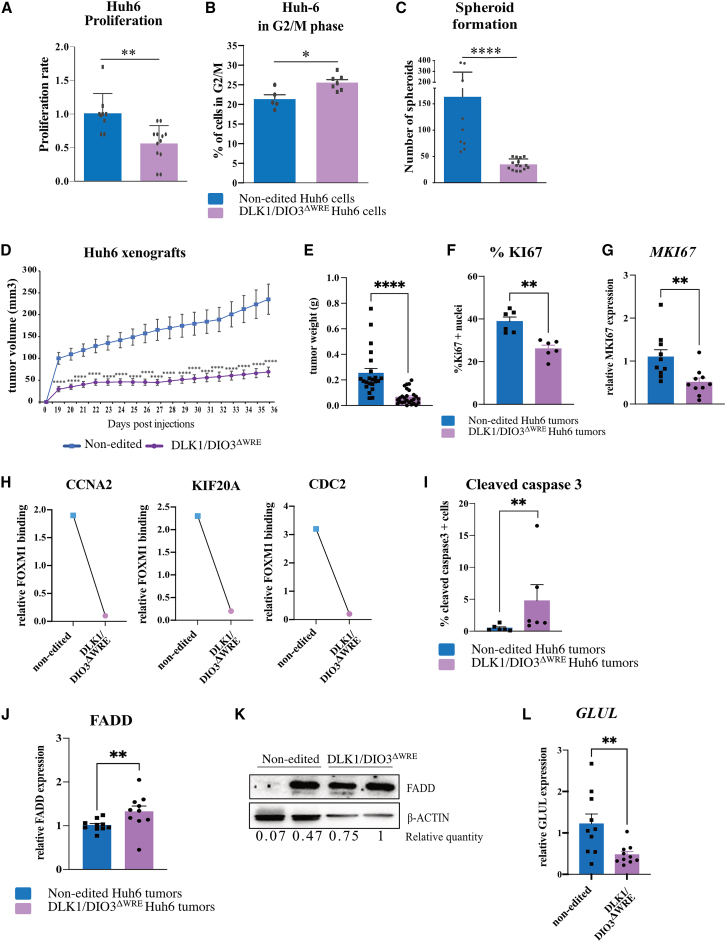
The CTNNB1 gene, encoding β-catenin, is frequently mutated in hepatocellular carcinoma (HCC, ∼30%) and in hepatoblastoma (HB, >80%), in which DLK1/DIO3 locus induction is correlated with CTNNB1 mutations. Here, we aim to decipher how sustained β-catenin activation regulates DLK1/DIO3 locus expression and the role this locus plays in HB and HCC development in mouse models deleted for Apc (ApcΔhep) or Ctnnb1-exon 3 (β-cateninΔExon3) and in human CTNNB1-mutated hepatic cancer cells. We identified an enhancer site bound by TCF-4/β-catenin complexes in an open conformation upon sustained β-catenin activation (DLK1-Wnt responsive element [WRE]) and increasing DLK1/DIO3 locus transcription in β-catenin-mutated human HB and mouse models. DLK1-WRE editing by CRISPR-Cas9 approach impaired DLK1/DIO3 locus expression and slowed tumor growth in subcutaneous CTNNB1-mutated tumor cell grafts, ApcΔhep HB and β-cateninΔExon3 HCC. Tumor growth inhibition resulted either from increased FADD expression and subsequent caspase-3 cleavage in the first case or from decreased expression of cell cycle actors regulated by FoxM1 in the others. Therefore, the DLK1/DIO3 locus is an essential determinant of FoxM1-dependent cell proliferation during β-catenin-driven liver tumorigenesis. Targeting the DLK1-WRE enhancer to silence the DLK1/DIO3 locus might thus represent an interesting therapeutic strategy to restrict tumor growth in primary liver cancers with CTNNB1 mutations.

Keywords: enhancer site; in vivo CRISPR-Cas9; non-coding RNAs; primary liver cancers; targeted therapies; transgenic mice; β-catenin.


Conflict of interest statement

Declaration of interests Two patents, PCT/EP2023/053419 and EP22305162.4, have been deposited by J.S., L.P., S.C., and A.G.

Figures

None
Graphical abstract
Figure 1
Figure 1
The Dlk1/Dio3 locus is induced in mouse HCC- and HB-like tumors driven by β-catenin (A) Schematic representation of the DLK1/DIO3 locus. (B) In situ hybridization of Meg3 and miR-127 with staining of glutamine synthetase (GS) or active β-catenin in WT and ApcΔhep livers and in ApcΔhep and β-cateninΔExon3 HCC- or HB-like tumors. CV, central vein; PV, portal vein. (C–F) Expression of Rian, Mirg, and miR-127 with error bars representing SEM by RT-qPCR in ApcΔhep tumors (TUM) compared to adjacent non-tumor (NT) tissue (C); in ApcΔhep HCC and HB-like tumors (D); in β-cateninΔExon3 tumors (E); and in DEN tumors without β-catenin activation (F). ∗p < 0.05, ∗∗p < 0.01, ∗∗∗p < 0.005, ∗∗∗∗p < 0.0001; ns, non-significant (Mann-Whitney).
Figure 2
Figure 2
β-Catenin binding at the DLK1-WRE site opens chromatin and exerts enhancer activity in ApcΔhep hepatocytes (A) ChIP-seq targeting TCF-4 in WT, ApcΔhep, and β-catΔhep hepatocytes and ATAC-seq data in WT and ApcΔhep hepatocytes. TCF-4 binding site is framed in the blue box (DLK1-WRE) and sites common with 3C in pink. (B, D, F, and G) ChIP-qPCR analysis at the DLK1-WRE site for TCF-4, H3K4me1, and H3K27ac relative to isotype control in ApcΔhep hepatocytes with error bars representing SEM compared to WT (B and D) and compared to ApcΔhep-DLK1/DIO3ΔWRE hepatocytes (F and G). (C and H) ATAC-qPCR analysis at the DLK1-WRE site compared to WT (C) and to ApcΔhep-DLK1/DIO3ΔWRE hepatocytes (H). (E) Relative contact frequencies in arbitrary units (a.u.) between the DLK1-WRE site (blue vertical bar) and 19 genomic sites (small vertical black bars on the map below) measured in 3C experiments performed on WT, ApcΔhep-Rosa26, and ApcΔhep-DLK1/DIO3ΔWRE liver nuclei with error bars representing SEM of six, five, and three biological replicates, respectively. Regions of interest (highlighted in pink) are numbered from 1 to 6. The lower panel illustrates the different chromatin loops distributed into six interaction zones: the darker the pink, the stronger the interaction. Figure made with BioRender. ∗p < 0.05, ∗∗p < 0.01, ∗∗∗p < 0.005, ∗∗∗∗p < 0.0001; ns, non-significant (Mann-Whitney).
Figure 3
Figure 3
The DLK1/DIO3 locus is induced in human HB in correlation with CTNNB1 mutations and DLK1-WRE opening (A) Pseudo bulk snATAC-seq aggregated with Cellranger-atac of three human HBs (T) and their adjacent NT tissue (N) at the DLK1-WRE site; the pink panel represents ChIP-seq data targeting TCF-4 in the human HB HepG2 cell line (Gsm782122). (B) RNA-seq expression data for the entire DLK1/DIO3 locus in HB normalized to their adjacent NT tissue (N = 22, cohort 1). A white square in the β-catenin lane indicates HB with intact CTNNB1, a yellow square HB with point mutation in CTNNB1, an orange square HB with CTNNB1 exon 3 deletion. (C) Correlation between RIAN, MIRG, DIO3OS, DIO3, MEG3, miR-411, and miR-136 expressions in cohort 1. (D) RIAN, RTL-1, and MEG3 expression determined by RT-qPCR in primary (N = 83) and recurrent HB (N = 17) versus non-tumor liver (NTL) (N = 100, cohort 2). (E) Expression of DIO3OS, MEG3, and RIAN determined by RT-qPCR in the different subgroups of HB: embryonal (green), fetal hepatocytic 1 (pink), fetal hepatocytic 2 (yellow), and mesenchymal (purple). (F) Expression of RIAN, DIO3OS, and MEG3 determined by RT-qPCR in primary HB with CTNNB1 mutations (CTNNB1mut, N = 76) or with intact CTNNB1 (CTNNB1WT, N = 7). ∗p < 0.05, ∗∗∗p < 0.005, ∗∗∗∗p < 0.001; ns, non-significant (Kruskal-Wallis),with error bars representing SEM.
Figure 4
Figure 4
DLK1-WRE editing affects ApcΔhep hepatocyte proliferation through inhibition of mitosis and cytokinesis regulators (A) Percentage of Ki-67+ hepatocytes in WT, ApcΔhep-Rosa26, and ApcΔhep-DLK1/DIO3ΔWRE livers. (B) Percentage of liver to body weight ratio in WT, ApcΔhep-Rosa26, and ApcΔhep-DLK1/DIO3ΔWRE livers. (C) Expression of Top2a, Kif20b, Nuf2, and Nusap1 in ApcΔhep-DLK1/DIO3ΔWRE hepatocytes relative to ApcΔhep-Rosa26 hepatocytes. (D–F) RNA-seq analysis on ApcΔhep−DLK1/DIO3ΔWRE and ApcΔhep-Rosa26 hepatocytes. (D) The histograms summarize ratio obtained with gene set enrichment analysis (GSEA) between the number of genes in the intersection of the query set with a set from MSigDB (k/K), with p value and FDR q-values for each item. (E) Schematic representation of the most significantly deregulated RNAs. (F) Main hub obtained by STRING analysis. ∗p < 0.05, ∗∗p < 0.01, ∗∗∗∗p < 0.001; ns, non-significant (Mann-Whitney), with error bars representing SEM.
Figure 5
Figure 5
DLK1-WRE editing impairs FoxM1 binding at Ccna2, Kif20a, and Cdc2 promoters (A) RT-qPCR analysis of Foxm1 expression in ApcΔhep-Rosa26 and ApcΔhep-DLK1/DIO3ΔWRE hepatocytes compared to WT hepatocytes. (B) Number of Foxm1+ nuclei in IHC. (C) Representative images of ChIP-PCR targeting FoxM1 at Ccna2, Kif20a, Cdc2, and Cenpf promoters compared to isotype control in ApcΔhep-Rosa26 and ApcΔhep-DLK1/DIO3ΔWRE hepatocytes and inputs (#1 and 2 for ApcΔhep-Rosa26 hepatocytes, #3 and 4 for ApcΔhep-DLK1/DIO3ΔWREhepatocytes); the lower panel represents the PCR band quantification with ImageJ of all ChIP experiments against FoxM1 relative to isotype control. For the cdc2 promoter in ApcΔhep-DLK1/DIO3ΔWRE hepatocytes, the cropped images are for two different mice analyzed on two gels with the same conditions of exposure. (D) Quantification of Meg3 RNA co-immunoprecipitated with FoxM1 in RIP-qPCR in ApcΔhep-DLK1/DIO3ΔWRE (n = 4) compared to ApcΔhep-Rosa26 hepatocytes (n = 2); data are represented as the relative binding compared to 18S. Figure made with BioRender. ∗p < 0.05, ∗∗p < 0.01; ns, non-significant (Kruskal-Wallis or Mann-Whitney), with error bars representing SEM.
Figure 6
Figure 6
DLK1-WRE site editing slows tumor growth of ApcΔhep HB through decreased expression of mitotic entry regulators (A) Examples of GS staining of ApcΔhep HB showing a heterogeneous staining with many stromal cells; HB cells losing several metabolic features of mature hepatocytes express low level of GS compared to ApcΔhep HCC cells. (B) Analysis of tumor editing by PCR band quantification with ImageJ in ApcΔhep HB. The upper panel is a representative image obtained from NT tissue and tumors (T). (C) Progression of cumulative tumor areas in ApcΔhep-DLK1/DIO3ΔWRE HB and ApcΔhep-DLK1/DIO3WT HB compared to ApcΔhep-Rosa26 HB with cumulative area at sacrifice indicated in the right panel. (D) Representative images of Ki-67 staining on ApcΔhep HB with high or low proliferation rate (left panel) and quantification of Ki-67+ hepatocytes in percentage for all tumors (right panel). (E) RT-qPCR analysis of Rian and Mirg in ApcΔhep HB compared to their NT tissues. (F) RT-qPCR analysis of Mki67, Ccna2, Nuf2, Top2a, Axin2, Kif20b, Nusap1, Cenpf, and Ckap2 relative to their NT tissues. ∗p < 0.05, ∗∗p < 0.01, ∗∗∗p < 0.005, ∗∗∗∗p < 0.001; ns, non-significant (Kruskal-Wallis), with error bars representing SEM.
Figure 7
Figure 7
DLK1-WRE site editing impairs the pro-tumorigenic capacities of murine hepatoma Hepa1-6 cells mutated for Ctnnb1 (A–D) Analysis of DLK1/DIO3ΔWRE Hepa1-6 clones versus Rosa26 control clones. Proliferation rate at 48 h (A); percentage of cells in G2/M phase determined by flow cytometry (B); cyclin B1 and A2 protein level determined by western blot (C); representative quantification of Meg3 RNA co-immunoprecipitated with FoxM1 in RIP-qPCR (n = 2) with data represented as the relative binding compared to 18S (D). (E–K) Analysis of DLK1/DIO3ΔWRE Hepa1-6 tumors versus Rosa26 tumors. Tumor volumes measured every 2 days (E) and tumor weights at sacrifice (F); percentage of Ki67+ tumor cells (G); percentage of tumor cells with cleaved caspase-3 (H); Fadd level determined by RT-qPCR (I); FADD protein level determined by western blot (J); Glul expression determined by RT-qPCR (K). ∗p < 0.05, ∗∗p < 0.01, ∗∗∗p < 0.005, ∗∗∗∗p < 0.0001 (Mann-Whitney),with error bars representing SEM.
Figure 8
Figure 8
DLK1-WRE site editing impairs the pro-tumorigenic capacities of human Huh6 HB cells mutated for CTNNB1 (A–C) Analysis of DLK1/DIO3ΔWRE Huh6 clones versus non-edited clones. Proliferation rate at 48 h (A); percentage of cells in G2/M phase determined by flow cytometry (B); number of spheroids (C). (D–L) Analysis of DLK1/DIO3ΔWRE Huh6 tumors versus non-edited tumors. Tumor volumes measured every 2 days (D); tumor weights at sacrifice (E); percentage of Ki67+ tumor cells (F); MKI67 level determined by RT-qPCR (G); representative FOXM1 binding at CCNA2KIF20A, and CDC2 promoters normalized to isotype control in ChIP-qPCR experiments (n = 2) (H); percentage of tumor cells with cleaved caspase-3 (I); FADD mRNA level determined by RT-qPCR (J); FADD protein level determined by western blot (K); GLUL expression determined by RT-qPCR (L). ∗p < 0.05, ∗∗p < 0.01, ∗∗∗p < 0.005, ∗∗∗∗p < 0.0001 (Mann-Whitney)with error bars representing SEM

References

    1. de La Coste A., Romagnolo B., Billuart P., Renard C.A., Buendia M.A., Soubrane O., Fabre M., Chelly J., Beldjord C., Kahn A., Perret C. Somatic mutations of the beta-catenin gene are frequent in mouse and human hepatocellular carcinomas. Proc. Natl. Acad. Sci. USA. 1998;95:8847–8851. - PMC - PubMed
    1. Wei Y., Fabre M., Branchereau S., Gauthier F., Perilongo G., Buendia M.A. Activation of beta-catenin in epithelial and mesenchymal hepatoblastomas. Oncogene. 2000;19:498–504. doi: 10.1038/sj.onc.1203356. - DOI - PubMed
    1. Hirsch T.Z., Pilet J., Morcrette G., Roehrig A., Monteiro B.J.E., Molina L., Bayard Q., Trépo E., Meunier L., Caruso S., et al. Integrated Genomic Analysis Identifies Driver Genes and Cisplatin-Resistant Progenitor Phenotype in Pediatric Liver Cancer. Cancer Discov. 2021;11:2524–2543. doi: 10.1158/2159-8290.CD-20-1809. - DOI - PMC - PubMed
    1. Cadigan K.M., Waterman M.L. TCF/LEFs and Wnt signaling in the nucleus. Cold Spring Harb. Perspect. Biol. 2012;4 doi: 10.1101/cshperspect.a007906. - DOI - PMC - PubMed
    1. Gougelet A., Torre C., Veber P., Sartor C., Bachelot L., Denechaud P.D., Godard C., Moldes M., Burnol A.F., Dubuquoy C., et al. T-cell factor 4 and beta-catenin chromatin occupancies pattern zonal liver metabolism in mice. Hepatology. 2014;59:2344–2357. doi: 10.1002/hep.26924. - DOI - PubMed