. 2024 Jan 20:25:100970.
doi: 10.1016/j.mtbio.2024.100970. eCollection 2024 Apr.

Machine learning-based approach for automated classification of cell and extracellular matrix using nanomechanical properties

Affiliations

Machine learning-based approach for automated classification of cell and extracellular matrix using nanomechanical properties

Tanmay Kulkarni et al. Mater Today Bio. .

Abstract

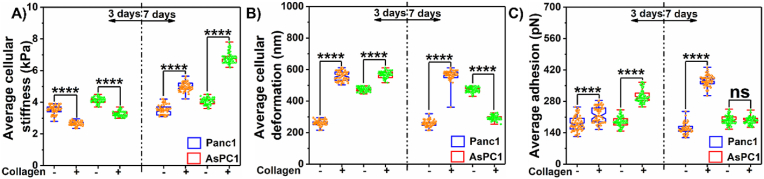
Fibrosis characterized by excess accumulation of extracellular matrix (ECM) due to complex cell-ECM interactions plays a pivotal role in pathogenesis. Herein, we employ the pancreatic ductal adenocarcinoma (PDAC) model to investigate dynamic alterations in nanomechanical attributes arising from the cell-ECM interactions to study the fibrosis paradigm. Several segregated studies performed on cellular and ECM components fail to recapitulate their complex collaboration. We utilized collagen and fibronectin, the two most abundant PDAC ECM components, and studied their nanomechanical attributes. We demonstrate alteration in morphology and nanomechanical attributes of collagen with varying thicknesses of collagen gel. Furthermore, by mixing collagen and fibronectin in various stoichiometry, their nanomechanical attributes were observed to vary. To demonstrate the dynamicity and complexity of cell-ECM, we utilized Panc-1 and AsPC-1 cells with or without collagen. We observed that Panc-1 and AsPC-1 cells interact differently with collagen and vice versa, evident from their alteration in nanomechanical properties. Further, using nanomechanics data, we demonstrate that ML-based techniques were able to classify between ECM as well as cell, and cell subtypes in the presence/absence of collagen with higher accuracy. This work demonstrates a promising avenue to explore other ECM components facilitating deeper insights into tumor microenvironment and fibrosis paradigm.

Keywords: Extracellular matrix; Fibrosis; Machine learning; Nanomechanical attributes; Pancreatic cancer; Support vector machines.


Conflict of interest statement

The authors declare that they have no known competing financial interests or personal relationships that could have appeared to influence the work reported in this paper.

Figures

Image 1
Graphical abstract
Fig. 1
Fig. 1
Nanomechanical attributes of collagen gel layers. Representative morphology images of 6 layers: A) Height image and B) Peak Force Error (PFE) image, 9 layers: C) Height image and D) PFE image, and 12 layers: E) Height image and F) PFE image. Quantification of collagen gel attributes G) Thickness. H) Stiffness. I) Deformation. J) Adhesion. (Scale bar: 1 μm); (Color bar for A, C and E: 2.5 μm–2.5 μm. Color bar for B, D and F: 1.5 nN–1.5 nN). (n = 14; 1G) and (n = 50; 1H-1J). Statistical significance. ****; p < 0.0001 performed by One Way ANNOVA.
Fig. 2
Fig. 2
Nanomechanical signatures of ECM complex. A) Representative height image of fibronectin and collagen (1:25) (Blue circles indicate fibronectin aggregates). Alteration in nanomechanical attributes for fibronectin and collagen mixed in various stoichiometry ratio, B) Stiffness. C) Deformation. D) Adhesion. (Scale bar: 1 μm). (Color bar −2.5 μm–2.5 μm. (n = 50). Statistical significance: ****; p < 0.0001 performed by One Way ANNOVA.
Fig. 3
Fig. 3
Representative heat map demonstrating dynamic alteration in nanomechanical attributes of collagen in the presence or absence of PDAC cells over 3 and 7 days. A) Stiffness. B) Deformation. C) Adhesion. Quantification of nanomechanical attributes of collagen in the presence or absence of PDAC cells over 3 and 7 days. D) Stiffness. E) Deformation and F) Adhesion. (n = 125) Statistical significance. ****; p < 0.0001 performed by One Way ANNOVA.
Fig. 4
Fig. 4
Dynamic influence of collagen on nanomechanical attributes of PDAC cells. A) Stiffness. B) Deformation and C) Adhesion. Statistical significance. ****; p < 0.0001 performed by One Way ANNOVA.
Fig. 5
Fig. 5
Dynamic alteration in morphological traits of PDAC cells in the presence and absence of collagen. A) Representative height profile and peak force error (PFE) images of Panc1 and AsPC-1 cells in the presence and absence of collagen. Quantification of B) Height and C) Surface roughness in Panc1 cells. Quantification of D) Height and E) Surface roughness in AsPC-1 cells. Heat map exhibiting correlation coefficients between morphological and nanomechanical attributes in F) Panc1 and G) AsPC-1 cells. In Figure A: Scale bar: 2 μm; (Color bar -9μm–9 μm for height profile images and from -5nN to 5 nN for PFE images. (n = 12). Statistical significance. ****; p < 0.0001 performed by One Way ANNOVA.
Fig. 6
Fig. 6
ML technique classifies Panc-1 and AsPC-1 cells in the absence of collagen based on their nanomechanical attributes. SVM based classifier with a linear kernel was employed. A) 3 days of culture and B) 7 days of culture.
Fig. 7
Fig. 7
ML technique classifies Panc-1 and AsPC-1 cells in the presence of collagen based on their nanomechanical attributes. SVM based classifier with a linear kernel was employed for both, A) 3 days of culture and B) 7 days of culture. ML technique classifies collagen in the presence of Panc-1 and AsPC-1 cells based on their nanomechanical attributes. SVM-based classifier with a linear kernel was used for C) 3 days of culture and SVM-based classifier with a quadratic kernel for D 7 days of culture.
Fig. 8
Fig. 8
ML technique classifies Panc-1 and AsPC-1 cells in the presence and absence of collagen based on their nanomechanical attributes. SVM based classifier with a linear kernel was employed. A) 3 days of culture and B) 7 days of culture.
Fig. 9
Fig. 9
ML technique classifies collagen and fibronectin stoichiometry ratios based on their nanomechanical attributes. SVM based classifier with a linear kernel was employed. A) Confusion matrix exhibiting true positive rate (TPR) and false negative rate (FNR). B) Scatter plot depicting adhesion and stiffness values for various stoichiometry ratios of collagen and fibronectin shows a clear overlap between collagen and 1:75 by parts of fibronectin and collagen.

References

    1. Zhou W.-C., Zhang Q.-B., Qiao L. Pathogenesis of liver cirrhosis. World J. Gastroenterol.: WJG. 2014;20(23):7312. - PMC - PubMed
    1. Thannickal V.J., Toews G.B., White E.S., Lynch J.P., Iii, Martinez F.J. Mechanisms of pulmonary fibrosis. Annu. Rev. Med. 2004;55:395–417. - PubMed
    1. Talman V., Ruskoaho H. Cardiac fibrosis in myocardial infarction—from repair and remodeling to regeneration. Cell Tissue Res. 2016;365:563–581. - PMC - PubMed
    1. Özdemir B.C., Pentcheva-Hoang T., Carstens J.L., Zheng X., Wu C.-C., Simpson T.R., Laklai H., Sugimoto H., Kahlert C., Novitskiy S.V. Depletion of carcinoma-associated fibroblasts and fibrosis induces immunosuppression and accelerates pancreas cancer with reduced survival. Cancer Cell. 2014;25(6):719–734. - PMC - PubMed
    1. Gabbiani G. The myofibroblast in wound healing and fibrocontractive diseases. J. Pathol.: A Journal of the Pathological Society of Great Britain and Ireland. 2003;200(4):500–503. - PubMed

LinkOut - more resources