[Preprint]. 2024 Jan 18:rs.3.rs-3867797.
doi: 10.21203/rs.3.rs-3867797/v1.

Identification of sleep and circadian alternative polyadenylation sites associated with APA-linked human brain disorders

Affiliations

Identification of sleep and circadian alternative polyadenylation sites associated with APA-linked human brain disorders

Carlos C Flores et al. Res Sq. .

Update in

Abstract

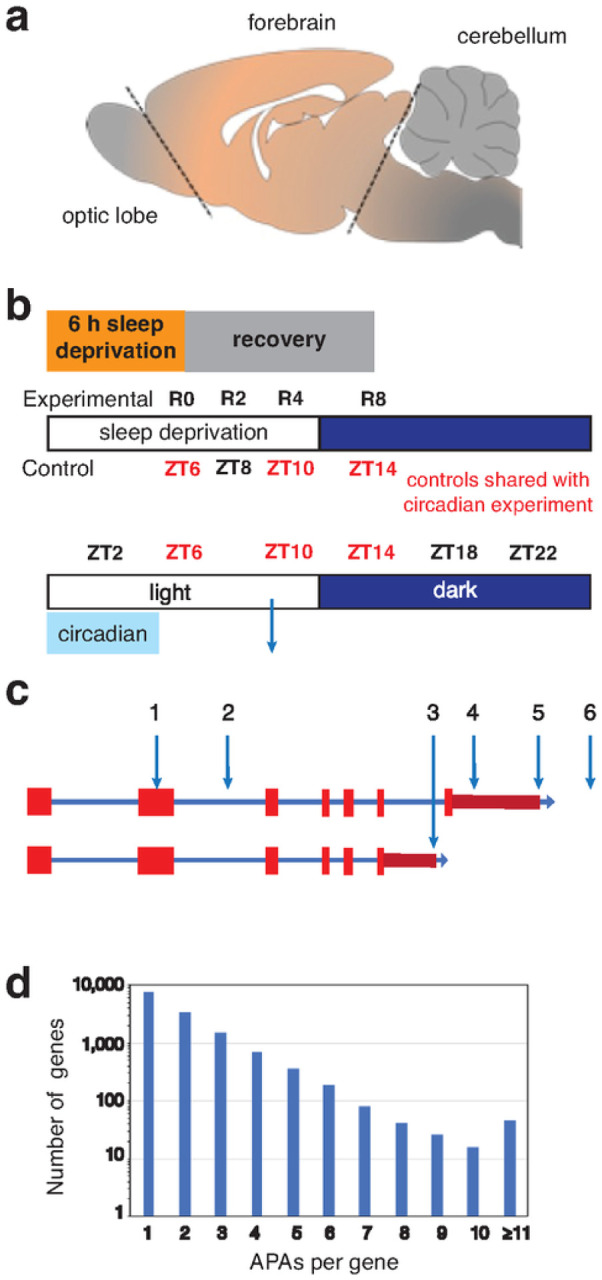
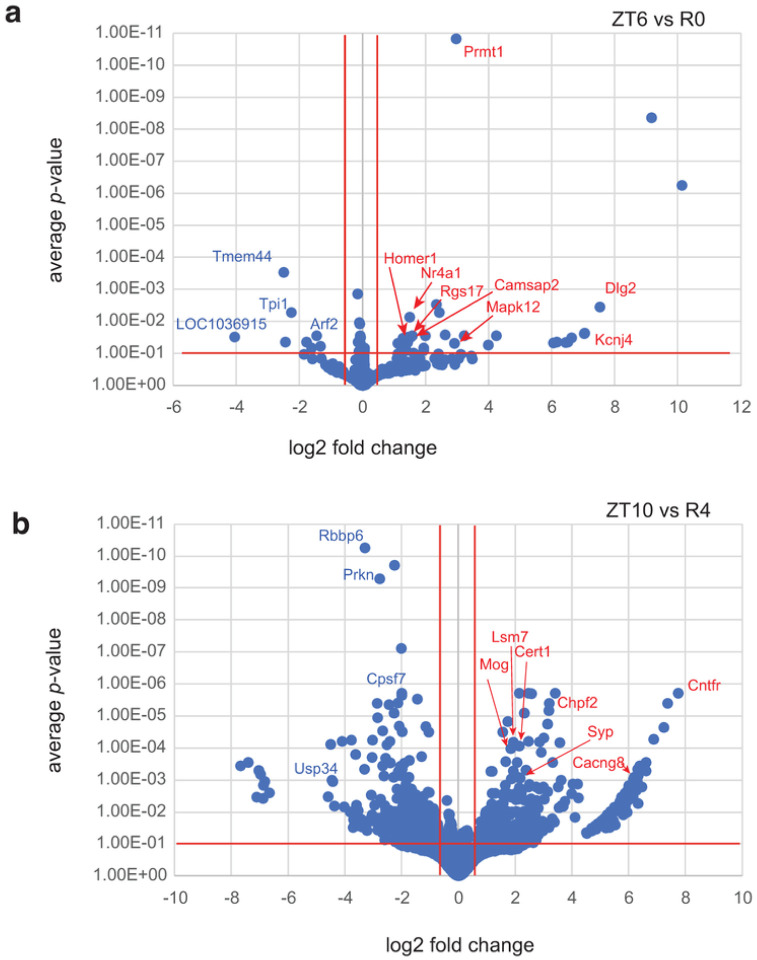
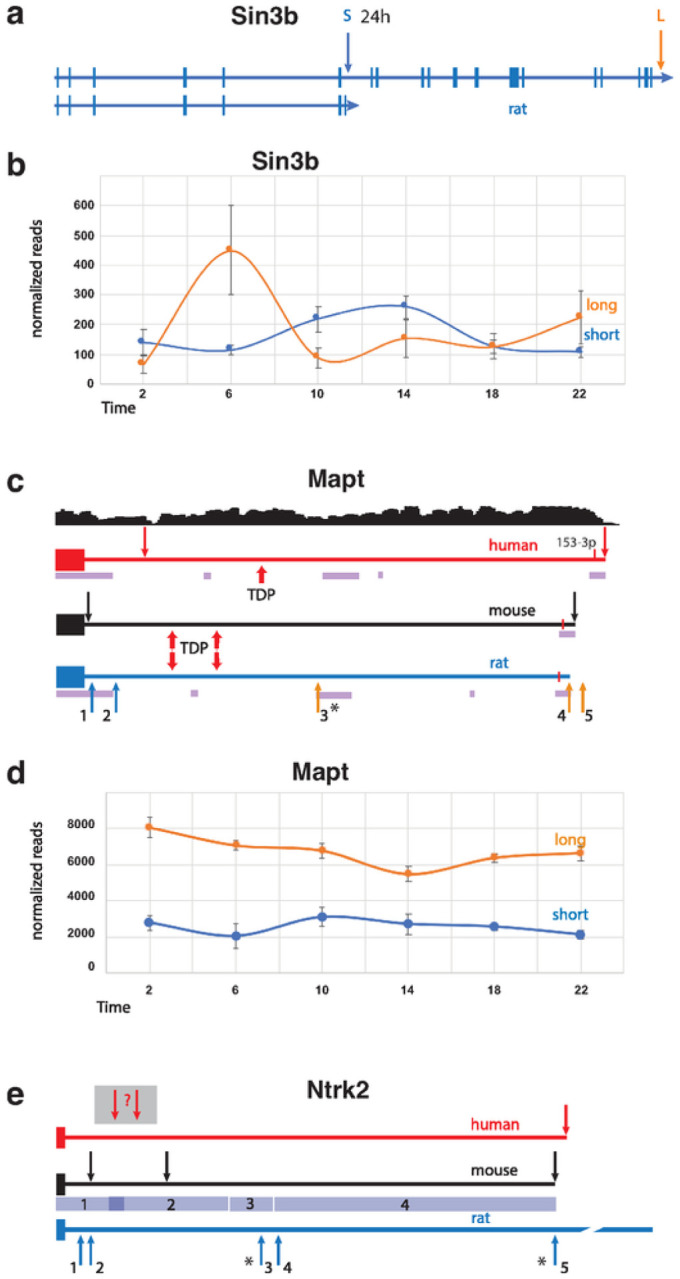
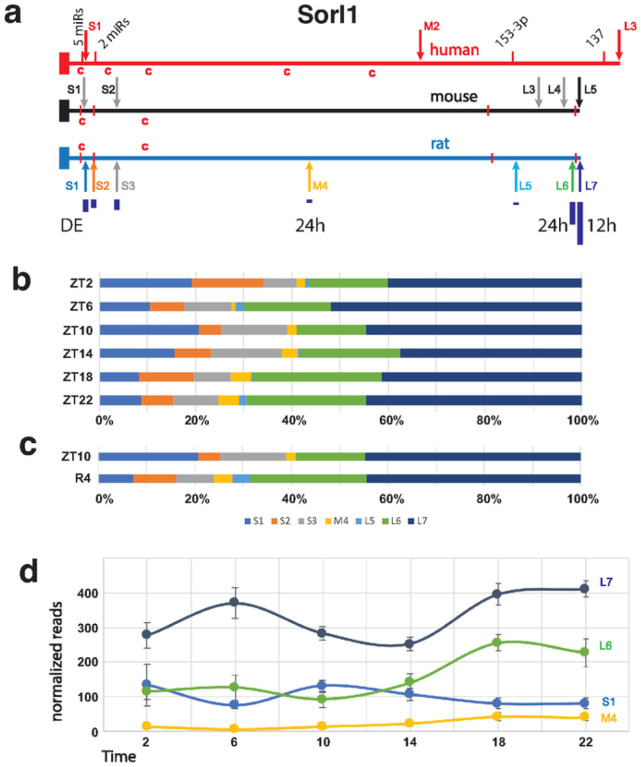
Sleep and circadian rhythm disruptions are comorbid features of many pathologies and can negatively influence numerous health conditions, including degenerative diseases, metabolic illnesses, cancer, and various neurological disorders. Genetic association studies linking sleep and circadian disturbances with disease susceptibility have mainly focused on changes in gene expression due to mutations, such as single-nucleotide polymorphisms. Thus, associations between sleep and/or circadian rhythm and alternative polyadenylation (APA), particularly in the context of other health challenges, are largely undescribed. APA is a process that generates various transcript isoforms from the same gene, resulting in effects on mRNA translation, stability, localization, and subsequent function. Here, we have identified unique APAs in rat brain that exhibit time-of-day-dependent oscillations in expression as well as APAs that are altered by sleep deprivation and the subsequent recovery period. Genes affected by APA usage include Mapt/Tau, Ntrk2, Homer1A, Sin3band Sorl. Sorl1 has two APAs which cycle with a 24 h period, one additional APA cycles with a 12 h period and one more that is reduced during recovery sleep. Finally, we compared sleep- or circadian-associated APAs with recently described APA-linked brain disorder susceptibility genes and found 46 genes in common.


Conflict of interest statement

Competing interests J.G. is the founder of Blood Brain Biotechnology, LLC. All other authors declare no competing interests.

Figures

Figure 1
Figure 1
Schema of the brain region sampled, the collection time/condition, and a plot of the number of APA sites per gene. (a) The region of the central rat forebrain that was collected and used for RNA extraction is labeled ‘forebrain’. (b) For sleep homeostasis experiments, rats were sleep-deprived for 6 h and allowed to recover for 0 to 8 h before tissue extraction. Three of the time-matched controls (no SD) were shared with the circadian experiment and one additional time point (no SD at ZT8), was not in common. For the circadian analysis, samples were taken at 4 h intervals from ZT2 until ZT22. Five biological replicates were used for all data points. (c) A diagram of a generic gene shows different types of APAs: within an internal exon (1); within an early intron (2); following an internal exon (3); within the longest documented 3’ UTR (4); at the terminus of the longest documented 3’ UTR (5); and distal to longest documented 3’ UTR. (d) WTTS-seq PAS results; the number of genes on the x-axis (log10 scale) are plotted against the number of APA sites per gene.
Figure 2
Figure 2
Differential expression of PASs by DESeq-2 with Apeglm Shrinkage. Log of adjusted p-values are plotted against log2 fold changes from (a)ZT6 vs R0 and (b) ZT10 vs R4.
Figure 3
Figure 3
The Sin3b gene and 3’ UTR regions of the Mapt and Ntrk2 genes. (a) A map of the entire rat Sin3b gene depicts exons, introns and short and long APA sites. The corresponding genes in mouse and human are extremely similar. (b) The average normalized read counts ±SE (y-axis) of the short (circadian) and long Sin3b APAs are plotted against time-of-day (x-axis). (c) Maps of the 3’ UTR regions of the human, mouse, and rat Mapt genes are shown. Dark blue arrows indicate the positions of APA sites. In human MAPT, APA usage correlates with several brain disorders. RNA-seq coverage from individuals homozygous for the less common SNP allele that is associated with longer transcripts (adapted from Cui. et al.) is shown above the human MAPT 3’ UTR map. Binding sites for TDP-43 (indicated by red arrows) that were experimentally determined in mouse align with putative sites in the rat gene, and one possible TDP-43 binding site is indicated in the human 3’UTR. The significantly circadian APA is marked with an asterisk. Blocks of homologous sequence between the rat and human genes that were found by BLAST search are indicated by purple bars. The 3’ UTR lengths are 4,380, 4,119 and 3,946 n.t. for human, mouse, and rat, respectively. (d) The average normalized read counts ±SE (y-axis) of the short Mapt isoforms lacking TDP binding sites (1+2) and the sum of the three longer isoforms (3+4+5) plotted against time-of-day (x-axis) are shown. (e) The 3’ UTR of tyrosine kinase-deficient (TK-) isoforms of the human, mouse, and rat Ntrk2 TK- genes are shown. Arrows indicate the positions of APA sites. The depicted rat APAs are from this current dataset. Circadian rat APAs are indicated with asterisks. The 3’ UTR lengths are 5,125, 5,008 and 8,004 n.t. for human, mouse, and rat, respectively. Mouse and rat sequence comparison by BLAST produced 4 segments having 91%, 83%, 86% and 82% identity for regions 1, 2, 3 and 4, depicted by blue bars.
Figure 4
Figure 4
Map and APA read analyses of Sorl1. (a) Maps of the human, mouse and rat Sorl1 gene 3’ UTRs show APA sites indicated by arrows. Four highly conserved miR binding sites are marked by red bars in all three species. The first 2 are recognized by multiple miRs. The size of dark blue bars under the rat APAs depict the individual proportion compared to the total of all WTTS Sorl1 reads. The human APAs are from established isoforms which also include different exon configurations. The first 4 mouse APAs are suggested by ESTs, and, in the latter 3 cases, by upstream polyA signals and PolyA_DB v3 data. Red ‘c’s indicate matches to the consensus CPE sites. (b) The proportion each Sorl1 APA contributes to the total for the gene are plotted for each of the circadian timepoints. (c) The proportion each Sorl1 APA contributes to the total for the gene are plotted for the differentially expressed samples: ZT10 and 4 hours after SD. (d)Graph of normalized read numbers of 4 Sorl1 APAs that either cycle with 24 h (M4 and L6) or 12 h (L7) hours and the one differentially expressed after SD (S1).

References

    1. Abbott S. M., Malkani R. G. & Zee P. C. Circadian disruption and human health: A bidirectional relationship. Eur J Neurosci 51, 567–583, doi: 10.1111/ejn.14298 (2020). - DOI - PMC - PubMed
    1. Grandner M. A. & Fernandez F. X. The translational neuroscience of sleep: A contextual framework. Science 374, 568–573, doi: 10.1126/science.abj8188 (2021). - DOI - PMC - PubMed
    1. Medic G., Wille M. & Hemels M. E. Short- and long-term health consequences of sleep disruption. Nat Sci Sleep 9, 151–161, doi: 10.2147/NSS.S134864 (2017). - DOI - PMC - PubMed
    1. Baglioni C. et al. Sleep and mental disorders: A meta-analysis of polysomnographic research. Psychol Bull 142, 969–990, doi: 10.1037/bul0000053 (2016). - DOI - PMC - PubMed
    1. Alachkar A. et al. The hidden link between circadian entropy and mental health disorders. Transl Psychiatry 12, 281, doi: 10.1038/s41398-022-02028-3 (2022). - DOI - PMC - PubMed

Publication types