[Preprint]. 2024 Jan 23:2024.01.22.576625.
doi: 10.1101/2024.01.22.576625.

TDP-43 loss induces extensive cryptic polyadenylation in ALS/FTD

Affiliations

TDP-43 loss induces extensive cryptic polyadenylation in ALS/FTD

Sam Bryce-Smith et al. bioRxiv. .

Update in

  • TDP-43 loss induces cryptic polyadenylation in ALS/FTD.
    Bryce-Smith S, Brown AL, Chien MZYJ, Dattilo D, Mehta PR, Mattedi F, Barattucci S, Mikheenko A, Zanovello M, Pellegrini F, El-Agamy SE, Yome M, Hill SE, Qi YA, Sun K, Ryadnov E, Wan Y; NYGC ALS Consortium; Vargas JNS, Birsa N, Raj T, Humphrey J, Keuss M, Wilkins OG, Ward M, Secrier M, Fratta P. Bryce-Smith S, et al. Nat Neurosci. 2025 Oct 21. doi: 10.1038/s41593-025-02050-w. Online ahead of print. Nat Neurosci. 2025. PMID: 41120751

Abstract

Nuclear depletion and cytoplasmic aggregation of the RNA-binding protein TDP-43 is the hallmark of ALS, occurring in over 97% of cases. A key consequence of TDP-43 nuclear loss is the de-repression of cryptic exons. Whilst TDP-43 regulated cryptic splicing is increasingly well catalogued, cryptic alternative polyadenylation (APA) events, which define the 3' end of last exons, have been largely overlooked, especially when not associated with novel upstream splice junctions. We developed a novel bioinformatic approach to reliably identify distinct APA event types: alternative last exons (ALE), 3'UTR extensions (3'Ext) and intronic polyadenylation (IPA) events. We identified novel neuronal cryptic APA sites induced by TDP-43 loss of function by systematically applying our pipeline to a compendium of publicly available and in house datasets. We find that TDP-43 binding sites and target motifs are enriched at these cryptic events and that TDP-43 can have both repressive and enhancing action on APA. Importantly, all categories of cryptic APA can also be identified in ALS and FTD post mortem brain regions with TDP-43 proteinopathy underlining their potential disease relevance. RNA-seq and Ribo-seq analyses indicate that distinct cryptic APA categories have different downstream effects on transcript and translation. Intriguingly, cryptic 3'Exts occur in multiple transcription factors, such as ELK1, SIX3, and TLX1, and lead to an increase in wild-type protein levels and function. Finally, we show that an increase in RNA stability leading to a higher cytoplasmic localisation underlies these observations. In summary, we demonstrate that TDP-43 nuclear depletion induces a novel category of cryptic RNA processing events and we expand the palette of TDP-43 loss consequences by showing this can also lead to an increase in normal protein translation.


Figures

Figure 1 -
Figure 1 -. TDP-43 depletion induces cryptic APA in a compendium of in vitro TDP-43 datasets
A) Schematic demonstration of the computational pipeline to detect, quantify and infer differential usage of last exons from bulk RNA-seq data. De-novo transcripts are assembled using StringTie and subsequently filtered for a mean TPM > 1 within each experimental condition. Last exons are extracted from transcript models and compared to reference annotation (purple) to identify putative novel last exons (orange). Putative last exons are filtered for predicted 3’ends < 100nt from sites in the PolyASite database, or rescued if a conserved polyA signal hexamer can be identified within the last 100nt of the last exon. Novel and annotated last exons were subsequently quantified using Salmon and assessed for differential usage using DEXSeq. For further details see Methods. B) Last exons responsive to TDP-43 depletion. All points represent a last exon passing a Benjamini-Hochberg adjusted p-value < 0.05 threshold in at least one dataset. Where a last exon passes the threshold in multiple datasets, the median values across datasets are calculated to represent the basal usage and change in usage upon TDP-43 depletion. Last exons passing our cryptic threshold are highlighted in orange (Benjamini-Hochberg adjusted p-value < 0.05, mean usage in control cells < 10 % and change in usage between TDP-43 knockdown and control (‘TDP43KD’ - ‘CTRL’) > 10 %). C) Example RNA-seq coverage traces control (grey) and TDP-43 knockdown (gold) i3Neuron samples for cryptic ALE (ARHGAP32), IPA (ANKRD27) and 3’Ext (TLX1) events. Dashed lines indicate landmarks around which TDP-43 binding is assessed in (C) and (D). ARHGAP32 and ANKRD27 are encoded on the reverse strand but flipped to read 5’−3’ for visualisation purposes. D) TDP-43 binding maps around boundaries of ALEs. (Top) TDP-43 iCLIP RNA maps around the first nucleotide of the last exon (‘Exon Start’) and the polyA site (‘PAS’) of ALEs. The solid lines represent the mean coverage (equivalent to fraction coverage) of relative positions upstream (negative values) and downstream (positive values) of the landmark from pooled TDP-43 iCLIP peaks from SH-SY5Y cells (n=2) in background (black, n=929) and cryptic ALEs (orange, n=92). Shaded intervals represent +/− 1 SE for the corresponding coloured group. (Bottom) TDP-43 motif maps around the first nucleotide of the last exon (‘Exon Start’) and the polyA site (‘PAS’) of ALEs. The solid lines represent the mean coverage by YG-containing hexamers (Supplementary Fig. 3A) of relative positions upstream (negative values) and downstream (positive values) of the landmark in background (black, n=929) and cryptic ALEs (orange, n=92). E) TDP-43 binding maps around alternative polyA sites of 3’Exts. (Top) TDP-43 iCLIP RNA maps around the proximal (‘Proximal’) and distal (‘Distal’) polyA site of 3’Ext events. As in D), but background (black, n=798) and cryptic regions (orange, n=86) are obtained for 3’Ext events. (Bottom) TDP-43 motif maps around the proximal (‘Proximal’) and distal (‘Distal’) polyA site of 3’Ext events. As in D), but background (black, n=798) and cryptic regions (orange, n=86) are obtained for 3’Ext events.
Figure 2 -
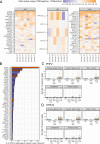
Figure 2 -. Cryptic last exons are detected in post-mortem ALS-FTD RNA-seq datasets
A) Heatmap of cryptic polyadenylation site usage in post-mortem FACS-seq data. Cells are coloured according to the magnitude of sample-wise difference in usage between TDP-43 depleted (TDPnegative) and TDP-43 positive (TDPpositive) cells. Rows represent individual cryptic last exons from in-vitro that passed enrichment criteria (median sample-wise difference in usage (TDPnegative - TDPpositive) > 5 %) and are arranged in descending order of the difference in usage within each event type. Columns represent individual patients within the cohort. B) Selectively expressed cryptic ALEs (orange) and splicing events (purple) in tissues and samples with TDP-43 proteinopathy in the New York Genome Centre (NYGC) ALS Consortium dataset. Events are considered detected if at least 2 junction reads were detected in a sample. C) Detection of spliced reads for the cryptic ALE in PHF2 across samples in the NYGC ALS Consortium dataset. ‘CTL’ denotes control samples. Colour indicates whether disease subtype and region is expected (orange) or not expected (green) to have TDP-43 pathology and cryptic spliced read expression. D) As in C), but for cryptic ALE in SYNJ2.
Figure 3 -
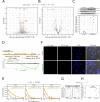
Figure 3 -. Cryptic 3’UTR extensions in transcription factor RNAs lead to increased RNA and protein levels by increased RNA stability and altered localisation
A) Volcano plot of differential expression analysis of RNA-seq data between TDP-43 knockdown (TDP43KD) and control (CTRL) i3Neurons. Cryptic 3’Ext genes with increased translation (Fig. 3B) are highlighted in orange. Genes with a −log10 transformed Benjamini-Hochberg adjusted p-value greater than 50 are collapsed to 50 for visualisation purposes. B) Volcano plot of differential expression analysis of Ribo-seq data between TDP-43 knockdown (TDP43KD) and control (CTRL) i3Neurons. Genes are highlighted if they contain a cryptic 3’Ext (orange), ALE (blue) or IPA (green) event. Genes with a −log10 transformed Benjamini-Hochberg adjusted p-value are collapsed to 10 for visualisation purposes. C) Western blot analysis of ELK1 protein levels in Halo-TDP-43 i3Neurons. (Top) Western blot showing increased ELK1 protein expression upon TDP-43 KD in Halo-TDP-43 i3Neurons. (Bottom) Quantification of ELK1 band intensities normalised to Tubulin in control (CTRL) and TDP-43 knockdown (TDP43KD) Halo-TDP-43 i3Neurons. D) Analysis of ELK1 transcription factor activity. (Top) Coverage trace in control (black) and TDP-43 knockout (gold) samples for the ELK1 cryptic 3’Ext in HeLa cells. (Bottom) Enrichment plot for ChIP-seq defined ELK1 target genes in TDP-43 knockout HeLa cells. The green line corresponds to GSEA’s running sum statistic, and red horizontal dashed lines mark the maximal enrichment score among upregulated and downregulated genes. The vertical dashed line demarcates the rank between upregulated and downregulated genes in the evaluated gene set. Black vertical bars correspond to locations of ELK1 target genes in the ranked gene set. The black text reports the normalised enrichment score (‘NES’, normalised to the mean enrichment score of random samples of the same size as the gene set) and Benjamini-Hochberg adjusted p-value (‘padj’) E) Decay curve for RNA produced before 4SU labelling in i3Neuron SLAM-seq data for control (grey) and knockdown (orange) samples. Solid curves indicate the fitted estimate of the level of old RNA for each condition. Individual samples are shown as points with the upper and lower 95% credible interval shown as error bars. GrandR-estimated half-lives for control (grey) and knockdown (orange) samples are reported in the inset text for each gene. F) Representative images for FISH probes targeting the annotated (‘ELK1 Total’, green) 3’UTR and cryptic 3’UTR specific (‘ELK1 Cryptic’, magenta) sequences of ELK1 in control (top row) and TDP-43 knockdown (bottom row) i3Neurons. The white lines in the ‘Brightfield’ column represent scale bars (10 µm). G) Quantification of total FISH probe signal for the probes targeting the annotated 3’UTR (‘Total’) and cryptic 3’UTR specific (‘Cryptic’) sequences of ELK1. Different shapes represent independent replicates. Mean foci counts per cell (n=10 images) are normalised with respect to the control sample from the same replicate (Methods). A single asterisk (*) represents a Benjamini-Hochberg adjusted p-value < 0.05 from a one-sample t-test on log-transformed ratios (Methods). H) Subcellular quantification of FISH signal for probes targeting the annotated 3’UTR region (‘Total ELK1’) of ELK1. Different shapes represent independent replicates. The mean ratio of extranuclear:nuclei foci counts (n=10 images) is normalised with respect to the control sample from the same experimental replicate (Methods). The numeric label represents the Benjamini-Hochberg adjusted p-value from a one-sample t-test on log-transformed ratios (Methods).

References

    1. Neumann M., Sampathu D.M., Kwong L.K., Truax A.C., Micsenyi M.C., Chou T.T., Bruce J., Schuck T., Grossman M., Clark C.M., et al. (2006). Ubiquitinated TDP-43 in Frontotemporal Lobar Degeneration and Amyotrophic Lateral Sclerosis. Science 314, 130–133. 10.1126/science.1134108. - DOI - PubMed
    1. Neumann M., Tolnay M., and Mackenzie I.R.A. (2009). The molecular basis of frontotemporal dementia. Expert Rev. Mol. Med. 11, e23. 10.1017/S1462399409001136. - DOI - PubMed
    1. Meneses A., Koga S., O’Leary J., Dickson D.W., Bu G., and Zhao N. (2021). TDP-43 Pathology in Alzheimer’s Disease. Mol. Neurodegener. 16, 84. 10.1186/s13024-021-00503-x. - DOI - PMC - PubMed
    1. Eréndira Avendaño-Vázquez S., Dhir A., Bembich S., Buratti E., Proudfoot N., and Baralle F.E. (2012). Autoregulation of TDP-43 mRNA levels involves interplay between transcription, splicing, and alternative polyA site selection. Genes Dev. 26, 1679–1684. 10.1101/gad.194829.112. - DOI - PMC - PubMed
    1. Rot G., Wang Z., Huppertz I., Modic M., Lenče T., Hallegger M., Haberman N., Curk T., von Mering C., and Ule J. (2017). High-Resolution RNA Maps Suggest Common Principles of Splicing and Polyadenylation Regulation by TDP-43. Cell Rep. 19, 1056–1067. 10.1016/j.celrep.2017.04.028. - DOI - PMC - PubMed

Publication types