. 2023 Dec 3;6(2):100980.
doi: 10.1016/j.jhepr.2023.100980. eCollection 2024 Feb.

Association of HBsAg levels with differential gene expression in NK, CD8 T, and memory B cells in treated patients with chronic HBV

Affiliations

Association of HBsAg levels with differential gene expression in NK, CD8 T, and memory B cells in treated patients with chronic HBV

Boris J B Beudeker et al. JHEP Rep. .

Abstract

Background & aims: HBsAg secretion may impact immune responses to chronic HBV infection. Thus, therapeutic approaches to suppress HBsAg production are being investigated. Our study aims to examine the immunomodulatory effects of high and low levels of circulating HBsAg and thereby improve our understanding of anti-HBV immunity.

Methods: An optimized 10x Genomics single-cell RNA sequencing workflow was applied to blood samples and liver fine-needle aspirates from 18 patients undergoing tenofovir/entecavir (NUC) treatment for chronic HBV infection. They were categorized based on their HBsAg levels: high (920-12,447 IU/ml) or low (1-100 IU/ml). Cluster frequencies, differential gene expression, and phenotypes were analyzed.

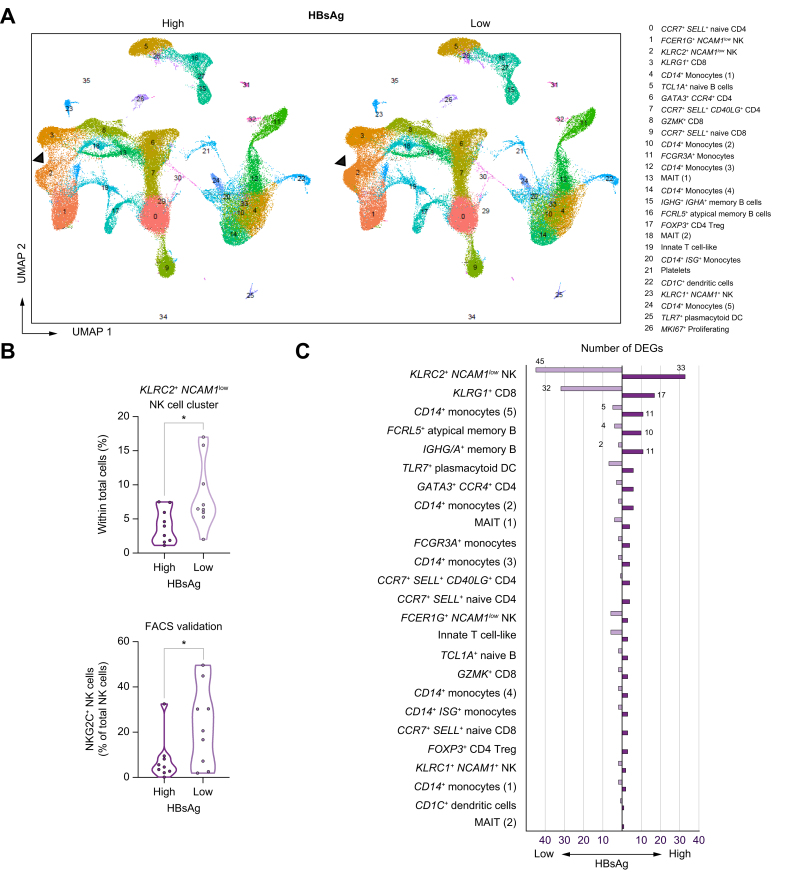
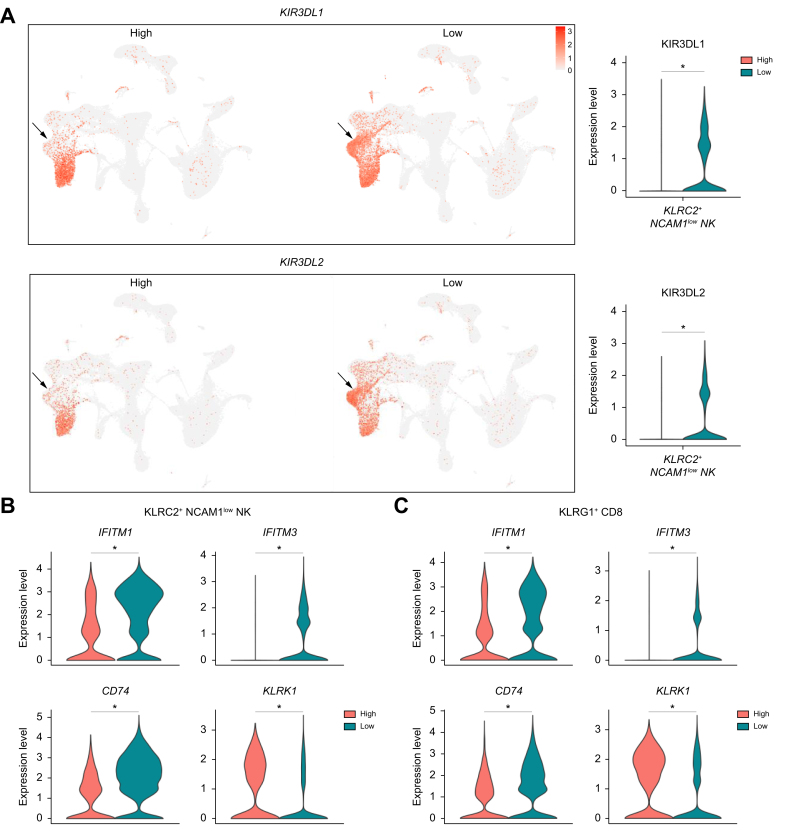
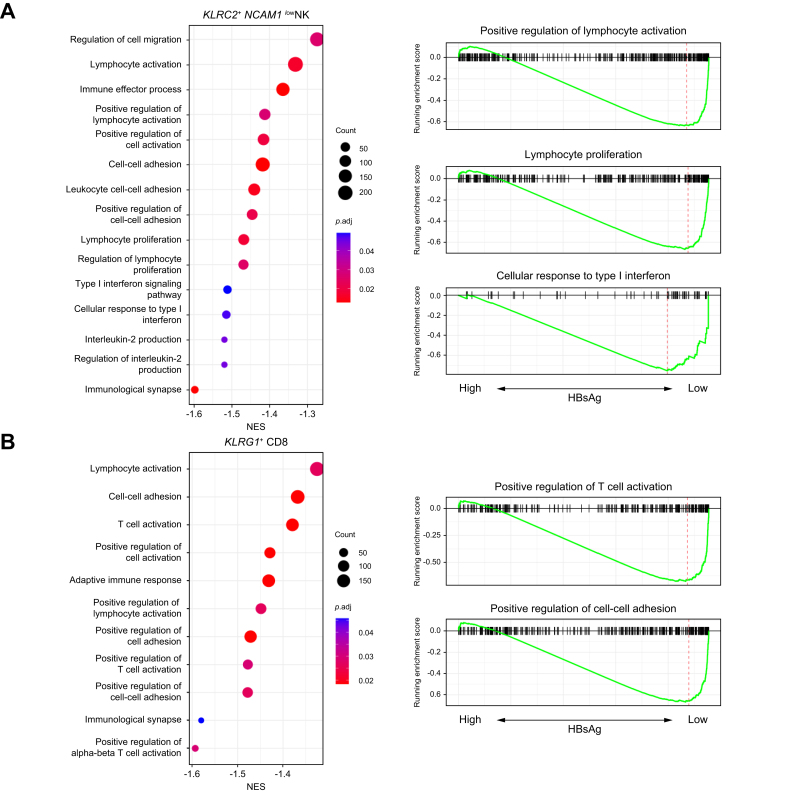
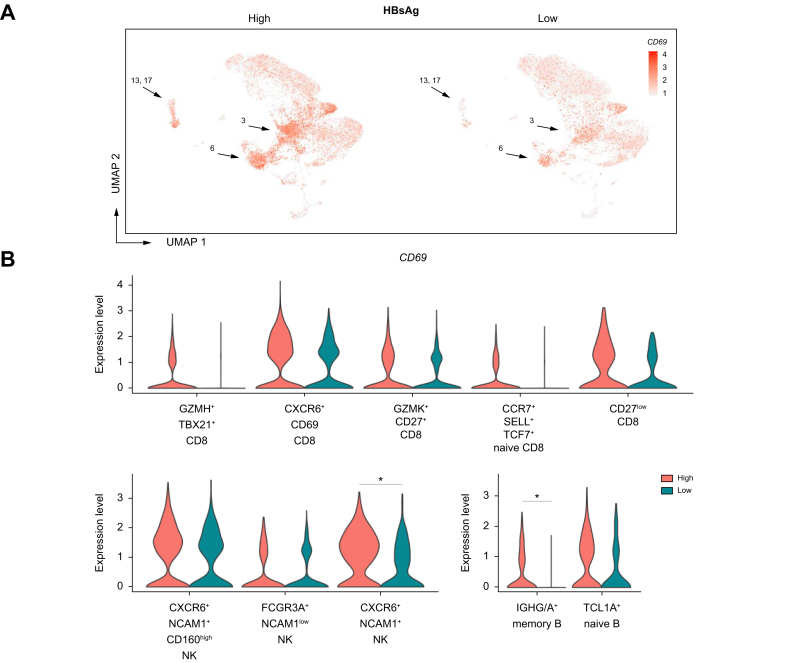
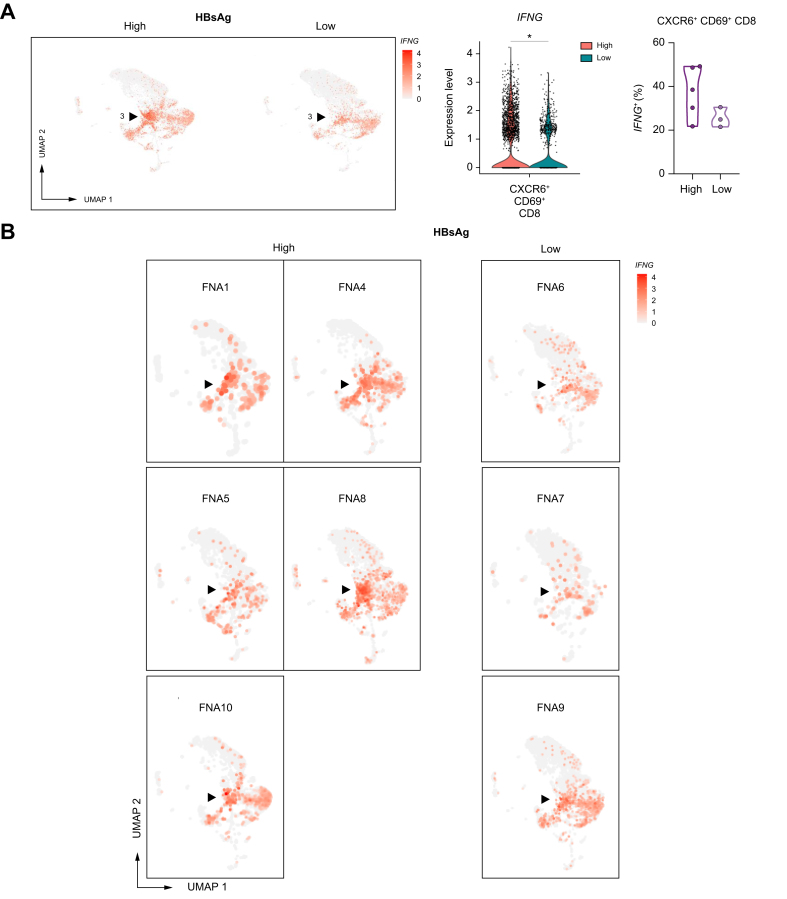
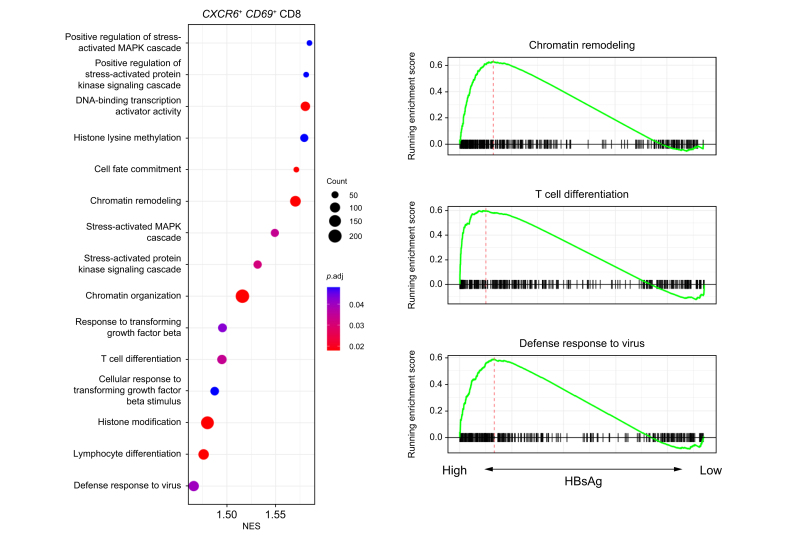
Results: In the blood of HBV-infected patients on NUC, the proportion of KLRC2+ "adaptive" natural killer (NK) cells was significantly lower in the HBsAg-high group and, remarkably, both KLRC2+ NK and KLRG1+ CD8 T cells display enrichment of lymphocyte activation-associated gene sets in the HBsAg-low group. High levels of HBsAg were associated with mild immune activation in the liver. However, no suppression of liver-resident CXCR6+ NCAM1+ NK or CXCR6+ CD69+ CD8 T cells was detected, while memory B cells showed signs of activation in both the blood and liver.

Conclusions: Among NUC-treated patients, we observed a minimal impact of HBsAg on leukocyte populations in the blood and liver. However, for the first time, we found that HBsAg has distinct effects, restricted to NK-, CD8 T-, and memory B-cell subsets, in the blood and liver. Our findings are highly relevant for current clinical studies evaluating treatment strategies aimed at suppressing HBsAg production and reinvigorating immunity to HBV.

Impact and implications: This study provides unique insight into the impact of HBsAg on gene expression levels of immune cell subsets in the blood and liver, particularly in the context of NUC-treated chronic HBV infection. It holds significant relevance for current and future clinical studies evaluating treatment strategies aimed at suppressing HBsAg production and reinvigorating immunity to HBV. Our findings raise questions about the effectiveness of such treatment strategies and challenge the previously hypothesized immunomodulatory effects of HBsAg on immune responses against HBV.

Keywords: HBsAg; hepatitis B; liver fine-needle aspirates; single-cell RNA sequencing.


Conflict of interest statement

A.B. received grants not related to this project from Gilead Sciences, Fujirebio, GlaxoSmithKline, and Janssen Pharma. R.J.K. received grants from GlaxoSmithKline, Janssen-Cilag, and Echosens (not related to this project), and received consulting fees, payments or honoraria for lectures, presentations, or other educational events from AbbVie, Echosens, and Gilead Sciences. All remaining authors declare that they have no conflicts of interest. Please refer to the accompanying ICMJE disclosure forms for further details.

Figures

None
Graphical abstract
Fig. 1
Fig. 1
PBMC clusters. (A) UMAP scRNA clustering of PBMCs split by HBsAg level. (B) Bar plot showing the fraction of each cluster within both patient groups. The proportion of KLRC2+ NCAM1low NK cells is significantly lower in the HBsAg-high group than the HBsAg-low group (p = 0.0053, Wilcoxon rank-sum). Flow cytometric analysis confirmed a significantly lower frequency of NKG2C+ NK cells in patients with high HBsAg levels (p = 0.04). (C) The total number of DEGs observed in each cluster within the HBsAg-high and HBsAg-low group. Significant changes in the expression of ribosomal and mitochondrial genes were discarded. To determine significant differences, Wilcoxon rank-sum test with FDR correction was used (adjusted p <0.05). DEGs, differentially expressed genes; FDR, false discovery rate; NK, natural killer; PBMCs, peripheral blood mononuclear cells; scRNA, single-cell RNA; UMAP, uniform manifold approximation and projection.
Fig. 2
Fig. 2
Significant gene expression changes associated with HBsAg in adaptive KLR2C+ NCAM1low NK- and KLRG1+ CD8 T-cell clusters. (A) Feature plot split by HBsAg level showing relative log gene expression levels of KIR3DL1 and KIR3DL2. Each dot represents a single cell, relative log gene expression levels are represented by a color scale and violin plot on the right side of the figure. The black arrow points towards the KLRC2+ NCAM1low NK-cell cluster. Gene expression levels of IFITM1, IFITM3, CD74 and KLRK1 are shown in violin plots for the (B) KLRC2+ NCAM1low NK-cell and (C) KLRG1+ CD8 T-cell clusters. For determining significant differences, Wilcoxon rank-sum test with FDR correction was used (adjusted p <0.05). FDR, false discovery rate; NK, natural killer.
Fig. 3
Fig. 3
GSEA of gene sets involved in lymphocyte-/T-cell activation in KLR2C+ NCAM1low NK and KLRG1+ CD8 T-cell clusters. GSEA dot plots showing gene sets and corresponding NES that are significantly enriched by the KLRC2+ NCAM1low NK-cell (A) and KLRG1+ CD8 T-cell cluster (B) within the HBsAg-low group compared to the HBsAg-high group. Gene sets with negative NES are enriched in the HBsAg-low group. Color and size of dots represents the adjusted p values and gene count, respectively. On the right side of the figure, GSEA plots are shown for a selection of gene sets. The vertical black lines in the running enrichment score (green line) show where the members of the gene set appear in the ranked list of genes. The red dotted line represents the maximum enrichment score. P values were corrected with FDR correction method (adjusted p <0.05). FDR, false discovery rate; GSEA, gene set-enrichment analysis; NES, normalized enrichment scores.
Fig. 4
Fig. 4
Clustering of liver immune subsets and DEGs between the HBsAg-high and -low group. (A) UMAP scRNA clustering of immune subsets in FNAs split by HBsAg level. (B) The total number of DEGs observed in each cluster within the HBsAg-high and HBsAg-low groups. Significant changes in the expression of ribosomal and mitochondrial genes were discarded. To determine significant differences, Wilcoxon rank-sum test with FDR correction was used (adjusted p <0.05). DEGs, differentially expressed genes; FDR, false discovery rate; FNAs, fine-needle aspirates; scRNA, single-cell RNA; UMAP, uniform manifold approximation and projection.
Fig. 5
Fig. 5
CD69 gene expression by HBsAg level and immune cell cluster. (A) Feature plot split by HBsAg level showing relative log gene expression levels of CD69. Each dot represents a single cell, relative log gene expression levels are represented by a color scale. The black arrows point towards the CXCR6+ CD69+ liver-resident CD8 T-cell cluster (3), the CXCR6+ NCAM1+ CD160high NK-cell cluster (6), and the naive and memory B-cell cluster (13, 17). (B) CD69 gene expression levels are shown in violin plots for all CD8-, NK- and B-cell clusters identified in the liver. For determining significant differences, Wilcoxon rank-sum test with FDR correction was used (adjusted p <0.05). FDR, false discovery rate; NK, natural killer.
Fig. 6
Fig. 6
Relative log gene expression levels of IFNG by HBsAg levels. Each dot represents a single cell, relative log gene expression levels are represented by a color scale. The black arrows point towards the CXCR6+ CD69+ liver-resident CD8 T-cell cluster (3). (A) Feature plot split by HBsAg level showing relative log gene expression levels of IFNG. On the right side of the figure, both the expression of IFNG and the percentage of CXCR6+ CD69+ liver-resident CD8 T cells that express IFNG are shown in violin plots. To determine significant differences, Wilcoxon rank-sum test with FDR correction was used (adjusted p <0.05). (B) Feature plots split by individual FNAs of patients showing relative log gene expression levels of IFNG. FDR, false discovery rate; FNAs, fine-needle aspirates.
Fig. 7
Fig. 7
GSEA dot plot showing gene sets that are significantly enriched by the CXCR6+ CD69+ liver-resident CD8 T-cell cluster within the HBsAg-high vs. the HBsAg-low group. Gene sets with positive NES are enriched in the HBsAg-high group. The color and size of the dots represent the adjusted p values and gene counts, respectively. On the right side of the figure, GSEA plots are shown for a selection of gene sets. P values were corrected with FDR correction method (adjusted p <0.05). FDR, false discovery rate; GSEA, gene set-enrichment analysis.

References

    1. Collaborators GBDHB Global, regional, and national burden of hepatitis B, 1990-2019: a systematic analysis for the Global Burden of Disease Study 2019. Lancet Gastroenterol Hepatol. 2022;7:796–829. - PMC - PubMed
    1. Mueller S.N., Ahmed R. High antigen levels are the cause of T cell exhaustion during chronic viral infection. Proc Natl Acad Sci U S A. 2009;106:8623–8628. - PMC - PubMed
    1. McLane L.M., Abdel-Hakeem M.S., Wherry E.J. CD8 T cell exhaustion during chronic viral infection and cancer. Annu Rev Immunol. 2019;37:457–495. - PubMed
    1. Fisicaro P., Barili V., Rossi M., et al. Pathogenetic mechanisms of T cell dysfunction in chronic HBV infection and related therapeutic approaches. Front Immunol. 2020;11:849. - PMC - PubMed
    1. Tout I., Loureiro D., Mansouri A., et al. Hepatitis B surface antigen seroclearance: immune mechanisms, clinical impact, importance for drug development. J Hepatol. 2020;73:409–422. - PubMed