. 2024 Mar 5;12(3):e0372323.
doi: 10.1128/spectrum.03723-23. Epub 2024 Feb 5.

A high-throughput target-based screening approach for the identification and assessment of Mycobacterium tuberculosis mycothione reductase inhibitors

Affiliations

A high-throughput target-based screening approach for the identification and assessment of Mycobacterium tuberculosis mycothione reductase inhibitors

Natalia Smiejkowska et al. Microbiol Spectr. .

Abstract

The World Health Organization's goal to combat tuberculosis (TB) is hindered by the emergence of anti-microbial resistance, therefore necessitating the exploration of new drug targets. Multidrug regimens are indispensable in TB therapy as they provide synergetic bactericidal effects, shorten treatment duration, and reduce the risk of resistance development. The research within our European RespiriTB consortium explores Mycobacterium tuberculosis energy metabolism to identify new drug candidates that synergize with bedaquiline, with the aim of discovering more efficient combination drug regimens. In this study, we describe the development and validation of a luminescence-coupled, target-based assay for the identification of novel compounds inhibiting Mycobacterium tuberculosis mycothione reductase (MtrMtb), an enzyme with a role in the protection against oxidative stress. Recombinant MtrMtb was employed for the development of a highly sensitive, robust high-throughput screening (HTS) assay by coupling enzyme activity to a bioluminescent readout. Its application in a semi-automated setting resulted in the screening of a diverse library of ~130,000 compounds, from which 19 hits were retained after an assessment of their potency, selectivity, and specificity. The selected hits formed two clusters and four fragment molecules, which were further evaluated in whole-cell and intracellular infection assays. The established HTS discovery pipeline offers an opportunity to deliver novel MtrMtb inhibitors and lays the foundation for future efforts in developing robust biochemical assays for the identification and triaging of inhibitors from high-throughput library screens.

Importance: The growing anti-microbial resistance poses a global public health threat, impeding progress toward eradicating tuberculosis. Despite decades of active research, there is still a dire need for the discovery of drugs with novel modes of action and exploration of combination drug regimens. Within the European RespiriTB consortium, we explore Mycobacterium tuberculosis energy metabolism to identify new drug candidates that synergize with bedaquiline, with the aim of discovering more efficient combination drug regimens. In this study, we present the development of a high-throughput screening pipeline that led to the identification of M. tuberculosis mycothione reductase inhibitors.

Keywords: drug discovery; high-throughput screening; mycothione reductase; tuberculosis.


Conflict of interest statement

K.T. and D.L. are employees of Janssen Pharmaceutica. N.V., N.S., L.O., K.V.C., L.D.V., R.G., H.P.M., K.A., S.V.S., D.C., Y.G.-J.S., and P.C. declare no conflicts of interest.

Figures
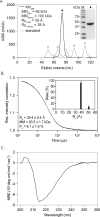
Fig 1
Fig 1
Quality control of recombinant MtrMtb. (A) MtrMtb size exclusion chromatography profile. The experiment was performed on a Superdex S200 16/60 column. The black and gray traces represent the chromatograms of the MtrMtb and the gel filtration standard, respectively. The standard includes five proteins: (a) thyroglobulin [670 kDa, hydrodynamic radius (Rh) 85.8 Å]; (b) globulin (158 kDa, Rh 51 Å); (c) ovalbumin (44 kDa, Rh 28 Å); (d) myoglobin (17 kDa, Rh 19 Å); and (e) vitamin B12 (1,350 Da, Rh 8.5 Å). The apparent molecular mass and hydrodynamic radius [apparent molecular mass (MMapp) and apparent hydrodynamic radius (Rh, app)] were derived based on the elution volumes of the standard proteins and compared to the theoretical values of the MtrMtb dimer obtained by analyzing the amino acid sequence (MMtheory and Rh,theory). The inset shows an SDS-PAGE analysis of the MtrMtb elution peak indicated by a black diamond and pre-stained protein molecular weight marker in lane M. (B) MtrMtb DLS. Black dots and gray trace represent experimental and fitted data, respectively. The inset shows the Rh distribution. MM, Rh, and polydispersity (Pd) were analyzed using Dynamics 7.1.9. (C) CD spectrum of MtrMtb.
Fig 2
Fig 2
Enzymatic activity of recombinant MtrMtb. (A) Schematic representation of the Mtr reaction incorporating the natural reaction substrate mycothiol disulfide (MSSM, left) and the substrate analog employed for the development of the enzymatic assay (right). MSSM is reduced to mycothiol (MSH) by Mtr in an NADPH-dependent reaction. Due to the low availability and strenuous synthesis of the natural substrate, the catalytic activity of purified enzymes was estimated in the reduction reaction of asymmetric mycothiol disulfide (BnMS-TNB) as previously described (28). Upon addition of NADPH, Mtr reduces the substrate analog leading to the formation of TNB and benzylated mycothiol (BnMSH). TNB release is observed by an increase in absorbance at 412 nm. Reactions were performed in triplicate (duplicate for the no-enzyme control) in 50-mM HEPES, 50-mM NaCl, 0.05% bovine serum albumin (BSA), 0.01% Tween 20, and pH 7.5. (B) Optimization of the substrate concentration. Reaction conditions include 5-nM MtrMtb, 150-µM NADPH, and varying substrate concentrations in 50-mM HEPES, 50-mM NaCl, 0.05% BSA, 0.01% Tween 20, and pH 7.5. The trace highlighted in blue represents the substrate concentration chosen for further studies. (C) Activity determination of MtrMtb and MtrMtbC39SC44S. The blue, red, and gray traces represent the reaction progress of the MtrMtb, MtrMtbC39SC44S, and the no enzyme control, respectively. Reaction conditions include 150-µM NADPH, 300-µM substrate, and 5-nM MtrMtb. Data are presented as average values ± standard deviation.
Fig 3
Fig 3
Development of the bioluminescent coupled enzymatic assay. (A) Overview of the assay setup. The reaction is initiated by adding NADPH to the wells containing the assay substrate and MtrMtb. During the reaction course, treatment with 0.8-M HCl disintegrates NADPH, thereby quenching the enzymatic reaction; nevertheless, the formed NADP+ remains unaffected. After neutralizing the reaction by 1-M Tris, pH 8.0, NADP/H-Glo Assay (Promega) is added as a one-step mixture to the assay wells. The NADP+ formed in the primary MtrMtb reaction is converted to NADPH by NADP+ cycling enzyme. In the presence of NADPH, the proluciferin reductase substrate is reduced to luciferin by reductase. The detection of luciferin by Ultra-Glo rLuciferase is measured over time. A standard curve of NADP+ served for the quantification of the formed NADP+. (B) Assay optimization. Three critical steps were explored: quenching time point of the primary reaction, the readout time of the luminescence-coupled assay, and the substrate turnover. In the upper panel, the primary MtrMtb reaction was quenched at 10-min intervals (Q2, 20 min; Q3, 30 min; Q4, 40 min; Q5, 50 min; Q6, 60 min) followed by monitoring of the luminescent signal over time. Three readout time points were selected from the linear reaction phase (R1, 20 min; R2, 25 min; R3, 30 min) to analyze the substrate turnover. In the lower panel, the quenching points (Q2–Q6) at the three readout time points (R1–R3) were interpolated to the NADP+ standard curve. Varying concentrations (0– 3 µM) of purified NADP+ were included in the assay setup, omitting the addition of NADPH, enzyme, and assay substrate. The NADP+ standard curve was obtained by plotting average net luminescence values [relative luminescence unit (RLU) of the signal – RLU of the background] for each readout time point (R1–R3) and performing linear regression analysis. The net luminescence values of the assay samples (Q2–Q6) were interpolated to the values in the standard curve to quantify the amount of formed NADP+ in the reactions. (C) Assay performance. The Z′-factor (upper panel) and the signal-to-background (S:B) ratio (lower panel) was calculated from measurements for each analyzed condition. Each point represents the average of triplicate measurements ± standard deviation. Black denotes selected conditions.
Fig 4
Fig 4
Validation of the miniaturized assay. Optimized reaction conditions, including 100-pM MtrMtb, 15-µM NADPH, and 30-µM assay substrate in 50-mM HEPES, 50-mM NaCl, 0.05% BSA, 0.01% Tween 20, and pH 7.5, were assessed on a 384-well small-volume plate (n = 16). Dilution (1.5-fold) of purified NADP+ (concentration range: 0–3 µM, n = 16) was included in the assay setup. Net luminescence was calculated for assay samples and NADP+ standard [relative luminescence unit (RLU) of the signal – RLU of the background]. The standard curve was fit by non-linear regression analysis. Interpolation of average net luminescence to the NADP+ standard curve allowed quantification of the formed NADP+ for the determination of the substrate turnover. Assay performance was determined by establishing the Z′, S:B, and percentage of coefficient of variation (% CV).
Fig 5
Fig 5
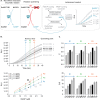
Identification and characterization of MtrMtb inhibitors in high-throughput screening. (A) HTS workflow, in which each step has been color-coded: primary screen (green), hit confirmation (blue), counter screen (purple), hit assessment (turquoise), selectivity assays (yellow), and hit expansion (pink). (B–D) Results from the primary screen, counter screen, and selectivity assay, respectively, surrounded by boxes that are highlighted according to the above-mentioned color code. (B) Assessment of the primary screen by determination of the plate performance as S:B ratio and Z′-factor (top left panel). Plates with a Z′-factor lower than 0.5 were excluded from the analysis. Frequency distribution of inhibition potency of all tested compounds (right panel). The compounds were distributed into bins with a width of 5 (black dots). A Gaussian curve (shown as a green trace) was fitted to describe the mean, standard deviation (σ) and the goodness of fit (R2). Hit map (bottom left panel). The hit count distribution is depicted per well location. Positions marked in gray indicate zero identified hits. The higher number of hits in column 1 (positions indicated in red) likely results from dispensing errors. The potencies of all primary hits were reassessed in the hit confirmation. Control wells in columns 12 and 24 were not included in the analysis. (C) Correlation plot of average potencies of compounds tested in the confirmatory (x-axis) and counter (y-axis) screens. Compounds selected for further studies are highlighted in purple. (D) Potency heat map of compounds tested in the MtrMtb hit confirmation, glutathione reductase (GR) assay, and Mycobacterium xenopi Mtr (MtrMxe) assay. The depicted compounds are color-coded according to their respective activity. White cells indicate that the activity was not determined.

Similar articles

Cited by

References

    1. World Health Organisation . 2022. Global tuberculosis report 2022. Available from: https://www.who.int/publications-detail-redirect/9789240061729
    1. Marais BJ, Hesseling AC, Cotton MF. 2009. Poverty and tuberculosis: is it truly a simple inverse linear correlation Eur Respir J 33:943–944. doi:10.1183/09031936.00173608 - DOI - PubMed
    1. Dean AS, Tosas Auguet O, Glaziou P, Zignol M, Ismail N, Kasaeva T, Floyd K. 2022. 25 years of surveillance of drug-resistant tuberculosis: achievements, challenges, and way forward. Lancet Infect Dis 22:e191–e196. doi:10.1016/S1473-3099(21)00808-2 - DOI - PMC - PubMed
    1. World Health Organisation . 2020. Guidance for the surveillance of drug resistance in tuberculosis. 6th ed. World Health Organization.
    1. Chan J, Xing Y, Magliozzo RS, Bloom BR. 1992. Killing of virulent Mycobacterium tuberculosis by reactive nitrogen intermediates produced by activated murine macrophages. J Exp Med 175:1111–1122. doi:10.1084/jem.175.4.1111 - DOI - PMC - PubMed

LinkOut - more resources