. 2024 Apr 1;223(4):e202305082.
doi: 10.1083/jcb.202305082. Epub 2024 Feb 5.

DNA combing versus DNA spreading and the separation of sister chromatids

Affiliations

DNA combing versus DNA spreading and the separation of sister chromatids

Alice Meroni et al. J Cell Biol. .

Abstract

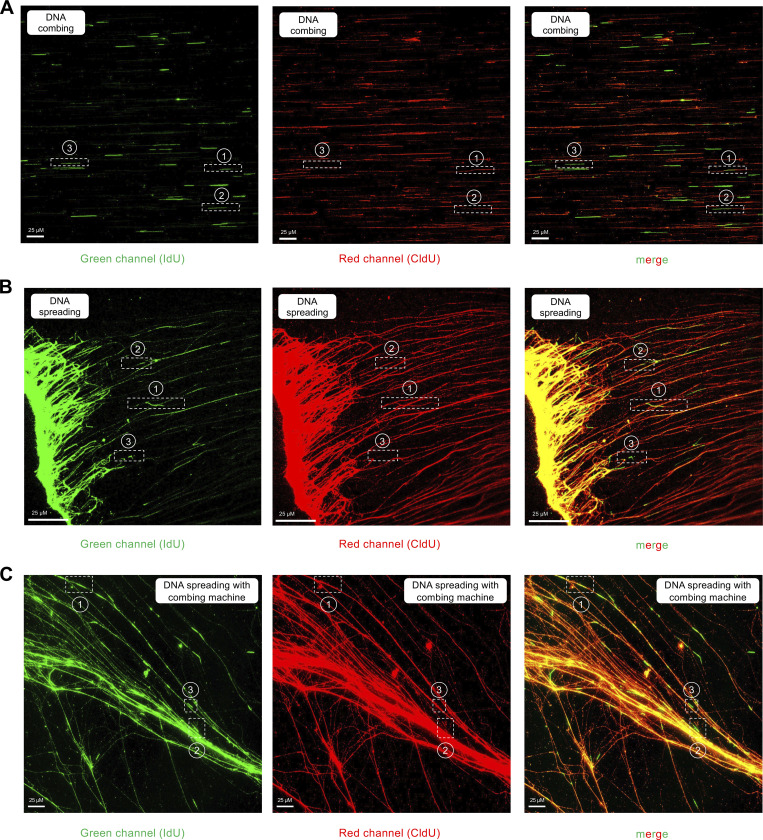
DNA combing and DNA spreading are two central approaches for studying DNA replication fork dynamics genome-wide at single-molecule resolution by distributing labeled genomic DNA on coverslips or slides for immunodetection. Perturbations in DNA replication fork dynamics can differentially affect either leading or lagging strand synthesis, for example, in instances where replication is blocked by a lesion or obstacle on only one of the two strands. Thus, we sought to investigate whether the DNA combing and/or spreading approaches are suitable for resolving adjacent sister chromatids during DNA replication, thereby enabling the detection of DNA replication dynamics within individual nascent strands. To this end, we developed a thymidine labeling scheme that discriminates between these two possibilities. Our data suggests that DNA combing resolves sister chromatids, allowing the detection of strand-specific alterations, whereas DNA spreading typically does not. These findings have important implications when interpreting DNA replication dynamics from data obtained by these two commonly used techniques.


Conflict of interest statement

Disclosures: The authors declare no competing interests exist.

Figures

Figure 1.
Figure 1.
Schematic and model for defining the outcome of sister chromatid alignment versus separation. (A) Use of halogenated thymidine analogs to distinguish between sister chromatids during S phase. RPE-1 and U2OS cells are incubated with 1 µM CldU for 24 h (first round of replication), chased with fresh media for 1 h, and incubated with 200 µM IdU for 30 min (second round of replication). (B) Predicted outcomes for sister chromatid alignment (left) versus separation (right). If sister chromatids remain aligned/adjacent to each other (left), they will result in DNA fibers that are red–green–red if there is no breakage, breakage at a, or breakage at b, and in fibers that are red–green upon breakage at both at a and b. In contrast, if the sister chromatids become separated (right), they will result in DNA fibers that are red–green–red if there is no breakage, red–green upon breakage at a, red–green–red and green only upon breakage at b, and red–green and green only upon breakage at both a and b.
Figure 2.
Figure 2.
Sister chromatids are separated during DNA combing but not spreading. (A) Representative images of DNA fibers obtained with the combing approach. Scale bar is 10 µm. (B–D) DNA combing assay performed as depicted in Fig. 1 A. Green-only versus red–green or red–green–red tracts are scored and represented as percentage of total pulse-labeled tracts. At least 100 tracts were scored for each sample. (B–D) Independent data sets from the Vindigni, Caldecott, and Chaudhuri laboratories, respectively. N indicates the number of biological repeats (N = 3 in B, N = 6 in C, and N = 3 in D). Statistics: mean ± SEM. Numbers indicate the mean tracts %. (E) Representative images of DNA fibers obtained with the spreading approach. Scale bar is 10 µm. (F) DNA spreading assay performed by the Vindigni laboratory as depicted in Fig. 1 A. Green-only versus red–green or red–green–red tracts are scored and represented as percentage of total pulse-labeled tracts. At least 100 tracts were scored for each sample. Number of biological repeats N = 3. Statistics: mean ± SEM. Numbers indicate the mean tracts %. (G) Representative images of DNA fibers obtained with the hybrid approach where the DNA is spread on the coverslips using the combining machine. Scale bar is 10 µm. (H) DNA spreading with combing machine assay performed by the Chaudhuri laboratory as depicted in Fig. 1 A. Green-only versus red–green or red–green–red tracts are scored and represented as percentage of total pulse-labeled tracts. At least 100 tracts were scored for each sample. Number of biological repeats N = 3. Statistics: mean ± SEM.
Figure S1.
Figure S1.
(Related to Fig. 2): Examples of DNA fiber images collected with the DNA combing, spreading, and hybrid spreading techniques. (A) Images collected with DNA combing. The numbers 1, 2, and 3 denote the examples of red–green–red, red–green, and green-only fibers shown in Fig. 2 A. (B) Images collected with DNA spreading. The numbers 1, 2, and 3 denote the examples of red–green–red, red–green, and green-only fibers shown in Fig. 2 E. (C) Images collected with the hybrid spreading technique. The numbers 1, 2, and 3 denote the examples of red–green–red, red–green, and green-only fibers shown in Fig. 2 G. In all cases, when we score red–green–red or red–green fibers, the red signal is continuous and extends through the green tracts, confirming that our labeling originates from two separate replication cycles. The reason why we do not see yellow tracts when the CldU and IdU overlap is that the IdU signal (green) is stronger than the CldU signal (red) due to the different efficiencies of the two antibodies (see also Materials and methods).
Figure S2.
Figure S2.
(Related to Fig. 2): Sister chromatids are separated during DNA combing but not spreading in U2OS cells. (A) DNA combing assay performed by the Vindigni laboratory as depicted in Fig. 1 A. Green-only versus red–green or red–green–red tracts are scored and represented as percentage of total pulse-labeled tracts. At least 100 tracts were scored for each sample. Numbers indicate the mean tracts %. Statistics: mean ± SEM. Number of biological repeats N = 3. (B) DNA spreading assay performed by the Vindigni laboratory as depicted in Fig. 1 A. Green-only versus red–green or red–green–red tracts are scored and represented as percentage of total pulse-labeled tracts. At least 100 tracts were scored for each sample. Numbers indicate the mean tracts %. Statistics: mean ± SEM. Number of biological repeats N = 3.
Figure 3.
Figure 3.
Schematic of the total DNA staining experiment. (A) RPE-1 cells are incubated with IdU for 30 min followed by staining with anti-IdU (green) and anti-DNA antibody (anti-ssDNA, blue) to detect the integrity of the DNA flanking the DNA replication tract. (B) Predicted outcomes for sister chromatid alignment (left) versus separation (right). If sister chromatids remain aligned/adjacent to each other (left), they will result in DNA fibers that are blue–green–blue if there is no breakage, breakage at a, or breakage at b, and in fibers that are blue–green upon breakage at both at a and b. In contrast, if the sister chromatids become separated (right), they will result in DNA fibers that are blue–green–blue if there is no breakage, blue–green–blue and blue–green upon breakage at a or b, and blue–green upon breakage at both a and b.
Figure 4.
Figure 4.
Higher percentages of broken forks are detected by DNA combing compared to spreading, and this difference is reduced by addition of proteinase K to the spreading and hybrid spreading protocols. (A) Representative images of DNA fibers obtained with the combing approach. Scale bar is 10 µm. (B) Blue–green–blue versus blue–green forks scored after combing and presented as a percentage of the total scored pulse-labeled tracts. At least 100 tracts were scored for each sample. Numbers indicate the mean tracts %. Statistics: mean ± SEM. Number of biological repeats N = 3. (C) Representative images of DNA fibers obtained with the spreading approach. Scale bar is 10 µm. (D and E) Blue–green–blue versus blue–green forks scored after spreading and presented as a percentage of the total scored pulse-labeled tracts. At least 100 tracts were scored for each sample. Numbers indicate the mean tracts %. D and E indicate results from the Vindigni and Chaudhuri laboratories, respectively. N indicates the number of biological repeats (N = 3 in D and N = 3 in E). Statistics: mean ± SEM. (F) Representative images of DNA fibers obtained with the hybrid spreading approach. Scale bar is 10 µm. (G) Blue–green–blue versus blue–green forks scored after using a hybrid spreading protocol, where the DNA is extracted following the spreading approach and combed on coverslips. Data are presented as a percentage of the total scored pulse-labeled tracts. At least 100 tracts were scored for each sample. Numbers indicate the mean tracts %. Data are from N = 3 independent experiments. Statistics: mean ± SEM. (H) Blue–green–blue versus blue–green forks scored after addition of proteinase K to hybrid spreading protocol. Data are presented as a percentage of the total scored pulse-labeled tracts. At least 100 tracts were scored for each sample. Numbers indicate the mean tracts %. Statistics: mean ± SEM. Number of biological repeats N = 3.
Figure S3.
Figure S3.
(Related to Fig. 4): Examples of DNA fiber images of the total DNA staining experiments performed the DNA combing, spreading, and hybrid spreading techniques. (A) Images collected with DNA combing. The numbers 1 and 2 denote the examples of blue–green–blue and blue–green fibers shown in Fig. 4 A. (B) Images collected with DNA spreading. The numbers 1 and 2 denote the examples of blue–green–blue and blue–green fibers shown in Fig. 4 A. (C) Images collected with the hybrid spreading technique. The numbers 1 and 2 denote the examples of blue–green–blue and blue–green fibers shown in Fig. 4 F.
Figure S4.
Figure S4.
(Related to Fig. 4): Addition of proteinase K increases the percentages of broken forks detected by spreading. Blue–green–blue versus blue–green forks scored after the addition of proteinase K to the spreading protocol. DNA spreading assay performed by the Chaudhuri laboratory as depicted in Fig. 3 A. Data are presented as a percentage of the total scored pulse-labeled tracts. At least 100 tracts were scored for each sample. Numbers indicate the mean tracts %. Statistics: mean ± SEM. Number of biological repeats N = 3.
Figure 5.
Figure 5.
DNA combing, but not DNA spreading, can detect DNA single-strand gaps within individual sister chromatids. (A) Schematic depicting the use of pulse-labeling and FEN1 inhibitor (FEN1i) to detect single-strand gaps at unligated Okazaki fragments. (B) Dot plots of IdU/CldU ratios in cells treated ± FEN1i and ± S1 nuclease as indicated. Number of biological repeats N = 2. Bars represent the median values. At least 100 tracts were scored for each sample. Statistics: Kruskal–Wallis test. ns, non-significant, *P ≤ 0.05, ****P ≤ 0.0001.

Update of

References

    1. Bai, G., Kermi C., Stoy H., Schiltz C.J., Bacal J., Zaino A.M., Hadden M.K., Eichman B.F., Lopes M., and Cimprich K.A.. 2020. HLTF promotes fork reversal, limiting replication stress resistance and preventing multiple mechanisms of unrestrained DNA synthesis. Mol. Cell. 78:1237–1251.e7. 10.1016/j.molcel.2020.04.031 - DOI - PMC - PubMed
    1. Belan, O., Sebald M., Adamowicz M., Anand R., Vancevska A., Neves J., Grinkevich V., Hewitt G., Segura-Bayona S., Bellelli R., et al. . 2022. POLQ seals post-replicative ssDNA gaps to maintain genome stability in BRCA-deficient cancer cells. Mol. Cell. 82:4664–4680.e9. 10.1016/j.molcel.2022.11.008 - DOI - PubMed
    1. Bensimon, A., Simon A., Chiffaudel A., Croquette V., Heslot F., and Bensimon D.. 1994. Alignment and sensitive detection of DNA by a moving interface. Science. 265:2096–2098. 10.1126/science.7522347 - DOI - PubMed
    1. Bensimon, D., Simon A.J., Croquette V., and Bensimon A.. 1995. Stretching DNA with a receding meniscus: Experiments and models. Phys. Rev. Lett. 74:4754–4757. 10.1103/PhysRevLett.74.4754 - DOI - PubMed
    1. Berti, M., Cortez D., and Lopes M.. 2020. The plasticity of DNA replication forks in response to clinically relevant genotoxic stress. Nat. Rev. Mol. Cell Biol. 21:633–651. 10.1038/s41580-020-0257-5 - DOI - PubMed

Publication types