Impaired Control (Both Attempts to Control Drinking and Failed Control) as Prospective Predictors of Negative Outcomes Among Young Adults Who Drink Heavily
- PMID: 38315139
- PMCID: PMC11289869
- DOI: 10.15288/jsad.22-00362
Impaired Control (Both Attempts to Control Drinking and Failed Control) as Prospective Predictors of Negative Outcomes Among Young Adults Who Drink Heavily
Abstract
Objective: Impaired control over alcohol is a hallmark of addiction relevant to young adults, but additional prospective findings are needed, particularly in samples reporting heavy drinking. Further, we lack understanding of how attempts and failed efforts to control drinking relate to each other in predicting outcomes. We hypothesized that attempted and failed control would prospectively predict outcomes, with endorsement of both being especially problematic.
Method: We used data from young adults reporting heavy drinking who enrolled in laboratory alcohol self-administration studies (n = 109). Mixed-effects models were used to predict drinks per drinking day, heavy drinking, and negative consequences across baseline and 6- and 12-month follow-ups. Interactions by time and between attempted and failed control were tested.
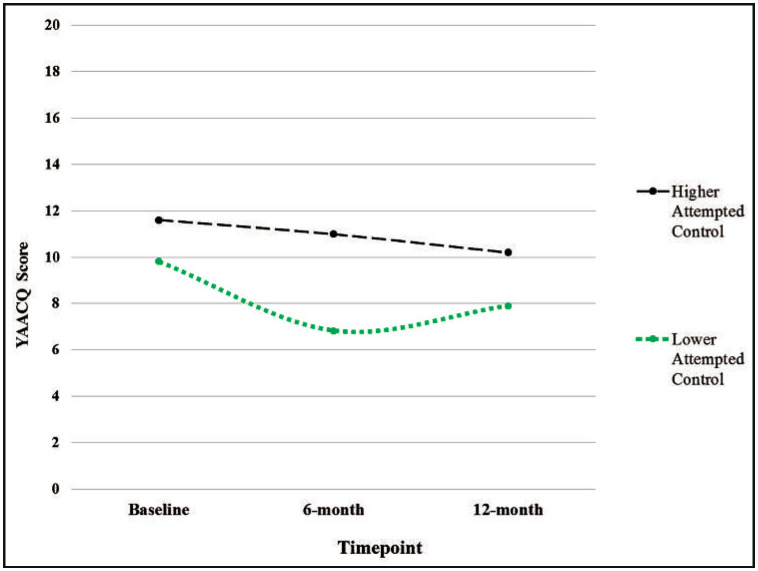
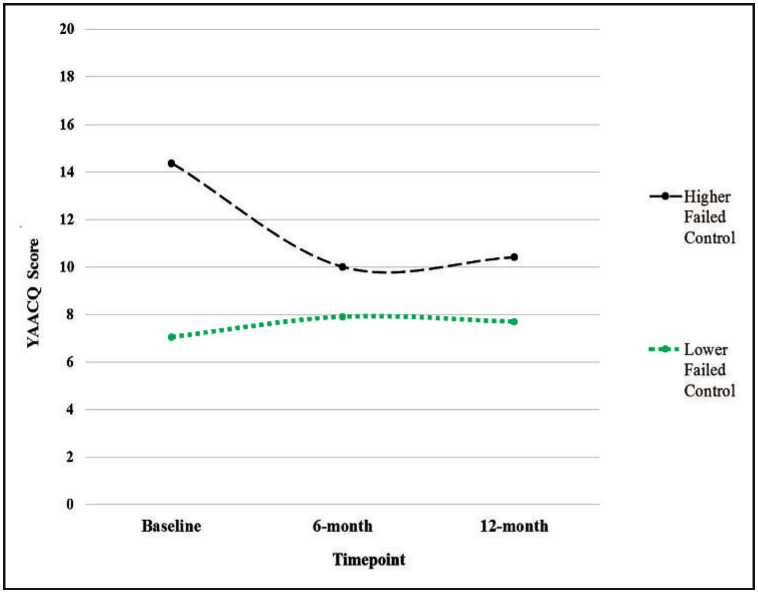
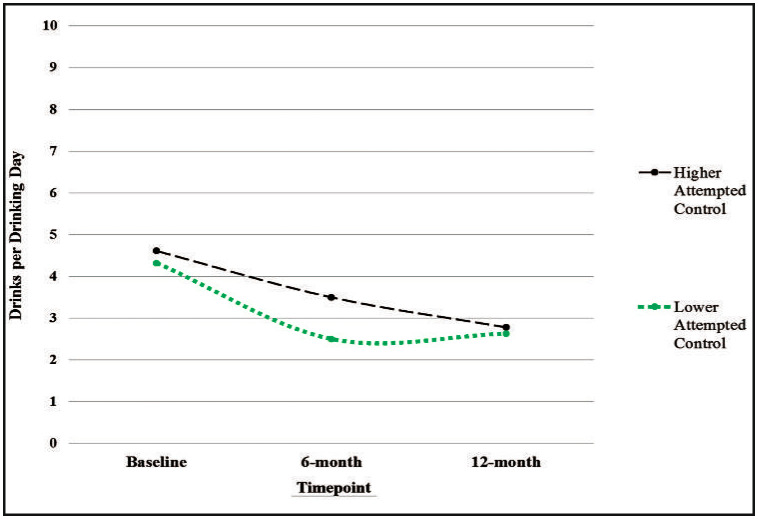
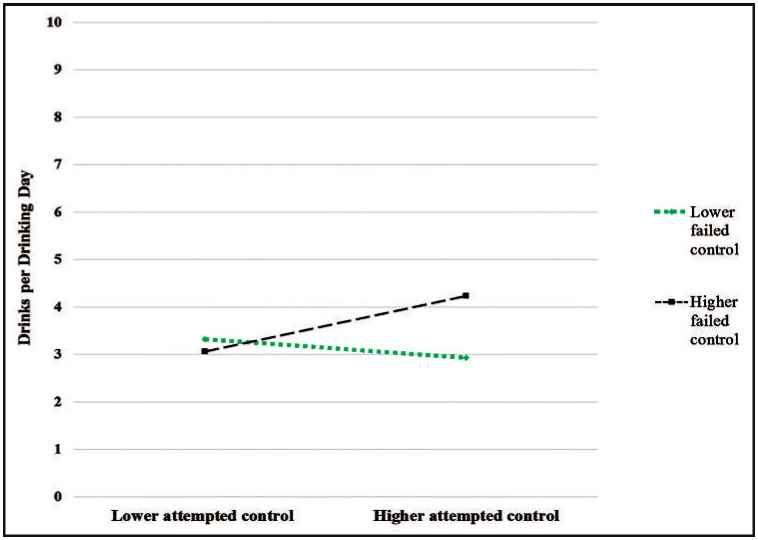
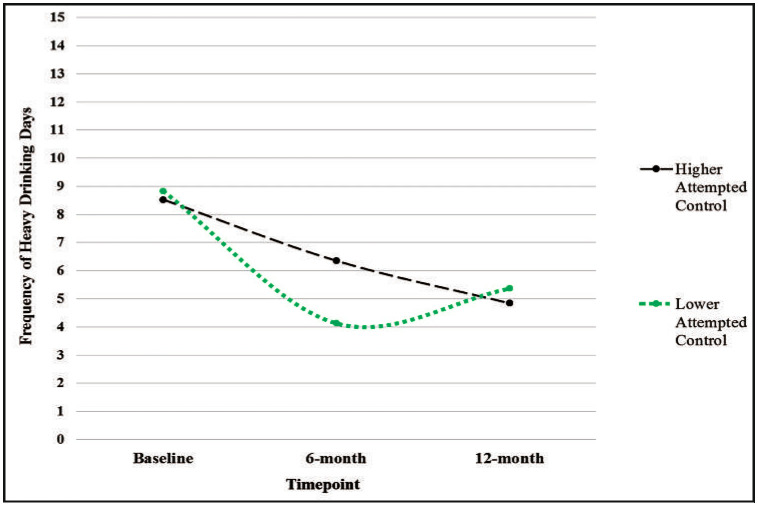
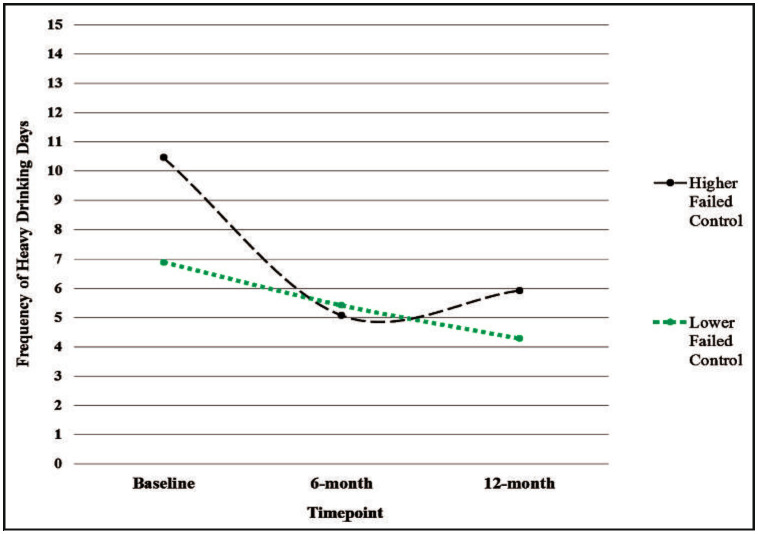
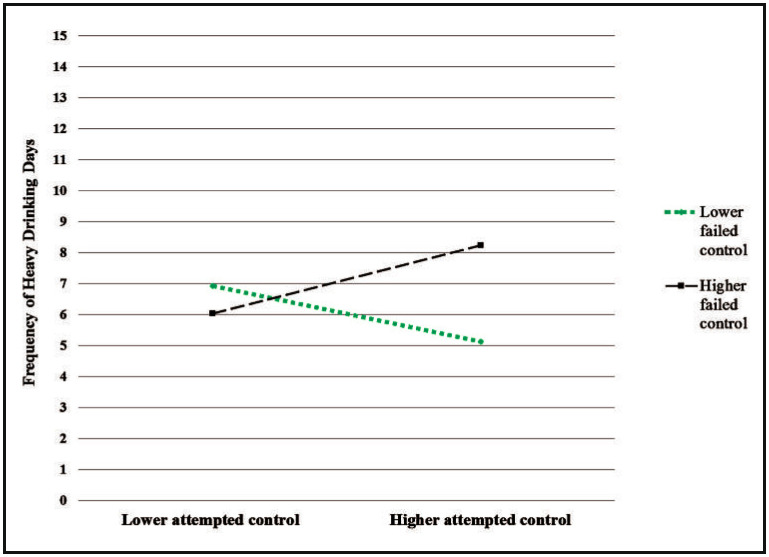
Results: Higher failed control was associated with steeper declines in consequences and heavy drinking over time compared with lower failed control. However, higher attempted or failed control was still associated with more consequences and alcohol use than lower impaired control at multiple time points. A significant interaction indicated that the combination of higher attempted and failed control was associated with the most drinks per drinking day. There was also a significant Attempted × Failed Control interaction for heavy drinking.
Conclusions: These findings provide further evidence supporting impaired control over alcohol use as a risk factor among young adults. Those reporting both higher attempted and failed control drank the most per day. Either attempted or failed control was associated with negative consequences. Those reporting both higher attempted and failed control may be in greatest need of intensive intervention.
Figures
Similar articles
-
Home treatment for mental health problems: a systematic review.Health Technol Assess. 2001;5(15):1-139. doi: 10.3310/hta5150. Health Technol Assess. 2001. PMID: 11532236
-
Maternal and neonatal outcomes of elective induction of labor.Evid Rep Technol Assess (Full Rep). 2009 Mar;(176):1-257. Evid Rep Technol Assess (Full Rep). 2009. PMID: 19408970 Free PMC article.
-
Personalised digital interventions for reducing hazardous and harmful alcohol consumption in community-dwelling populations.Cochrane Database Syst Rev. 2017 Sep 25;9(9):CD011479. doi: 10.1002/14651858.CD011479.pub2. Cochrane Database Syst Rev. 2017. PMID: 28944453 Free PMC article.
-
Adefovir dipivoxil and pegylated interferon alfa-2a for the treatment of chronic hepatitis B: a systematic review and economic evaluation.Health Technol Assess. 2006 Aug;10(28):iii-iv, xi-xiv, 1-183. doi: 10.3310/hta10280. Health Technol Assess. 2006. PMID: 16904047
-
A rapid and systematic review of the clinical effectiveness and cost-effectiveness of paclitaxel, docetaxel, gemcitabine and vinorelbine in non-small-cell lung cancer.Health Technol Assess. 2001;5(32):1-195. doi: 10.3310/hta5320. Health Technol Assess. 2001. PMID: 12065068
References
-
- Aiken L. S., West S. G. Thousand Oaks, CA: Sage; 1991. Multiple regression: Testing and interpreting interactions.
-
- American Psychiatric Association . (4th ed.). Washington, DC: Author; 1994. Diagnostic and statistical manual of mental disorders.
-
- American Psychiatric Association . (5th ed.). Arlington, VA: Author; 2013. Diagnostic and statistical manual of mental disorders.
MeSH terms
Grants and funding
LinkOut - more resources
Full Text Sources
Medical