. 2024 Feb;10(2):001187.
doi: 10.1099/mgen.0.001187.

Compensatory mutations are associated with increased in vitro growth in resistant clinical samples of Mycobacterium tuberculosis

Affiliations

Compensatory mutations are associated with increased in vitro growth in resistant clinical samples of Mycobacterium tuberculosis

Viktoria M Brunner et al. Microb Genom. 2024 Feb.

Abstract

Mutations in Mycobacterium tuberculosis associated with resistance to antibiotics often come with a fitness cost for the bacteria. Resistance to the first-line drug rifampicin leads to lower competitive fitness of M. tuberculosis populations when compared to susceptible populations. This fitness cost, introduced by resistance mutations in the RNA polymerase, can be alleviated by compensatory mutations (CMs) in other regions of the affected protein. CMs are of particular interest clinically since they could lock in resistance mutations, encouraging the spread of resistant strains worldwide. Here, we report the statistical inference of a comprehensive set of CMs in the RNA polymerase of M. tuberculosis, using over 70 000 M. tuberculosis genomes that were collated as part of the CRyPTIC project. The unprecedented size of this data set gave the statistical tests more power to investigate the association of putative CMs with resistance-conferring mutations. Overall, we propose 51 high-confidence CMs by means of statistical association testing and suggest hypotheses for how they exert their compensatory mechanism by mapping them onto the protein structure. In addition, we were able to show an association of CMs with higher in vitro growth densities, and hence presumably with higher fitness, in resistant samples in the more virulent M. tuberculosis lineage 2. Our results suggest the association of CM presence with significantly higher in vitro growth than for wild-type samples, although this association is confounded with lineage and sub-lineage affiliation. Our findings emphasize the integral role of CMs and lineage affiliation in resistance spread and increases the urgency of antibiotic stewardship, which implies accurate, cheap and widely accessible diagnostics for M. tuberculosis infections to not only improve patient outcomes but also prevent the spread of resistant strains.

Keywords: antimicrobial resistance; compensatory mutations; fitness cost; tuberculosis.


Conflict of interest statement

The authors declare that there are no conflicts of interest.

Figures

Fig. 1.
Fig. 1.
The drug rifampicin (RIF) interrupts RNA synthesis by binding to the β subunit of the RNA polymerase (RNAP) [14]. (a) Overview of the entire RNAP. The β subunit of the RNAP is shown in magenta, the β′ subunit in yellow, the two α subunits in light blue and green, the ω subunit in white and the σ factor in light orange. The active site is framed in black. It can be seen through the secondary channel, with the active site magnesium depicted in green and the drug RIF in white. (b) Close-up of the active site. The DNA strand used as a template for transcription is shown on the right in orange and dark blue. The β subunit of the RNAP is shown in magenta, with the rifampicin resistance-determining region (RRDR) highlighted in dark blue. The protruding amino acids D435, H445 and S450 are reported to form hydrogen bonds or van der Waals interactions with the drug RIF [14]. Due to the proximity of the RRDR to the RNAP active centre, the binding of RIF causes a disruption of the RNA synthesis through steric clash.
Fig. 2.
Fig. 2.
Presence of rifampicin (RIF) resistance-conferring mutations in the RNA polymerase (RNAP) of M. tuberculosis is associated with lower median growth compared to pan-susceptible samples. (a) Distributions of growth in percentage of covered well area as measured in the CRyPTIC project [33] were plotted as a histogram against the proportion of samples that display this amount of growth (bottom) and as a notched box plot reflecting the distribution quantiles (top). Samples with RIF resistance mutations but no other potentially interfering mutations are plotted in red and samples classified as pan-susceptible are plotted in green. For the box plot, half of the data lie within the area of the box and 95 % in the area covered by the whiskers. Outliers (5 % of the data) were removed to achieve a cleaner representation. Indented areas close to the medians indicate their respective confidence intervals, while the asterisk (*) indicates a significant Bonferroni-corrected Mann–Whitney P-value (P<0.05/10 %). The respective medians, confidence intervals and the Mann–Whitney P-value are listed in Table 1. (b) Plot structure equivalent to the box plot in (a), but the red bars represent subsets of RIF-resistant samples that exhibit only the resistance mutation indicated to their left and no other potentially interfering mutations. The medians, their confidence intervals (CIs) and Mann–Whitney P-values of the distributions are listed in Table 1. For a histogram representation of the data please refer to Fig. S1, available in the online version of this article.
Fig. 3.
Fig. 3.
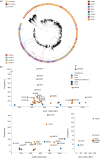
Putative CMs are distributed widely across the phylogenetic tree and the RNA polymerase genes (a) Phylogenetic tree assembled from single-nuceotide polymorphism (SNP)-distances of about 15,000 samples. The resistance level of the samples is indicated on the outermost ring, while the second ring indicates the lineage. The most common CMs (all on rpoC) were mapped on the innermost ring, with the trapezoids indicating clades within lineage 2 that show a cluster of a specific CM (I491V, blue trapezoid; V483A, red trapezoid). (b) The putative CMs were mapped according to their position in the respective gene and their frequency of co-occurrence with resistance. There were five hits on the σ factor that are not shown, as well as one hit on the rpoZ gene (Table S3). All of these do not show homoplasy. E1092D is outside of the plotting range due to its high frequency (1989 observations).
Fig. 4.
Fig. 4.
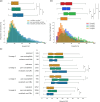
Presence of compensatory mutations (CMs) in samples with rifampicin (RIF) resistance-conferring mutations in the RNA polymerase of M. tuberculosis is associated with higher growth densities in some lineages. (a) Distributions of growth in percentage of covered well-area as measured in the CRyPTIC project [33] were plotted as a histogram against the proportion of samples that display this amount of growth (bottom) and as a notched box plot reflecting the distribution quantiles (top). Samples with RIF resistance mutations but no putative CMs are plotted in red and samples classified as pan-susceptible are plotted in green. Samples that have RIF resistance mutations and at least one CM are shown in blue. For the box plot, half of the data lie within the area of the box and 95 % in the area covered by the whiskers. Outliers (5 % of the data) were removed to achieve a cleaner representation. Indented areas close to the medians indicate their respective confidence interval, while the asterisk (*) indicates a significant Bonferroni-corrected Mann–Whitney P-value (P<0.05/3 %). The respective medians, confidence intervals and the Mann–Whitney P-values are listed in Table S4. (b) Plot structure equivalent to the box plot in (a), but the bars represent pan-susceptible samples from different lineages, plotted in the respective colours indicated in the legend. The asterisk (*) indicates a significant Bonferroni-corrected Mann–Whitney P-value (P<0.05/6 %). The respective medians, confidence intervals and the Mann–Whitney P-value are listed in Table S5. (c) Plot structure equivalent to the box plot in (a), but the box plots represent subsets of samples that belong to the lineage displayed on the left. The sample size is shown in the column marked with n. For a histogram representation of the same data refer to Fig. S4. The asterisk (*) indicates a significant Bonferroni-corrected Mann–Whitney P-value (P<0.05/3 %). The respective medians, confidence intervals and the Mann–Whitney P-values are listed in Table S6.
Fig. 5.
Fig. 5.
M. tuberculosis clades with clusters of compensatory mutations (CMs) explain some of the high growth densities associated with CMs in lineage 2. (a) Growth distributions (percentage of covered well area) in lineage 2 were plotted as a histogram against the proportion of samples that display this amount of growth (bottom) and as a notched box plot reflecting the distribution quantiles (top). Lineage 2 samples were classified as pan-susceptible (green), RIF resistant (red), resistant and showing the CM I491V outside of the CM cluster clade (blue) and as part of the lineage 2 clade, where all samples show the CM I491V (dark red). For the box plot, half of the data lie within the area of the box and 95 % in the area covered by the whiskers. Outliers (5 % of the data) were removed to achieve a cleaner representation. Indented areas close to the medians indicate their respective confidence interval, while the asterisk (*) indicates a significant Bonferroni-corrected Mann–Whitney P-value (P<0.05/6 %). The respective medians, confidence intervals and the Mann–Whitney P-values are listed in Table 2. (b) Plot structure equivalent to the box plot in (a), but the CM in question is V483A. Distribution medians and their confidence intervals are shown in Table 2.
Fig. 6.
Fig. 6.
Compensatory mutations (CMs) map to various subunits of the RNA polymerase (RNAP). (a) Overview of clustering regions for CMs. Letters indicate where the CM clustering regions are located. (b) The interaction region of subunits α (black), β (dark grey) and β′ (light grey). CMs can be found in all these subunits and are highlighted in colour (β subunit, magenta; β′ subunit, yellow; α subunit, light blue, stick representation). (c) CMs close to the rifampicin resistance-determining region (RRDR) on the β and β′ subunits. Rifampicin (RIF, light blue) is shown bound to the RRDR. The DNA strand is visible on the top left in dark blue and orange stick representation. The active centre magnesium ion is shown in green. CMs are highlighted in colour (β subunit, magenta and β′ subunit, yellow) and by stick representation. (d) CMs close to the RNAP secondary channel in the β′ subunit (light grey) are shown in yellow. The location of the active site inside the protein can be deduced through the active site magnesium ion, indicated in green. (e) CMs close to the DNA entry channel are shown in yellow. The DNA helix is shown in dark blue and orange stick representation. (f) Close-up of the location of a putative CM (yellow stick representation, CM mutates proline to arginine) close to the DNA backbone. This CM might change interactions of the RNAP with the DNA strand.

Similar articles

Cited by

References

    1. Ladner J, The CRyPTIC Consortium A data compendium associating the genomes of 12,289 Mycobacterium tuberculosis isolates with quantitative resistance phenotypes to 13 antibiotics. PLoS Biol. 2022;20:e3001721. doi: 10.1371/journal.pbio.3001721. - DOI - PMC - PubMed
    1. Brunner V, Fowler PW. Accompanying code to reproduce analysis and figures. https://github.com/fowler-lab/tb-rnap-compensation n.d.
    1. Ikuta KS, Swetschinski LR, Robles Aguilar G, Sharara F, Mestrovic T. Global mortality associated with 33 bacterial pathogens in 2019: a systematic analysis for the Global Burden of Disease Study 2019. Lancet. 2022;400:2221–2248. doi: 10.1016/S0140-6736(22)02185-7. - DOI - PMC - PubMed
    1. Smith PA, Romesberg FE. Combating bacteria and drug resistance by inhibiting mechanisms of persistence and adaptation. Nat Chem Biol. 2007;3:549–556. doi: 10.1038/nchembio.2007.27. - DOI - PubMed
    1. Nikaido H. Multidrug resistance in bacteria. Annu Rev Biochem. 2009;78:119–146. doi: 10.1146/annurev.biochem.78.082907.145923. - DOI - PMC - PubMed