. 2024 Feb 1;65(2):10.
doi: 10.1167/iovs.65.2.10.

m6A-Mediated Upregulation of Imprinted in Prader-Willi Syndrome Induces Aberrant Apical-Basal Polarization and Oxidative Damage in RPE Cells

Affiliations

m6A-Mediated Upregulation of Imprinted in Prader-Willi Syndrome Induces Aberrant Apical-Basal Polarization and Oxidative Damage in RPE Cells

Ying Wang et al. Invest Ophthalmol Vis Sci. .

Abstract

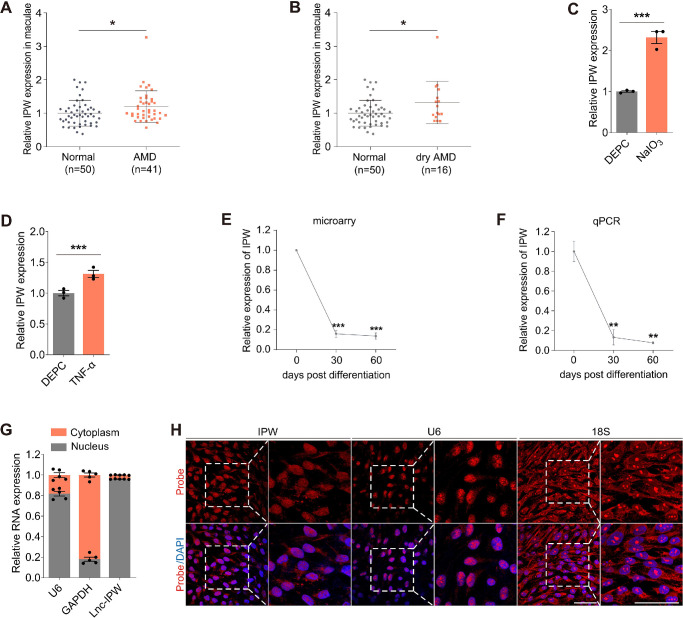
Purpose: To reveal the clinical significance, pathological involvement and molecular mechanism of imprinted in Prader-Willi syndrome (IPW) in RPE anomalies that contribute to AMD.

Methods: IPW expression under pathological conditions were detected by microarrays and qPCR assays. In vitro cultured fetal RPE cells were used to study the pathogenicity induced by IPW overexpression and to analyze its upstream and downstream regulatory networks.

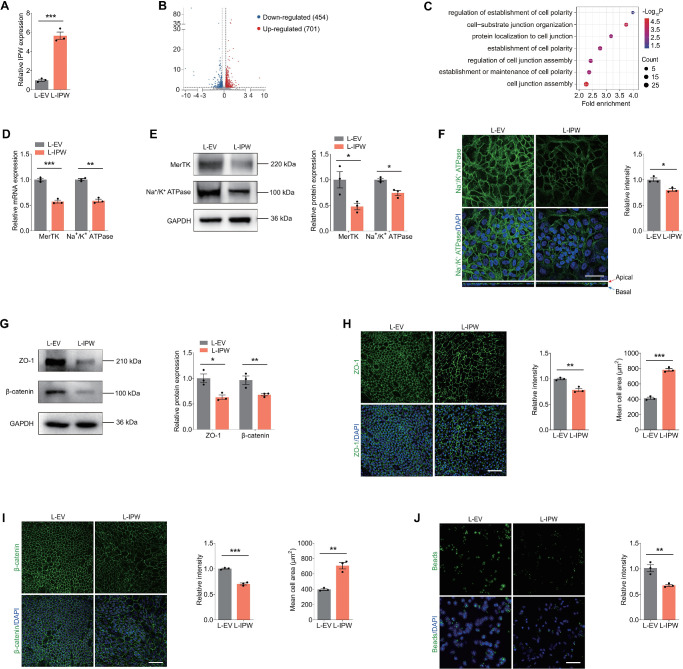
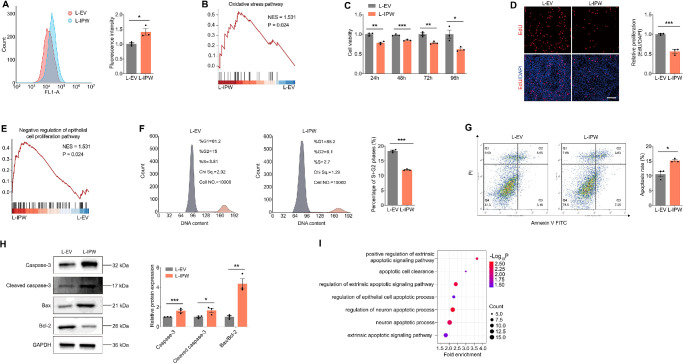
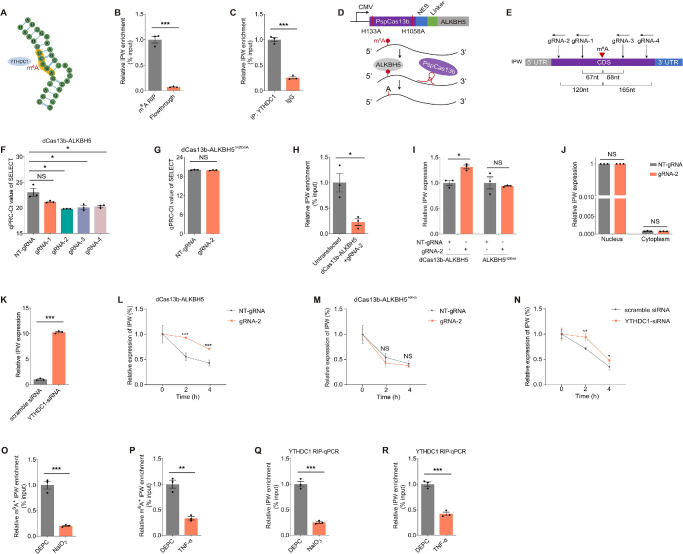
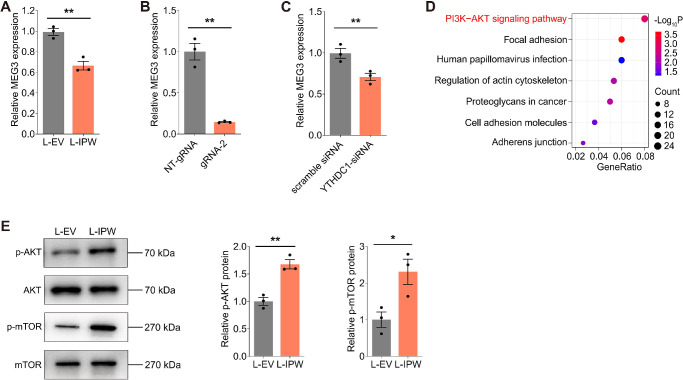
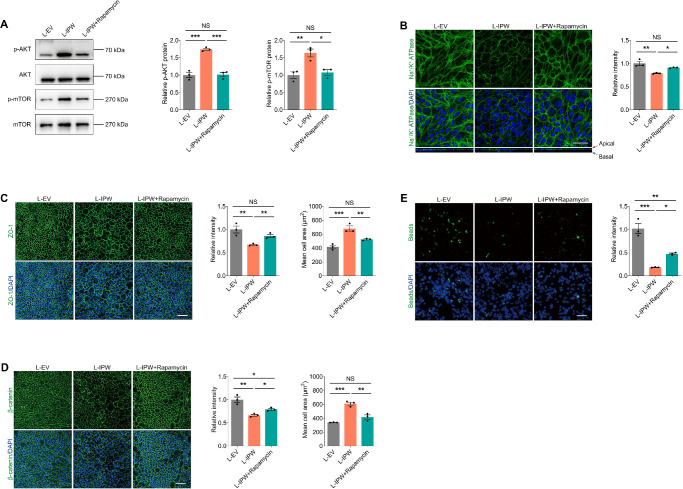
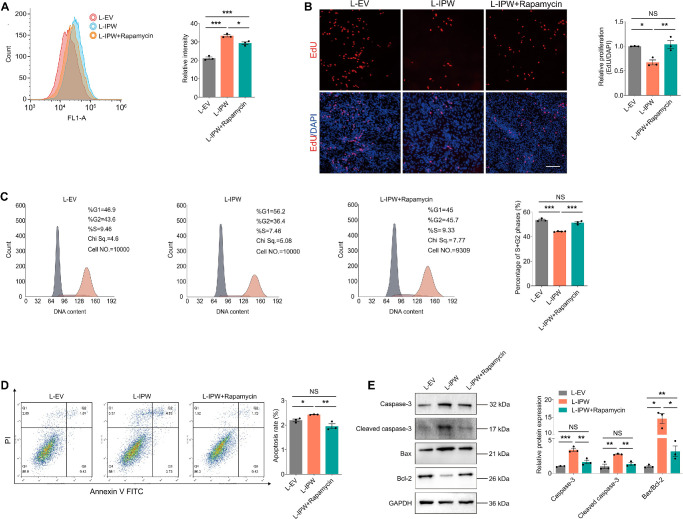
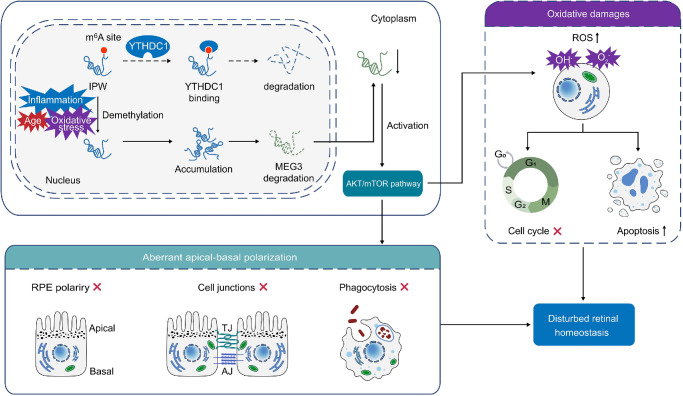
Results: We showed that IPW is upregulated in the macular RPE-choroid tissue of dry AMD patients and in fetal RPE cells under oxidative stress, inflammation and dedifferentiation. IPW overexpression in fetal RPE cells induced aberrant apical-basal polarization as shown by dysregulated polarized markers, disrupted tight and adherens junctions, and inhibited phagocytosis. IPW upregulation was also associated with RPE oxidative damages, as demonstrated by intracellular accumulation of reactive oxygen species, reduced cell proliferation, and accelerated cell apoptosis. Mechanically, N6-methyladenosine level of the IPW transcript regulated its stability with YTHDC1 as the reader. IPW mediated RPE features by suppressing MEG3 expression to sequester its inhibition on the AKT serine-threonine kinase (AKT)/mammalian target of rapamycin (mTOR) pathway. We also noticed that the mTOR inhibitor rapamycin suppresses the AKT/mTOR pathway to alleviate the IPW-induced RPE anomalies.

Conclusions: We revealed that IPW overexpression in RPE induces aberrant apical-basal polarization and oxidative damages, thus contributing to AMD progression. We also annotated the upstream and downstream regulatory networks of IPW in RPE. Our findings shed new light on the molecular mechanisms of RPE dysfunctions, and indicate that IPW blockers may be a promising option to treat RPE abnormalities in AMD.


Conflict of interest statement

Disclosure: Y. Wang, None; Y.-R. Zhang, None; Z.-Q. Ding, None; Y.-C. Zhang, None; R.-X. Sun, None; H.-J. Zhu, None; J.-N. Wang, None; B. Xu, None; P. Zhang, None; J.-D. Ji, None; Q.-H. Liu, None; X. Chen, None

Figures

Figure 1.
Figure 1.
Characteristics and roles of IPW in AMD. (A, B) IPW expression detected by microarray in macular RPE-choroid complex of patients with AMD (A; n = 41) or dry AMD (B; n = 16) and age-matched controls without retinopathy (n = 50). Data was obtained from GSE29801. (C, D) IPW expression detected by qPCR in RPE cells treated with NaIO3 (C; n = 3 per group) or TNF-α (D; n = 3 per group) compared with the control group. (E, F) IPW expression detected by microarray (E; n = 3 per group) and qPCR (F; n = 3 per group) in hiPSCs and hiPSC-induced RPE cells at 30 and 60 days after differentiation. (G, H) Subcellular distribution of U6, glyceraldehyde-3-phosphate dehydrogenase (GAPDH), and IPW in fRPE cells demonstrated by qPCR (G; n = 5 per group) and FISH assay (H). Data are presented as mean ± SEM. Two-tailed Student t test was used. *P < 0.05, **P < 0.01, and ***P < 0.001.
Figure 2.
Figure 2.
IPW overexpression in RPE induces aberrant apical–basal polarization. (A) IPW expression detected by qPCR in fRPE cells transduced with L-IPW compared with cells transduced with L-EV (n = 3 per group). (B) Volcano diagram of RNA-seq data from fRPE cells transduced with L-IPW compared with cells transduced with L-EV (log2 fold-change >0.25 or <−0.25; P < 0.05). (C) GO plot of enriched cell polarization-related biological processes in fRPE cells overexpressing IPW. (D, E) Expression of MerTK and Na+/K+ ATPase detected by qPCR (D; n = 3 per group) and immunoblotting (E; n = 3 per group) in fRPE transduced with L-EV or L-IPW. (F) Immunofluorescence staining of Na+/K+ ATPase in fRPE cells transduced with L-EV or L-IPW (n = 3 per group). Scale bar, 50 µm. (G) Immunoblotting of ZO-1 and β-catenin in fRPE cells transduced with L-EV or L-IPW (n = 3 per group). (H, I) Immunofluorescence staining of ZO-1 (H; n = 3 per group) and β-catenin (I; n = 3 per group) in fRPE cells transduced with indicated lentivirus. Scale bar, 60 µm. (J) Fluorescence of intracellular latex beads in fRPE cells transduced with indicated lentivirus (n = 3 per group). Scale bar, 60 µm. Data are presented as mean ± SEM. Two-tailed Student t test was used. *P < 0.05, ** P < 0.01, and *** P < 0.001.
Figure 3.
Figure 3.
IPW overexpression in RPE cells induces oxidative damage. (A) ROS levels detected by flow cytometric analyses in fRPE cells transduced with L-EV or L-IPW (n = 3 per group). (B) Gene set enrichment analysis (GSEA) plot of oxidative stress pathway in fRPE cells overexpressing IPW. (C) Cell viability detected by CCK8 assay in fRPE cells transduced with indicated lentivirus (n = 3 per group). (D) Cell proliferation assessed by EdU assay in fRPE cells transduced with L-EV or L-IPW (n = 3 per group). Cell nuclei are counterstained with DAPI. Scale bar, 60 µm. (E) GSEA plot shows negative regulation of epithelial cell proliferation pathway in fRPE cells overexpressing IPW. (F) Cell cycle progression detected by flow cytometric analyses in fRPE cells transduced with indicated lentivirus (n = 3 per group). Grey area (left) indicates for G1 phase; purple area (middle) indicates for S phase; orange area (right) indicates for G2 phase. (G) Apoptosis detected by flow cytometric analyses in fRPE cells transduced with L-EV or L-IPW (n = 3 per group). (H) Immunoblotting of caspase-3, cleaved caspase-3, Bax/Bcl-2 in fRPE cells transduced with indicated lentivirus (n = 3 per group). (I) GO plot of enriched apoptosis-related pathways in fRPE cells overexpressing IPW. Data are presented as mean ± SEM. Two-tailed Student t test was used. * P < 0.05, **P < 0.01, and *** P < 0.001.
Figure 4.
Figure 4.
YTHDC1 directly binds to m6A sites on IPW to regulate its stability. (A) A schematic diagram demonstrating the m6A site on the IPW transcript and its interaction with YTHDC1. (B) The direct binding between the m6A antibody and m6A_site_139960 detected by MeRIP-qPCR assay in fRPE cells (n = 3 per group). (C) The binding between IPW and YTHDC1 verified by RIP-qPCR assay in fRPE cells (n = 3 per group). (D) A schematic diagram demonstrating the structure and functions of the dCas13b-ALKBH5 plasmid. (E) A schematic diagram showing specific locations of the four gRNAs (gRNA-1, gRNA-2, gRNA-3, gRNA-4) targeting m6A_site_139960 in the IPW transcript. (F) The m6A level of m6A_site_139960 detected by SELECT qPCR in fRPE cells transfected with distinct gRNAs compared with cells transfected with NT-gRNA (n = 3 per group). (G) The m6A level of m6A_site_139960 detected by SELECT qPCR in fRPE cells cotransfected with the dCas13b-ALKBH5H204A plasmid and NT-gRNA/gRNA-2 (n = 3 per group). (H) The binding between IPW and YTHDC1 detected by RIP-qPCR assay in fRPE cells cotransfected with the dCas13b-ALKBH5 plasmid and gRNA-2 (n = 3 per group). (I) IPW expression detected by qPCR in fRPE cells cotransfected with the dCas13b-ALKBH5/dCas13b-ALKBH5H204A plasmid and NT-gRNA/gRNA-2 (n = 3 per group). (J) Intracellular distribution of IPW detected by qPCR in fRPE cells cotransfected with the dCas13b-ALKBH5 plasmid and NT-gRNA/gRNA-2 (n = 3 per group). (K) IPW expression detected by qPCR in fRPE cells transfected with scramble siRNA and YTHDC1-siRNA (n = 3 per group). (L, M) Half-life of the IPW transcript detected by qPCR in fRPE cells cotransfected with dCas13b-ALKBH5 and NT-gRNA/gRNA-2 (L; n = 3 per group) and in cells cotransfected with dCas13b-ALKBH5H204A and NT-gRNA/gRNA-2 (M; n = 3 per group). (N) The stability of IPW detected by qPCR in fRPE cells transfected with scramble siRNA or YTHDC1-siRNA (n = 3 per group). (O, P) M6A level of m6A_site_139960 detected by MeRIP-qPCR in fRPE cells treated with DEPC or NaIO3 (O; n = 3 per group) or TNF-α (P; n = 3 per group). (Q, R) The binding between IPW and YTHDC1 detected by RIP-qPCR in fRPE cells treated with DEPC or NaIO3 (Q; n = 3 per group) or TNF-α (R; n = 3 per group). Data are presented as mean ± SEM. Two-tailed Student t test was used. NS, not significant (p > 0.05), * P < 0.05, ** P < 0.01, and *** P < 0.001.
Figure 5.
Figure 5.
IPW inhibits MEG3 to activate the AKT/mTOR pathway in RPE cells. (A) MEG3 expression detected by qPCR in fRPE cells transduced with L-IPW compared with cells transduced with L-EV (n = 3 per group). (B) MEG3 expression detected by qPCR in fRPE cells cotransfected with the dCas13b-ALKBH5 plasmid and NT-gRNA/gRNA-2 (n = 3 per group). (C) MEG3 expression detected by qPCR in fRPE cells transfected with scramble siRNA or YTHDC1-siRNA (n = 3 per group). (D) Kyoto Encyclopedia of Genes and Genomes (KEGG) plot of enriched pathways in fRPE cells transduced with L-IPW compared with cells transduced with L-EV. (E) Immunoblotting of p-AKT, AKT, p-mTOR, and mTOR in fRPE cells transduced with L-EV or L-IPW (n = 3 per group). Data are presented as mean ± SEM. Two-tailed Student t test was used. * P < 0.05 and ** P < 0.01.
Figure 6.
Figure 6.
Rapamycin suppresses the AKT/mTOR pathway to alleviate the IPW-induced aberrant apical–basal polarization. (A) Immunoblotting of p-AKT, AKT, p-mTOR and mTOR in fRPE cells transduced with L-EV or L-IPW and treated with or without rapamycin (n = 3 per group). (B) Immunofluorescence staining of Na+/K+ ATPase in fRPE cells receiving indicated treatments (n = 3 per group). Scale bar, 50 µm. (C, D) Immunofluorescence staining of ZO-1 (C; n = 3 per group) and β-catenin (D; n = 3 per group) in fRPE cells receiving distinct treatments. Scale bar, 60 µm. (E) Fluorescence of intracellular latex beads in fRPE cells transduced with L-EV or L-IPW and treated with or without rapamycin (n = 3 per group). Scale bar, 60 µm. Data are presented as mean ± SEM. One-way ANOVA coupled with the Bonferroni's post hoc test was used. NS, not significant (P > 0.05), * P < 0.05, ** P < 0.01, and *** P < 0.001.
Figure 7.
Figure 7.
Rapamycin suppresses the AKT/mTOR pathway to alleviate the IPW-induced oxidative damage. (A) ROS accumulation detected by flow cytometric analyses in fRPE cells receiving indicated treatments (n = 3 per group). (B) Cell proliferation detected by EdU assay in fRPE cells receiving distinct treatments (n = 3 per group). Cell nuclei are counterstained with DAPI. Scale bar, 60 µm. (C) Cell cycle progression detected by flow cytometric analyses in fRPE cells transduced with L-EV or L-IPW and treated with or without rapamycin (n = 3 or 4 per group). Grey area (left) indicates for G1 phase; purple area (middle) indicates for S phase; orange area (right) indicates for G2 phase. (D) Apoptosis detected by flow cytometric analyses in fRPE cells receiving indicated treatments (n = 3 per group). (E) Immunoblotting of caspase-3, cleaved caspase-3, Bax/Bcl-2 in fRPE cells receiving distinct treatments (n = 3 per group). Data are presented as mean ± SEM. One-way ANOVA coupled with the Bonferroni's post hoc test was used. NS, not significant (P > 0.05), * P < 0.05, ** P < 0.01, *** P < 0.001.
Figure 8.
Figure 8.
Schematic diagram of IPW-mediated effects on the RPE. Under pathogenic conditions, m6A levels in the IPW transcript are reduced, thus disturbing its degradation with YTHDC1 as a reader. IPW induces aberrant apical–basal polarization and oxidative damages in RPE cells by targeting MEG3-mediated activation of the AKT/mTOR pathway.

Similar articles

Cited by

References

    1. Bressler NM. Age-related macular degeneration is the leading cause of blindness. JAMA. 2004; 291(15): 1900–1901. - PubMed
    1. Jager RD, Mieler WF, Miller JW.. Age-related macular degeneration. N Engl J Med. 2008; 358(24): 2606–2617. - PubMed
    1. Lim LS, Mitchell P, Seddon JM, Holz FG, Wong TY.. Age-related macular degeneration. Lancet. 2012; 379(9827): 1728–1738. - PubMed
    1. Strauss O. The retinal pigment epithelium in visual function. Physiol Rev. 2005; 85(3): 845–881. - PubMed
    1. Datta S, Cano M, Ebrahimi K, Wang L, Handa JT. The impact of oxidative stress and inflammation on RPE degeneration in non-neovascular AMD. Prog Retin Eye Res. 2017; 60: 201–218. - PMC - PubMed

MeSH terms