. 2024 Feb 5;20(2):e1011138.
doi: 10.1371/journal.pgen.1011138. eCollection 2024 Feb.

CRISPR screen for protein inclusion formation uncovers a role for SRRD in the regulation of intermediate filament dynamics and aggresome assembly

Affiliations

CRISPR screen for protein inclusion formation uncovers a role for SRRD in the regulation of intermediate filament dynamics and aggresome assembly

Katelyn M Sweeney et al. PLoS Genet. .

Abstract

The presence of large protein inclusions is a hallmark of neurodegeneration, and yet the precise molecular factors that contribute to their formation remain poorly understood. Screens using aggregation-prone proteins have commonly relied on downstream toxicity as a readout rather than the direct formation of aggregates. Here, we combined a genome-wide CRISPR knockout screen with Pulse Shape Analysis, a FACS-based method for inclusion detection, to identify direct modifiers of TDP-43 aggregation in human cells. Our screen revealed both canonical and novel proteostasis genes, and unearthed SRRD, a poorly characterized protein, as a top regulator of protein inclusion formation. APEX biotin labeling reveals that SRRD resides in proximity to proteins that are involved in the formation and breakage of disulfide bonds and to intermediate filaments, suggesting a role in regulation of the spatial dynamics of the intermediate filament network. Indeed, loss of SRRD results in aberrant intermediate filament fibrils and the impaired formation of aggresomes, including blunted vimentin cage structure, during proteotoxic stress. Interestingly, SRRD also localizes to aggresomes and unfolded proteins, and rescues proteotoxicity in yeast whereby its N-terminal low complexity domain is sufficient to induce this affect. Altogether this suggests an unanticipated and broad role for SRRD in cytoskeletal organization and cellular proteostasis.


Conflict of interest statement

I have read the journal’s policy and the authors of this manuscript have the following competing interests: OS and KMS have filed a patent application for the use of SRRD fragments through the Children’s Hospital of Philadelphia. J.S. is a consultant for Dewpoint Therapeutics, ADRx, and Neumora. J.S. is a shareholder and advisor for Confluence Therapeutics. The authors declare no other conflicts of interest relevant to this publication.

Figures
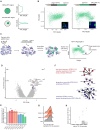
Fig 1
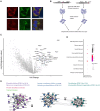
Fig 1. Genome-wide CRISPR-Cas9 KO screen using Pulse-Shape Analysis uncovers expected and novel modifiers of cellular proteostasis.
A) Schematic of theory underlying PulSA. B) Schematic of TDP-43 ΔNLS expression vectors tagged C- or N- terminally with mClover3, PulSA plots generated after transfection of corresponding vectors in 293Ts, and inset of cells showing TDP-43 localization. C) Schematic of genome-wide CRISPR-Cas9 KO screening method. D) Volcano plot of CRISPR screen results where each dot is the average of 4 sgRNAs targeting each gene, displaying the phenotype (x-axis) vs the significance (y-axis). Colored dots correspond to STRING cluster in 1F. E) Arrayed screen validation of top modifiers of TDP-43 ΔNLS aggregation. Each sgRNA KO is normalized to AAV5 non-targeting control and plotted to show the normalized change in the % of cells harboring TDP-43 ΔNLS aggregates. n = 3 replicates, one way anova with Tukey HSD test comparing AAV control to all 6 sgRNAs targeting each gene. Adjusted p -values: AAV-UBE3C 0.00038; AAV-HSPA4 0.03312; AAV-BTNL9 0.03011; AAV-SRRD 0.00003. F) Select clusters of top protein-protein interactions (STRING database) of top 119 genes ranked by p-value that when knocked out increase the number of cells harboring TDP-43 ΔNLS aggregates. Clusters generated with MCL clustering and excludes genes with no known connections and clusters with insignificant p-values. Clusters colored based on STRING annotated GO terms. Dashed line indicates noteworthy link of UBE3C to proteasomal degradation pathway G) Histograms of total TDP-43 ΔNLS expression for AAV5 non-targeting control and two HSPA4 targeting sgRNAs. H) Fraction of cells with TDP-43 aggregates (y-axis) in each TDP-43 ΔNLS expression bin (x-axis) for AAV5 non-targeting control and two HSPA4 targeting sgRNAs. Adjusted p-values i)bin 2500 AAV:HSPA4_C11 = 0.04711; AAV:HSPA4_C12 = 0.04054 ii) bin 3500 AAV:HSPA4_C11 = 0.03956; AAV:HSPA4_C12 = 0.04740 iii) AAV:HSPA4_C11 = 0.00341; AAV:HSPA4_C12 = 0.01095.
Fig 2
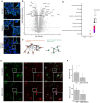
Fig 2. APEX2 proximity labeling reveals SRRD in close proximity to intermediate filaments and regulators of IF oligomerization.
1) HEK293Ts stably expressing SRRD-HA stained for HA and either CANX or mitochondria. B) Schematic of APEX2 proximity labeling experiment where APEX2 is fused to SRRD or to an NES control. C) Volcano plot of APEX2 proximity labeling mass spectrometry output, where fold change (x-axis) is plotted by significance (y-axis). Colored dots correspond to STRING clusters in 2E. (*) correspond to indicate functional annotations of interest highlighted in STRING cluster in 2E. D) Filtered GSEA (cellular compartment) of SRRD-APEX2 dataset. E) Clustering of top protein-protein interactions (STRING database) of top 88 proteins ranked by fold change and p-value. Clusters generated with MCL clustering and excludes proteins with no known connections and clusters with insignificant p-values. Clusters colored based on STRING annotated GO terms and proteins with functional annotations of interested are highlighted as follows: Protein-disulfide isomerases circled in pink, proteins involved in calcium binding circled in orange.
Fig 3
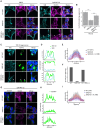
Fig 3. Loss of SRRD results in disorganized and downregulated IFs.
A) Confocal images of indicated cells lines stained for VIM. B) Volcano plot of quantitative proteomics experiment comparing SRRD clonal KO HEK293Ts to WT HEK293Ts where fold change (x-axis) is plotted by significance (y-axis). Horizontal dashed line represents adjusted p-value cutoff of 0.05, vertical line represents fold change of -1. Orange and green colored dots correspond to STRING clusters in 3C. C) Select clusters of top depleted proteins in SRRD KO (STRING database) ranked by fold change and p-value. Clusters generated with MCL clustering and excludes proteins with insignificant p-values. Clusters colored based on STRING annotated GO terms. D) Filtered GSEA (cellular compartment) of quantitative proteomics dataset. E) Representative images of NGN2 neurons transduced with SRRD CRISPRi sgRNA or non-targeting control, stained for MAP2 and INA. F) Quantification of the area per cell covered by INA and MAP2 signal in SRRD CRISPRi and NTC control NGN2 neurons.
Fig 4
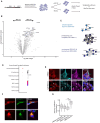
Fig 4. SRRD regulates efficient assembly of aggresomes.
A) WT, SRRD clonal KO, and SRRD clonal KO + SRRD-mRuby3 293Ts treated for 16hrs with 5μM MG132 or DMSO control and stained for VIM and HDAC6. B) Quantification of the percentage of cells harboring aggresomes (perinuclear, HDAC6+, VIM cage+) after MG132 treatment. Dots indicate replicate wells treated, stained, and imaged in parallel. n = 4 replicates, one way anova with Tukey HSD test. Adjusted p-values WT:SRRD KO = 0; KO:rescue = 2.71e-09. C) WT, SRRD clonal KO, and SRRD clonal KO + SRRD-mRuby3 293Ts transfected with mClover3-TDP-43 ΔNLS and stained for VIM. D) Line intensity plots of TDP-43 ΔNLS (green) and VIM (blue) signals corresponding to white lines drawn in 3C. E) Line intensity drawings aggregating TDP-43 ΔNLS intensity data from WT, SRRD clonal KO, and SRRD clonal KO + SRRD-mRuby3 293Ts. Solid line indicates average value at each point, and shaded areas represent the standard deviation. F) Quantification of the percentage of TDP-43 ΔNLS aggregates that have at least a partial VIM cage surrounding it in WT, SRRD clonal KO, and SRRD clonal KO + SRRD-mRuby3 293Ts transfected with mClover3-TDP-43 ΔNLS and stained for VIM. G) WT, SRRD clonal KO, and SRRD clonal KO + SRRD-mRuby3 293Ts treated for 16hrs with 5μM MG132 and stained for SQSTM1 and HDAC6. H) Line intensity plots of SQSTM1 corresponding to white lines drawn in 3G. I) Line intensity drawings aggregating SQSTM1 data from WT, SRRD clonal KO, and SRRD clonal KO + SRRD-mRuby3 293Ts. Solid line indicates average value at each point, and shaded areas represent the standard deviation.
Fig 5
Fig 5. SRRD localizes to aggresomes following cellular proteotoxic stress.
A) Schematic of APEX2 proximity ligation assay with SRRD-V5-APEX2 clonal lines. B) Volcano plot of APEX2 proximity labeling mass spectrometry output, where fold change (x-axis) is plotted by significance (y-axis). Arrows indicate enrichment in +/- MG232 conditions, and each dot represents a protein. Colored dots correspond to STRING clusters in 2I. C) Clustering of top protein-protein interactions (STRING database) of top 100 proteins ranked by fold change and p-value associated with +MG132 (blue) and top associated proteins associated with -MG132 (red) conditions. Clusters generated with MCL clustering and excludes proteins with no known connections and clusters with insignificant p-values. Clusters colored based on STRING annotated GO terms. D) Enrichment analysis of ranked proteins after differential expression analysis of APEX +/- MG132 proximity labeling experiment using CORUM protein complex database. E) 293Ts expressing SRRD-mRuby3 treated with either 5μM MG132 or DMSO control for 16hrs, fixed and stained for VIM and HDAC6. F) 293Ts stably expressing SRRD-mRuby3 transfected with mClover3 control or mClover3-TDP-43 ΔNLS. G) Colocalization of mRuby3 and mClover3 in indicated protein pairs, measured in FIJI using Pearson’s correlation coefficient. Each dot represents correlation coefficient calculated for a single cell, boxes indicate median, upper, and lower quartiles. T-test p-values: SRRD-mClover:SRRD-TDP-43 = 1.055e-08; mRuby3-TDP-43:SRRD-TDP-43 = 7.305e-10.
Fig 6
Fig 6. SRRD N-terminal low complexity is sufficient to rescue protein toxicity and inclusion formation in orthogonal models of protein toxicity and aggregation.
A) AlphaFold predicted structure of SRRD (top) and schematic of SRRD indicating predicted domains (ELM) with amino acid numbers indicating the size of each domain. Dashed lines indicate N-terminal low complexity domain on both schematic and AlphaFold structure. B) 293Ts stably expressing SRRD-mRuby3 or NTD-mRuby3 (1-140aa) transfected with mClover3-TDP-43 ΔNLS. C) 293Ts stably expressing SRRD-mRuby3 or NTD-mRuby3 (1-140aa) transfected with mClover3-TDP-43 ΔNLS. F) FACS analyzed 293Ts co-transfected with mClover3-TDP-43 ΔNLS and indicated truncations of SRRD (P2A-mRuby3 empty vector as expression control). Percentage of cells harboring TDP-43 ΔNLS aggregates plotted for each SRRD truncation. n = 3 replicates, one way anova with Tukey HSD test. Vector:0–150 p-value = 0.00000; vector:0–194 p-value = 0.00000; vector:50–340 p-value = 0.19792; vector:150–340 p-value = 0.70249; vector:195–340 p-value = 0.00387; vector:-SRR1 p-value = 0.00000; vector:FL p-value = 0.99494. Bars representing SRRD truncations harboring the N-terminal domain are colored blue, bars representing SRRD truncations lacking the N-terminal domain are colored grey. D) Yeast growth over time, measured by optical density. Yeast expressed TDP-43 or FUS alone (blue lines), in combination with HSP104-A503S disaggregase (red lines), or in combination with SRRD (green lines). And area under the curve of each growth curve. Adjusted p-values: Hsp104-A503S rescue of TDP-43 toxicity = 0.00003; SRRD rescue of TDP-43 toxicity = 0.00045; Hsp104-A503S rescue of FUS toxicity = 0.00000; SRRD rescue of FUS toxicity = 0.00035. E) Yeast spotting assay where indicated transgene expression is off under glucose, on under galactose. F) Yeast spotting of TDP-43 toxicity where TDP-43 and indicated SRRD truncation or Hsp104-A503S expression is off under glucose, on under galactose.

References

    1. Wolff S, Weissman JS, Dillin A. Differential scales of protein quality control. Cell. 2014;157: 52–64. doi: 10.1016/j.cell.2014.03.007 - DOI - PubMed
    1. Chen B, Retzlaff M, Roos T, Frydman J. Cellular strategies of protein quality control. Cold Spring Harb Perspect Biol. 2011;3: a004374. doi: 10.1101/cshperspect.a004374 - DOI - PMC - PubMed
    1. Jayaraj GG, Hipp MS, Hartl FU. Functional Modules of the Proteostasis Network. Cold Spring Harb Perspect Biol. 2020;12. doi: 10.1101/cshperspect.a033951 - DOI - PMC - PubMed
    1. Hipp MS, Kasturi P, Hartl FU. The proteostasis network and its decline in ageing. Nat Rev Mol Cell Biol. 2019;20: 421–435. doi: 10.1038/s41580-019-0101-y - DOI - PubMed
    1. Sontag EM, Samant RS, Frydman J. Mechanisms and Functions of Spatial Protein Quality Control. Annu Rev Biochem. 2017;86: 97–122. doi: 10.1146/annurev-biochem-060815-014616 - DOI - PubMed

MeSH terms