. 2024 Feb 5;22(2):e3002482.
doi: 10.1371/journal.pbio.3002482. eCollection 2024 Feb.

Oxidative stress changes interactions between 2 bacterial species from competitive to facilitative

Affiliations

Oxidative stress changes interactions between 2 bacterial species from competitive to facilitative

Rita Di Martino et al. PLoS Biol. .

Abstract

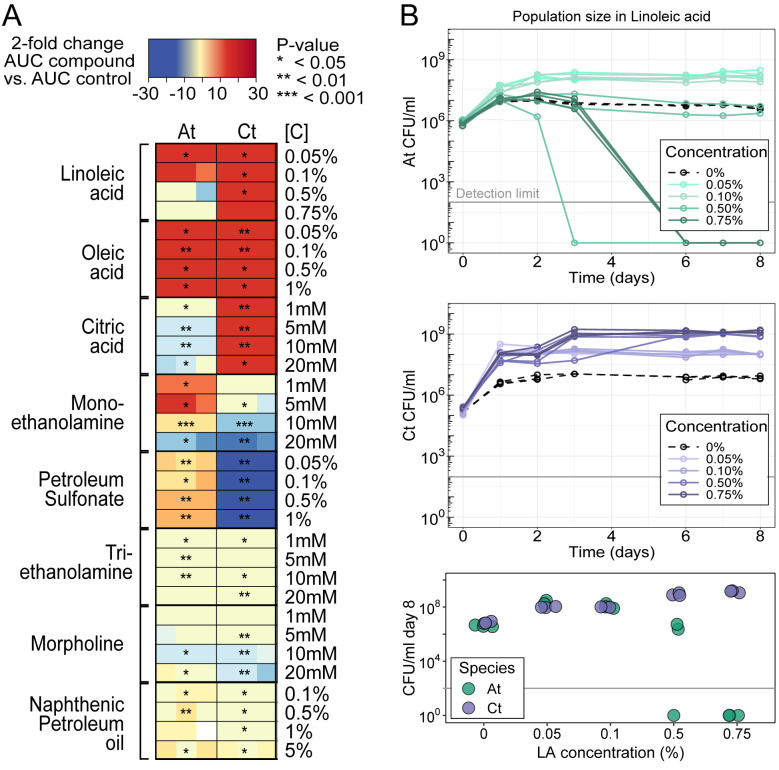
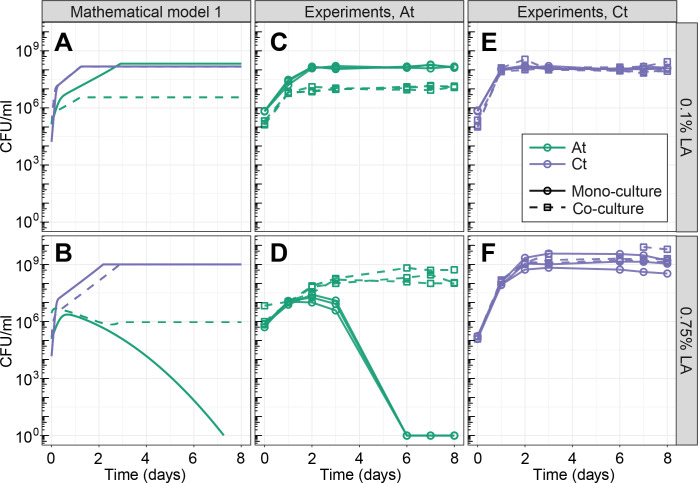
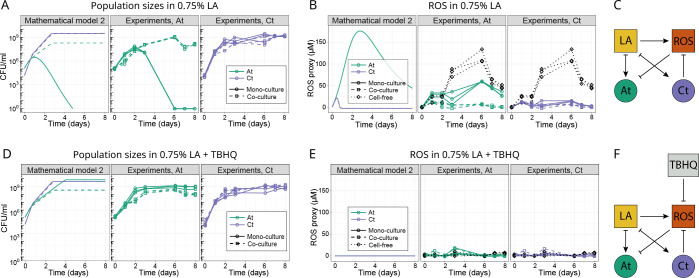
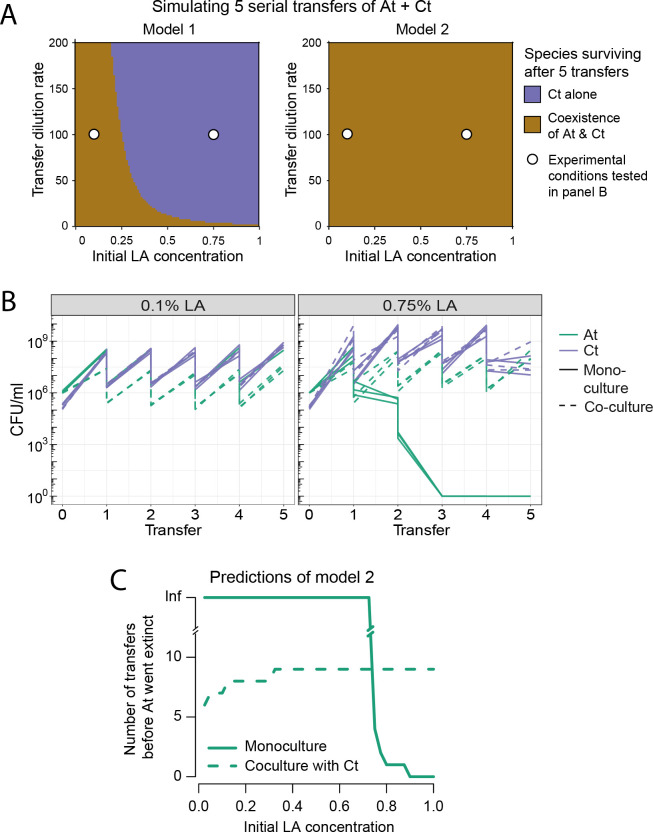
Knowing how species interact within microbial communities is crucial to predicting and controlling community dynamics, but interactions can depend on environmental conditions. The stress-gradient hypothesis (SGH) predicts that species are more likely to facilitate each other in harsher environments. Even if the SGH gives some intuition, quantitative modeling of the context-dependency of interactions requires understanding the mechanisms behind the SGH. In this study, we show with both experiments and a theoretical analysis that varying the concentration of a single compound, linoleic acid (LA), modifies the interaction between 2 bacterial species, Agrobacterium tumefaciens and Comamonas testosteroni, from competitive at a low concentration, to facilitative at higher concentrations where LA becomes toxic for one of the 2 species. We demonstrate that the mechanism behind facilitation is that one species is able to reduce reactive oxygen species (ROS) that are produced spontaneously at higher concentrations of LA, allowing for short-term rescue of the species that is sensitive to ROS and longer coexistence in serial transfers. In our system, competition and facilitation between species can occur simultaneously, and changing the concentration of a single compound can alter the balance between the two.


Conflict of interest statement

The authors have declared that no competing interests exist.

Figures

Fig 1
Fig 1. Concentration-dependent effects of different compounds on the growth of At and Ct.
(A) Growth of A. tumefaciens (At) and C. testosteroni (Ct) in presence of different compounds at a range of concentrations in triplicates (each replicate is one colored square in the rectangle). The tested compound is the only carbon source added to the medium (see Methods). Heatmaps show the fold change between the AUC of each sample replicate and the AUC of the mean of the 3 control replicates where no compound was added. Blue shades represent negative fold change (bacteria grew to significantly smaller populations than the control) and orange shades represent positive fold change (bacteria grew to greater population sizes than the control). Statistical significance is determined by t tests comparing N = 3 AUCs at e.g., [C] = 0.05% to N = 3 AUCs at [C] = 0 (*: P<0.05,**: P<0.01,***: P<0.001). (B) Growth curves that generated the LA data in panel A. We observe some growth for both species in the absence of any carbon source (0%) but little competition when co-cultured (S1 Fig). While we were unable to find the source of this growth, similar observations have been previously reported [–39]. All 3 technical replicates per condition are shown. The bottom panel shows population sizes at day 8 for a clearer comparison. The data underlying this figure can be found at https://zenodo.org/records/8033845. AUC, area under the growth curve; LA, linoleic acid.
Fig 2
Fig 2. Growth of the 2 species in mono- and co-cultures at the 2 LA concentrations, predicted by the model and in experiments.
(A, B) Predictions of model 1, where LA is a nutrient but becomes increasingly toxic over time. Model parameters were estimated by fitting to the mono-culture data (see Methods). (C–F) Experiments showing the growth of At (C, D) and Ct (E, F) at 0.1% LA (C, E) or 0.75% LA (D, F). Both species survive in mono-culture at 0.1% LA, whereas At grows and then dies in mono-culture at 0.75%. At 0.1% LA, At suffers from the presence of Ct in co-culture, while Ct’s growth is not significantly affected. At 0.75% LA, At is rescued by Ct in the co-culture, and Ct’s growth is not significantly affected. The model does a reasonable job at capturing the overall dynamics, but underestimates At’s growth in co-culture at 0.75% LA. For experimental data, all 3 technical replicates per condition are shown. See main text for statistics. The data underlying this figure can be found at https://zenodo.org/records/8033845. LA, linoleic acid.
Fig 3
Fig 3. Comparing population and ROS abundance over time.
(A, D) Population sizes of both species in mono- and co-culture at 0.75% LA (A) or 0.75% LA with the antioxidant TBHQ added daily (D) (see Methods). Panel (A) shows a biological repeat of the experiment shown in Fig 2, but where ROS was measured simultaneously (panel B). The mathematical model in the left panels of (A) and (D) is the second implementation of the model, where ROS is explicitly modeled as a separate chemical from LA. In model 2, LA is only a resource (see Methods). Model parameters were estimated by fitting to the mono-culture data (see Methods). (B, E) A proxy for ROS concentration (MDA-TBA2, see Methods for assay) over time in the different experimental treatments and in model 2 (left panel) in the 0.75% LA medium (B) or where TBHQ was added (E). The cell-free and co-culture data are identical in the At and Ct subpanels (in black), as they come from the same samples. For experimental data, all 3 technical replicates per condition are shown. In the model panels, the cell-free lines are hidden by the green ones for At, as they are identical. (C, F) A diagrammatic representation of the relationships between chemicals (in squares) and bacterial species (circles): (C) LA is consumed as a resource by both species and generates ROS. ROS inhibits At but can be reduced by Ct. (F) TBHQ inhibits ROS, making ROS removal by Ct superfluous. ROS removal by TBHQ or by Ct in co-cultures, rescues At. This translates into facilitation of At by Ct in the top row and competition in the bottom row, where TBHQ removes ROS. The data underlying this figure can be found at https://zenodo.org/records/8033845. LA, linoleic acid; ROS, reactive oxygen species; TBHQ, tert-butylhydroquinone.
Fig 4
Fig 4. Coexistence experiments and models.
(A) Prediction of short-term coexistence over 5 simulated serial transfers of the co-culture of At and Ct according to model 1 (left) and model 2 (right): Both models allow for short-term coexistence, but the parameter space in which this is possible is larger in model 2 (panel B, larger area representing coexistence compared to Ct surviving alone). White circles indicate the conditions in which experiments were run, as shown in panel B. (B) 5-Transfer experiment of At and Ct in mono- and co-culture at both 0.1% (left) and 0.75% LA (right). We show the population size in the initial culture (“transfer” 0), which is then quantified at each transfer (every 72 h). We illustrate the 100-fold dilution at each transfer, although this is not explicitly quantified. All 3 technical replicates per condition are shown. At mono-culture goes extinct as expected in 0.75% LA, but the 2 species coexist at both LA concentrations, as correctly predicted by model 2 in panel A. (C) Model 2 predicts that At should survive indefinitely in mono-culture at a 100-fold dilution rate up to 0.75% LA. In co-culture, Ct excludes it after a few transfers at low LA concentrations, but as the concentration increases, At can survive for longer in co- compared to mono-culture, meaning that Ct facilitates At’s survival by extending its duration (see also S3 Fig). The data underlying this figure can be found at https://zenodo.org/records/8033845. LA, linoleic acid.

References

    1. Gomaa EZ. Human gut microbiota/microbiome in health and diseases: a review. Antonie Van Leeuwenhoek. 2020;113(12):2019–2040. doi: 10.1007/s10482-020-01474-7 - DOI - PubMed
    1. Beech IB, Sunner J. Biocorrosion: towards understanding interactions between biofilms and metals. Curr Opin Biotechnol. 2004;15(3):181–186. doi: 10.1016/j.copbio.2004.05.001 - DOI - PubMed
    1. Foster KR, Bell T. Competition, not cooperation, dominates interactions among culturable microbial species. Curr Biol. 2012;22(19):1845–50. doi: 10.1016/j.cub.2012.08.005 - DOI - PubMed
    1. Palmer JD, Foster KR. Bacterial species rarely work together. Science. 2022;376(6593):581–582. doi: 10.1126/science.abn5093 - DOI - PubMed
    1. Giri S, Oña L, Waschina S, Shitut S, Yousif G, Kaleta C, et al.. Metabolic dissimilarity determines the establishment of cross-feeding interactions in bacteria. Curr Biol. 2021. doi: 10.1016/j.cub.2021.10.019 - DOI - PubMed

Substances