. 2024 Apr 1;84(7):1165-1177.
doi: 10.1158/0008-5472.CAN-23-1698.

Integrating AI-Powered Digital Pathology and Imaging Mass Cytometry Identifies Key Classifiers of Tumor Cells, Stroma, and Immune Cells in Non-Small Cell Lung Cancer

Affiliations

Integrating AI-Powered Digital Pathology and Imaging Mass Cytometry Identifies Key Classifiers of Tumor Cells, Stroma, and Immune Cells in Non-Small Cell Lung Cancer

Alessandra Rigamonti et al. Cancer Res. .

Abstract

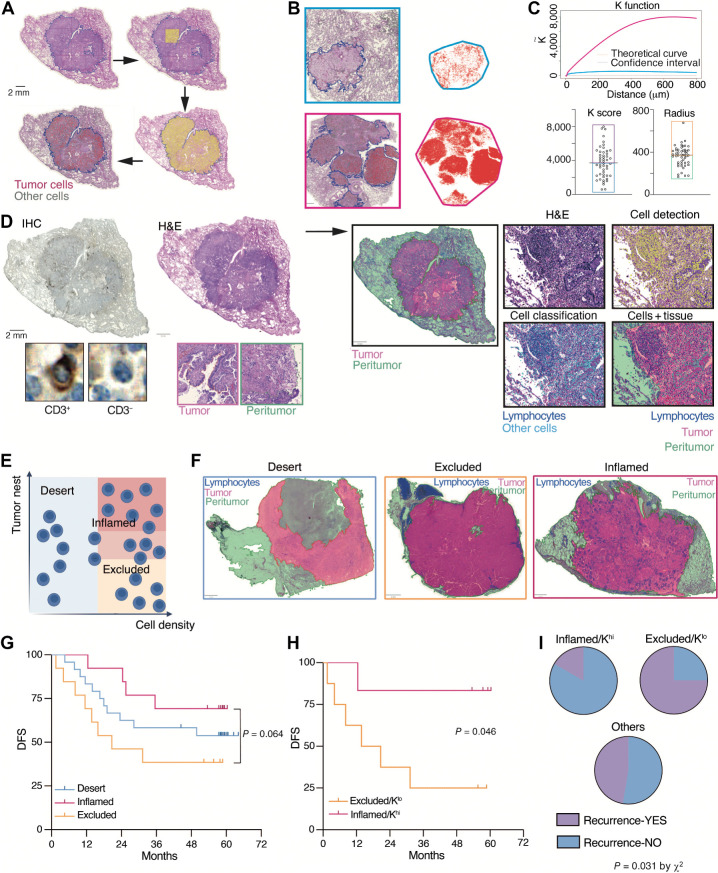
Artificial intelligence (AI)-powered approaches are becoming increasingly used as histopathologic tools to extract subvisual features and improve diagnostic workflows. On the other hand, hi-plex approaches are widely adopted to analyze the immune ecosystem in tumor specimens. Here, we aimed at combining AI-aided histopathology and imaging mass cytometry (IMC) to analyze the ecosystem of non-small cell lung cancer (NSCLC). An AI-based approach was used on hematoxylin and eosin (H&E) sections from 158 NSCLC specimens to accurately identify tumor cells, both adenocarcinoma and squamous carcinoma cells, and to generate a classifier of tumor cell spatial clustering. Consecutive tissue sections were stained with metal-labeled antibodies and processed through the IMC workflow, allowing quantitative detection of 24 markers related to tumor cells, tissue architecture, CD45+ myeloid and lymphoid cells, and immune activation. IMC identified 11 macrophage clusters that mainly localized in the stroma, except for S100A8+ cells, which infiltrated tumor nests. T cells were preferentially localized in peritumor areas or in tumor nests, the latter being associated with better prognosis, and they were more abundant in highly clustered tumors. Integrated tumor and immune classifiers were validated as prognostic on whole slides. In conclusion, integration of AI-powered H&E and multiparametric IMC allows investigation of spatial patterns and reveals tissue relevant features with clinical relevance.

Significance: Leveraging artificial intelligence-powered H&E analysis integrated with hi-plex imaging mass cytometry provides insights into the tumor ecosystem and can translate tumor features into classifiers to predict prognosis, genotype, and therapy response.


Figures

Figure 1. Identification of tumor cells by AI-powered digital pathology on H&E slides of NSCLC. A, Overview of the image-processing pipeline used to recognize NSCLC tumor cells. 1. H&E: Digitized slide images were prepared from H&E-stained tissues and imported in the QuPath software; the image patch represents H&E. 2. Cell detection: Nuclear segmentation performed via the StarDist tool; the image patch represents an overlay of the segmented nuclei onto the H&E. 3. Cell classification: Single cells classified as either tumor or nontumor cells by a machine learning–based tool; the image patch represents an overlay of the classified cells onto the H&E. B, Representative H&E and IHC staining of a TTF-1–positive adenocarcinoma (top), a p40-positive squamous cell carcinoma (bottom), and identification of tumor cells by the AI tool (left patches). H&E and IHC of the biopsy cores were performed on two consecutive TMA sections. C, Validation of the AI approach (Train Object Classifier tool, embedded in the QuPath software) in normal regions. Both in normal lung tissue (top) and adjacent lung tissue (bottom), the AI tool does not recognize tumor cells. D, The AI tool recognizes tumor cells across NSCLC histologic subtypes. Representative H&E and IHC staining of TTF-1–positive adenocarcinoma subtypes (mucinous, micropapillary, papillary), and a p40-positive squamous-basaloid cell carcinoma subtype and identification of tumor cells by the AI tool (left patches). Scale bars, 100 μm (B–D), 20 μm (A and insets).
Figure 1.
Identification of tumor cells by AI-powered digital pathology on H&E slides of NSCLC. A, Overview of the image-processing pipeline used to recognize NSCLC tumor cells. 1. H&E: Digitized slide images were prepared from H&E-stained tissues and imported in the QuPath software; the image patch represents H&E. 2. Cell detection: Nuclear segmentation performed via the StarDist tool; the image patch represents an overlay of the segmented nuclei onto the H&E. 3. Cell classification: Single cells classified as either tumor or nontumor cells by a machine learning–based tool; the image patch represents an overlay of the classified cells onto the H&E. B, Representative H&E and IHC staining of a TTF-1–positive adenocarcinoma (top), a p40-positive squamous cell carcinoma (bottom), and identification of tumor cells by the AI tool (left patches). H&E and IHC of the biopsy cores were performed on two consecutive TMA sections. C, Validation of the AI approach (Train Object Classifier tool, embedded in the QuPath software) in normal regions. Both in normal lung tissue (top) and adjacent lung tissue (bottom), the AI tool does not recognize tumor cells. D, The AI tool recognizes tumor cells across NSCLC histologic subtypes. Representative H&E and IHC staining of TTF-1–positive adenocarcinoma subtypes (mucinous, micropapillary, papillary), and a p40-positive squamous-basaloid cell carcinoma subtype and identification of tumor cells by the AI tool (left patches). Scale bars, 100 μm (B–D), 20 μm (A and insets).
Figure 2. Development of a spatial classifier of tumor cells in human NSCLC. A, Representative NSCLC image patches of tumor cells (red) uniformly distributed (gray circle; top left), poorly clustered (blue circle; top middle), or highly clustered (magenta circle; top right). Bottom panels show the point pattern distribution of cell centers used for the analysis with the Ripley's K function. B, Graph representing the normalized and centered Ripley's K function curves of the point pattern distribution of tumor cells from images shown in A (solid lines). The more clustered the cells are, the farther the relative K function curve is from the theoretical estimated curve (red dotted line). Conversely, the K function curve of cells uniformly distributed in the tissue is close to the theoretical curve and is included within the upper and the lower 99% confidence interval (blue dotted lines). C, Schematic representation of the K score and cluster's radius metrics used to classify NSCLC samples. Each TMA core is classified as highly clustered or poorly clustered according to the K score (top), or as having small or large tumor cell clusters according to the cluster's radius (bottom). D, Distribution of tumor cell–related K score and cluster's radius indexes in 116 NSCLC specimens. Boxes indicate the cut-off used to classify the samples. Each dot represents one TMA core from cohort 1. E, Correlation between the K score and cluster's radius values (r = 0.229; P = 0.013 by Pearson correlation) in 116 NSCLC specimens. F, Bar plot showing the abundance of highly clustered (magenta) or poorly clustered (blue) samples in different histologic subtypes of NSCLC (P < 0.0001 by χ2). AD, adenocarcinoma; ADS, adenosquamous carcinoma; SCC, squamous cell carcinoma.
Figure 2.
Development of a spatial classifier of tumor cells in human NSCLC. A, Representative NSCLC image patches of tumor cells (red) uniformly distributed (gray circle; top left), poorly clustered (blue circle; top middle), or highly clustered (magenta circle; top right). Bottom panels show the point pattern distribution of cell centers used for the analysis with the Ripley's K function. B, Graph representing the normalized and centered Ripley's K function curves of the point pattern distribution of tumor cells from images shown in A (solid lines). The more clustered the cells are, the farther the relative K function curve is from the theoretical estimated curve (red dotted line). Conversely, the K function curve of cells uniformly distributed in the tissue is close to the theoretical curve and is included within the upper and the lower 99% confidence interval (blue dotted lines). C, Schematic representation of the K score and cluster's radius metrics used to classify NSCLC samples. Each TMA core is classified as highly clustered or poorly clustered according to the K score (top), or as having small or large tumor cell clusters according to the cluster's radius (bottom). D, Distribution of tumor cell–related K score and cluster's radius indexes in 116 NSCLC specimens. Boxes indicate the cut-off used to classify the samples. Each dot represents one TMA core from cohort 1. E, Correlation between the K score and cluster's radius values (r = 0.229; P = 0.013 by Pearson correlation) in 116 NSCLC specimens. F, Bar plot showing the abundance of highly clustered (magenta) or poorly clustered (blue) samples in different histologic subtypes of NSCLC (P < 0.0001 by χ2). AD, adenocarcinoma; ADS, adenosquamous carcinoma; SCC, squamous cell carcinoma.
Figure 3. Multidimensional analysis of the NSCLC tumor ecosystem by IMC. A, Schematic representation of the IMC workflow on a formalin-fixed, paraffin-embedded tissue microarray. Key steps include staining with metal-tagged antibodies, spot-by-spot laser ablation, and acquisition by a mass cytometer. High dimensional images are reconstructed, processed, and segmented at both cellular and tissue level, generating data for further analyses. B, Heat map showing the mean values of key lineage markers adopted for cell cluster annotation. Proteins and cell phenotypes are ordered by hierarchical clustering with the Pearson correlation distance. Protein expression is color-coded from blue (lower) to red (higher) and scaled by column. C, Representative matched pictures of a NSCLC specimen showing pan-cytokeratin–positive tumor cells (left) and the tissue segmentation resulting from the machine learning pixel classifier (right). D, Spatial distribution and quantification of immune cell populations as the absolute cell number per mm2 (left) or as a percentage of total immune cells (right) in the tumor and the stroma. E, Heat map showing the normalized marker expression in each macrophage cluster. Markers and cell clusters are ordered by hierarchical clustering according to Pearson correlation distance. Mean values of marker expression are represented and color-coded from blue (lower) to red (higher) and scaled by column. Color code indicates cluster identity. F and G, UMAP projections of macrophage cells (n = 46733) from NSCLC tumors showing 20 clusters (F) or the cell distribution according to tissue segmentation (G). Each dot represents an individual cell. H, S100A8+ Mϕ infiltrate both the stroma and the tumor nests of NSCLC tissues. Representative pictures of the distribution of Mϕ (defined as CD68+ cells) and the subpopulation of S100A8+ Mϕ within tumor nests of a NSCLC tissue.
Figure 3.
Multidimensional analysis of the NSCLC tumor ecosystem by IMC. A, Schematic representation of the IMC workflow on a formalin-fixed, paraffin-embedded tissue microarray. Key steps include staining with metal-tagged antibodies, spot-by-spot laser ablation, and acquisition by a mass cytometer. High dimensional images are reconstructed, processed, and segmented at both cellular and tissue level, generating data for further analyses. B, Heat map showing the mean values of key lineage markers adopted for cell cluster annotation. Proteins and cell phenotypes are ordered by hierarchical clustering with the Pearson correlation distance. Protein expression is color-coded from blue (lower) to red (higher) and scaled by column. C, Representative matched pictures of a NSCLC specimen showing pan-cytokeratin–positive tumor cells (left) and the tissue segmentation resulting from the machine learning pixel classifier (right). D, Spatial distribution and quantification of immune cell populations as the absolute cell number per mm2 (left) or as a percentage of total immune cells (right) in the tumor and the stroma. E, Heat map showing the normalized marker expression in each macrophage cluster. Markers and cell clusters are ordered by hierarchical clustering according to Pearson correlation distance. Mean values of marker expression are represented and color-coded from blue (lower) to red (higher) and scaled by column. Color code indicates cluster identity. F and G, UMAP projections of macrophage cells (n = 46733) from NSCLC tumors showing 20 clusters (F) or the cell distribution according to tissue segmentation (G). Each dot represents an individual cell. H, S100A8+ Mϕ infiltrate both the stroma and the tumor nests of NSCLC tissues. Representative pictures of the distribution of Mϕ (defined as CD68+ cells) and the subpopulation of S100A8+ Mϕ within tumor nests of a NSCLC tissue.
Figure 4. Paired AI-powered H&E and IMC analysis provides spatial integration of tumor and immune classifiers. A, Representative matched pictures of tumor specimens showing collagen I heterogeneity in NSCLC (top) and the tissue segmentations resulting from the machine learning pixel classifier (bottom). B, Quantification of stromal, immune, tumor, and other cell clusters as the absolute cell number per mm2 from poorly fibrotic or highly fibrotic NSCLC tumors. Bars represent the mean ± SEM. C, Correlation between the percentage of tissue area positive for the collagen I and the K score (r = −0.013; P = ns by Pearson correlation; left) or the cluster's radius (r = −0.061; P = ns by Pearson correlation; right) in 116 NSCLC specimens. D, Bar plots showing the relative proportion of tumor, stromal, and immune cells in specimens classified as poorly (n = 86) or highly clustered (n = 28) according to the K score. E, Quantification of B cells, CD8+ T cells, and regulatory T (Treg) cells as the absolute cell number per mm2 from the stromal region of NSCLC specimens classified as poorly or highly clustered. F, Representative pictures of the preferential localization of adaptive cells in poorly clustered or highly clustered samples. *, P < 0.05; **, P < 0.01; ***, P < 0.001; and n.s., not significant, by Mann–Whitney test.
Figure 4.
Paired AI-powered H&E and IMC analysis provides spatial integration of tumor and immune classifiers. A, Representative matched pictures of tumor specimens showing collagen I heterogeneity in NSCLC (top) and the tissue segmentations resulting from the machine learning pixel classifier (bottom). B, Quantification of stromal, immune, tumor, and other cell clusters as the absolute cell number per mm2 from poorly fibrotic or highly fibrotic NSCLC tumors. Bars represent the mean ± SEM. C, Correlation between the percentage of tissue area positive for the collagen I and the K score (r = −0.013; P = ns by Pearson correlation; left) or the cluster's radius (r = −0.061; P = ns by Pearson correlation; right) in 116 NSCLC specimens. D, Bar plots showing the relative proportion of tumor, stromal, and immune cells in specimens classified as poorly (n = 86) or highly clustered (n = 28) according to the K score. E, Quantification of B cells, CD8+ T cells, and regulatory T (Treg) cells as the absolute cell number per mm2 from the stromal region of NSCLC specimens classified as poorly or highly clustered. F, Representative pictures of the preferential localization of adaptive cells in poorly clustered or highly clustered samples. *, P < 0.05; **, P < 0.01; ***, P < 0.001; and n.s., not significant, by Mann–Whitney test.
Figure 5. Deployment of the tumor and immune classifiers to the whole slide setting. A, Representative H&E images from one NSCLC specimen, showing the deployment of the tumor classifier to the WSI setting. From top left to bottom right, manual annotation of the tumor region, division in tiles, cell annotation, and cell classification. Scale bars, 2 mm. B, Two representative NSCLC WSIs, where tumor cells (red) are uniformly distributed (top) or highly clustered (bottom). Panels on the right show the relative point pattern distribution of cell centers used for the analysis with the Ripley's K function. C, Graph representing the normalized and centered Ripley's K function curves of the point pattern distribution of tumor cells from images shown in B (top). Distribution of tumor cell K score and cluster's radius indexes in n = 50 NSCLC specimens. Boxes indicate the cutoff used to classify the samples. Each dot represents one WSI from cohort 2. D, Schematic representation of the digital approach used to develop an immune classifier on WSIs. From left to right, CD3+ cell annotation, tissue segmentation, and combination. E, Classification of samples into desert, excluded, or inflamed, based on the cell density and tissue localization. F, Representative images of three NSCLC specimens classified as desert, excluded, or inflamed. Scale bar, 2 mm. G, Kaplan–Meier curve showing DFS of n = 50 patients classified as desert (n = 24), excluded (n = 13), or inflamed (n = 13). P = 0.064 by log-rank Mantel–Cox (inflamed vs. excluded). H, Kaplan–Meier curve showing DFS of patients classified as excluded/Klo (n = 8) or inflamed/Khi (n = 6). P = 0.046 by log-rank Mantel–Cox. I, Pie charts showing proportions of clinical outcomes (recurrence YES or NO) in the inflamed/Khi patients versus the excluded/Klo and others (P = 0.031 inflamed/Khi vs. excluded/Klo by χ2 test).
Figure 5.
Deployment of the tumor and immune classifiers to the whole slide setting. A, Representative H&E images from one NSCLC specimen, showing the deployment of the tumor classifier to the WSI setting. From top left to bottom right, manual annotation of the tumor region, division in tiles, cell annotation, and cell classification. Scale bars, 2 mm. B, Two representative NSCLC WSIs, where tumor cells (red) are uniformly distributed (top) or highly clustered (bottom). Panels on the right show the relative point pattern distribution of cell centers used for the analysis with the Ripley's K function. C, Graph representing the normalized and centered Ripley's K function curves of the point pattern distribution of tumor cells from images shown in B (top). Distribution of tumor cell K score and cluster's radius indexes in n = 50 NSCLC specimens. Boxes indicate the cutoff used to classify the samples. Each dot represents one WSI from cohort 2. D, Schematic representation of the digital approach used to develop an immune classifier on WSIs. From left to right, CD3+ cell annotation, tissue segmentation, and combination. E, Classification of samples into desert, excluded, or inflamed, based on the cell density and tissue localization. F, Representative images of three NSCLC specimens classified as desert, excluded, or inflamed. Scale bar, 2 mm. G, Kaplan–Meier curve showing DFS of n = 50 patients classified as desert (n = 24), excluded (n = 13), or inflamed (n = 13). P = 0.064 by log-rank Mantel–Cox (inflamed vs. excluded). H, Kaplan–Meier curve showing DFS of patients classified as excluded/Klo (n = 8) or inflamed/Khi (n = 6). P = 0.046 by log-rank Mantel–Cox. I, Pie charts showing proportions of clinical outcomes (recurrence YES or NO) in the inflamed/Khi patients versus the excluded/Klo and others (P = 0.031 inflamed/Khi vs. excluded/Klo by χ2 test).

References

    1. Bera K, Schalper KA, Rimm DL, Velcheti V, Madabhushi A. Artificial intelligence in digital pathology - new tools for diagnosis and precision oncology. Nat Rev Clin Oncol 2019;16:703–15. - PMC - PubMed
    1. Kleppe A, Skrede OJ, De Raedt S, Liestøl K, Kerr DJ, Danielsen HE. Designing deep learning studies in cancer diagnostics. Nat Rev Cancer 2021;21:199–211. - PubMed
    1. Shmatko A, Ghaffari Laleh N, Gerstung M, Kather JN. Artificial intelligence in histopathology: enhancing cancer research and clinical oncology. Nat Cancer 2022;3:1026–38. - PubMed
    1. Diao JA, Wang JK, Chui WF, Mountain V, Gullapally SC, Srinivasan R, et al. . Human-interpretable image features derived from densely mapped cancer pathology slides predict diverse molecular phenotypes. Nat Commun 2021;12:1613. - PMC - PubMed
    1. Guramare M, Ashar Javed S, Agrawal N, Abel J, Montalto M, Beck A, et al. . Digital pathology uncovers multi-omic hallmarks of lung cancer in histopathology images. J Thorac Oncol 2023;17:15–15.

Publication types