

The growing inadequacy of an open-ended Saffir-Simpson hurricane wind scale in a warming world
- PMID: 38315843
- PMCID: PMC10873601
- DOI: 10.1073/pnas.2308901121
The growing inadequacy of an open-ended Saffir-Simpson hurricane wind scale in a warming world
Abstract
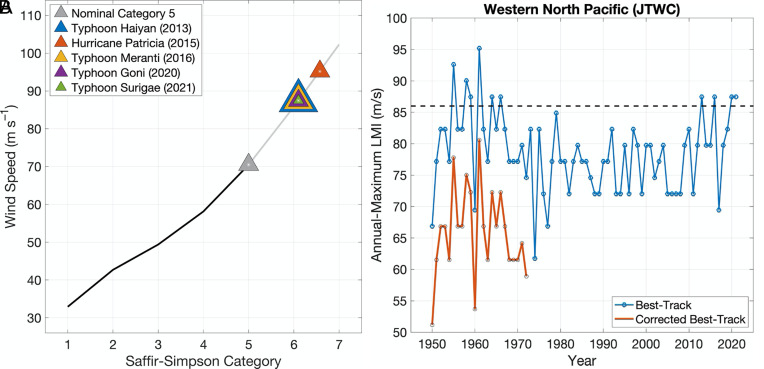
Global warming increases available sensible and latent heat energy, increasing the thermodynamic potential wind intensity of tropical cyclones (TCs). Supported by theory, observations, and modeling, this causes a shift in mean TC intensity, which tends to manifest most clearly at the greatest intensities. The Saffir-Simpson scale for categorizing damage based on the wind intensity of TCs was introduced in the early 1970s and remains the most commonly used metric for public communication of the level of wind hazard that a TC poses. Because the scale is open-ended and does not extend beyond category 5 (70 m/s windspeed or greater), the level of wind hazard conveyed by the scale remains constant regardless of how far the intensity extends beyond 70 m/s. This may be considered a weakness of the scale, particularly considering that the destructive potential of the wind increases exponentially. Here, we consider how this weakness becomes amplified in a warming world by elucidating the past and future increases of peak wind speeds in the most intense TCs. A simple extrapolation of the Saffir-Simpson scale is used to define a hypothetical category 6, and we describe the frequency of TCs, both past and projected under global warming, that would fall under this category. We find that a number of recent storms have already achieved this hypothetical category 6 intensity and based on multiple independent lines of evidence examining the highest simulated and potential peak wind speeds, more such storms are projected as the climate continues to warm.
Keywords: Saffir-Simpson hurricane intensity scale; climate change; tropical cyclone.
Conflict of interest statement
Competing interests statement:The authors declare no competing interest.
Figures


Comment in
-
Cat 6 hurricanes have arrived.Proc Natl Acad Sci U S A. 2024 Feb 13;121(7):e2322597121. doi: 10.1073/pnas.2322597121. Epub 2024 Feb 7. Proc Natl Acad Sci U S A. 2024. PMID: 38324575 Free PMC article. No abstract available.
References
-
- Saffir H. S., Hurricane wind and storm surge. Mil. Eng. 423, 4–5 (1973).
-
- Simpson R. H., The hurricane disaster potential scale. Weatherwise 27, 169–186 (1974).
-
- Camelo J., Mayo T., The lasting impacts of the Saffir-Simpson hurricane wind scale on storm surge risk communication: The need for multidisciplinary research in addressing a multidisciplinary challenge. Weather Clim. Extrem. 33, 100335 (2021).
-
- Paul S., Ghebreyesus D., Sharif H. O., Brief communication: Analysis of the fatalities and socio-economic impacts caused by hurricane florence. Geosciences 9, 58 (2019).
-
- Xian S., Lin N., Hatzikyriakou A., Storm surge damage to residential areas: A quantitative analysis for Hurricane Sandy in comparison with FEMA flood map. Nat. Hazards 79, 1867–1888 (2015).
Grants and funding
LinkOut - more resources
Full Text Sources
Miscellaneous
