. 2024 Apr 9;8(7):1725-1736.
doi: 10.1182/bloodadvances.2024012626.

Type 2M/2A von Willebrand disease: a shared phenotype between type 2M and 2A

Affiliations

Type 2M/2A von Willebrand disease: a shared phenotype between type 2M and 2A

Omid Seidizadeh et al. Blood Adv. .

Abstract

Four variants have been continuously subjected to debate and received different von Willebrand disease (VWD) classifications: p.R1315L, p.R1315C, p.R1374H, and p.R1374C. We chose to comprehensively investigate these variants with full set of VWD tests, protein-modeling predictions and applying structural biology. Patients with p.R1315L, p.R1315C, p.R1374H, and p.R1374C were included. A group with type 2A and 2M was included to better understand similarities and differences. Patients were investigated for phenotypic assays and underlying disease mechanisms. We applied deep protein modeling predictions and structural biology to elucidate the causative effects of variants. Forty-three patients with these variants and 70 with 2A (n = 35) or 2M (n = 35) were studied. Patients with p.R1315L, p.R1374H, or p.R1374C showed a common phenotype between 2M and 2A using von Willebrand factor (VWF):GPIbR/VWF:Ag and VWF:CB/VWF:Ag ratios and VWF multimeric profile, whereas p.R1315C represented a type 2M phenotype. There was an overall reduced VWF synthesis or secretion in 2M and cases with p.R1315L, p.R1374H, and p.R1374C, but not in 2A. Reduced VWF survival was observed in most 2A (77%), 2M (80%), and all 40 cases with p.R1315L, p.R1374H, and p.R1374C. These were the only variants that fall at the interface between the A1-A2 domains. p.R1315L/C mutants induce more compactness and internal mobility, whereas p.R1374H/C display a more extended overall geometry. We propose a new classification of type 2M/2A for p.R1315L, p.R1374H, and p.R1374C because they share a common phenotype with 2M and 2A. Our structural analysis shows the unique location of these variants on the A1-A2 domains and their distinctive effect on VWF.


Conflict of interest statement

Conflict-of-interest disclosure: F.P. serves on the advisory committees of CSL Behring, Biomarin, Roche, Sanofi, and Sobi, and participated in educational meetings/symposia of Takeda/Spark. The remaining authors declare no competing financial interests.

Figures

None
Graphical abstract
Figure 1.
Figure 1.
Comparison of von Willebrand factor (VWF) activities to VWF antigen (Ag) ratio in the study population. (A) VWF:GPIbR/VWF:Ag and (B) VWF:CB/VWF:Ag ratios.
Figure 2.
Figure 2.
The multimer pattern (densitometric analysis) for patients with type 2 VWD. (A) Densitometry analysis for type 2A patients with variants p.I1628T, p.S1506L, and p.G1629R. Patients with type 2A VWD have a very low level of large VWF multimers, whereas low molecular weight VWF multimers are largely represented. (B) Densitometry analysis for patients with type 2M with variants p.G1415D, p.A1377V-R1379C, and p.V1360A-F1369I-S1378Phe-R1379C. Patients with classical 2M mostly display a “flat” pattern, in which large VWF multimers, although diminished, still are the predominant form. (C) Densitometry analysis for patients with VWD type 2M/2A with variant p.R1374C, p.R1374H, and p.R1315L-R924Q. Type 2M/2A is associated with a slight quantitative reduction of large VWF multimers and increased low and intermediated multimers, distinct from both type 2M and 2A. Densitometric representation of peaks from left to right, with peaks 1 to 3 being low molecular weight, peaks 4 to 7 being intermediate molecular weight, and all other peaks representing high molecular weight multimers. Gray, a pool of normal samples; pink, sample test.
Figure 3.
Figure 3.
Underlying mechanism in patients with VWD type 2A, 2M, and 2M/2A. (A-B) VWF synthesis and secretion were evaluated with FVIII:C/VWF:Ag ratio and VWFpp antigen. (C) VWF-enhanced clearance was assessed by VWFpp/VWF:Ag ratio. Red indicates type 2A VWD; green indicates type 2M VWD; and blue indicates cases with p.R1315L, p.R1374H, and p.R1374C.
Figure 4.
Figure 4.
Structure of wt A1-A2 domains and radius of gyration (ROG) and root mean square deviation (RMSD) analysis. (A) Final structure of wt A1-A2 after the Langevin dynamics simulation in cartoon (above) and in molecular surface (below) representation. Domains A1 and A2 are respectively reported in blue and in red, the 1465 to 1494 linker is reported in gray. The residues 1315 and 1374 are reported as green sticks. Analysis shows (B) ROG and (C) RMSD distributions of wt A1-A2 (black) and its mutants (p.R1315C, red; p.R1315L, green; p.R1374C, blue; and p.R1374H, yellow): the single aminoacid comparisons are reported in the small images flanking the global overlap.
Figure 5.
Figure 5.
Alpha carbon (Ca) root mean square fluctuations (RMSF) in wt A1-A2 and A1-A2 mutants. (A) Alpha carbon (Ca) RMSF differences between the ones of A1-A2 mutants (p.R1315C, red; p.R1315L, green; p.R1374C, blue; and p.R1374H, yellow) and the ones of wt A1-A2. (B) The largest differences (residues 1345-1355 and residues 1478-1488) are reported on the reference structure of wt A1-A2 alongside the position of mutated residues (lime/orange sticks). The original RMSF values are reported in the supplemental Figure 6. (C) Contacts between A1 and D3 domains of VWF in the context of tubule structure (reference structure: PDB ID 8D3D; the experimental cryogenic electron microscopy data are reported from the RCSB-PDB on the left together with domains). The A1 domain and its residues 1345-1355 are reported in blue, D3 domain and its residues 895-902, 988-999 and 1007-1013 are evidenced in yellow. Residues 344-371 belonging to the VWF (ie, within 0.75 nm of the surfaces of the A1 and D3 domains) without domain assignment are highlighted in brown. Van der Waals surfaces have been used for representing single residues.
Figure 6.
Figure 6.
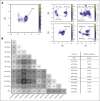
Principal component analysis (PCA) of the molecular dynamics (MD) trajectory of the wt A1-A2 and its mutants. (A) PCA of the MD trajectory of the wt A1-A2 and its 4 mutants (p.R1315C, p.R1315L, p.R1374C, p.R1374H). The principal components 1 and 2 have been used and the density of points has been reported as heat maps (see “Materials and methods” for further details). The most populated centroids have been explicitly indicated. (B) RMSDs between the backbone atoms of PCA-derived centroids. The darkest colors correspond to the highest RMSD values, lightest colors to the lowest RMSD values. The numbers in the box correspond to the values of RMSDs expressed in Å.

References

    1. Rodeghiero F, Castaman G, Dini E. Epidemiological investigation of the prevalence of von Willebrand’s disease. Blood. 1987;69(2):454–459. - PubMed
    1. Werner EJ, Broxson EH, Tucker EL, Giroux DS, Shults J, Abshire TC. Prevalence of von Willebrand disease in children: a multiethnic study. J Pediatr. 1993;123(6):893–898. - PubMed
    1. Bowman M, Hopman W, Rapson D, Lillicrap D, James P. The prevalence of symptomatic von Willebrand disease in primary care practice. J Thromb Haemostasis. 2010;8(1):213–216. - PubMed
    1. Bloom AL. Elsevier; 1991. von Willebrand factor: clinical features of inherited and acquired disorders. Mayo Clinic Proceedings; 1991; pp. 743–751. - PubMed
    1. Seidizadeh O, Cairo A, Baronciani L, Valenti L, Peyvandi F. Population-based prevalence and mutational landscape of von Willebrand disease using large-scale genetic databases. NPJ Genom Med. 2023;8(1):31. - PMC - PubMed

Publication types

MeSH terms

Substances