. 2024 Feb 5;7(4):e202302529.
doi: 10.26508/lsa.202302529. Print 2024 Apr.

Stability of gut microbiome after COVID-19 vaccination in healthy and immuno-compromised individuals

Affiliations

Stability of gut microbiome after COVID-19 vaccination in healthy and immuno-compromised individuals

Rebecca H Boston et al. Life Sci Alliance. .

Abstract

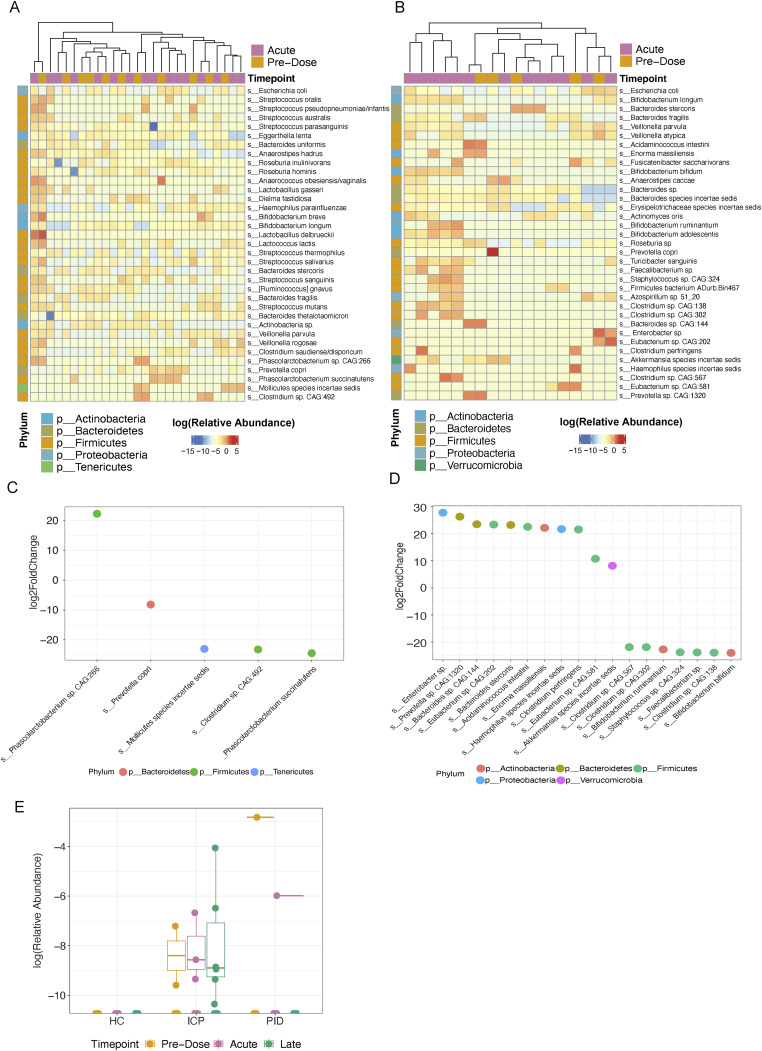
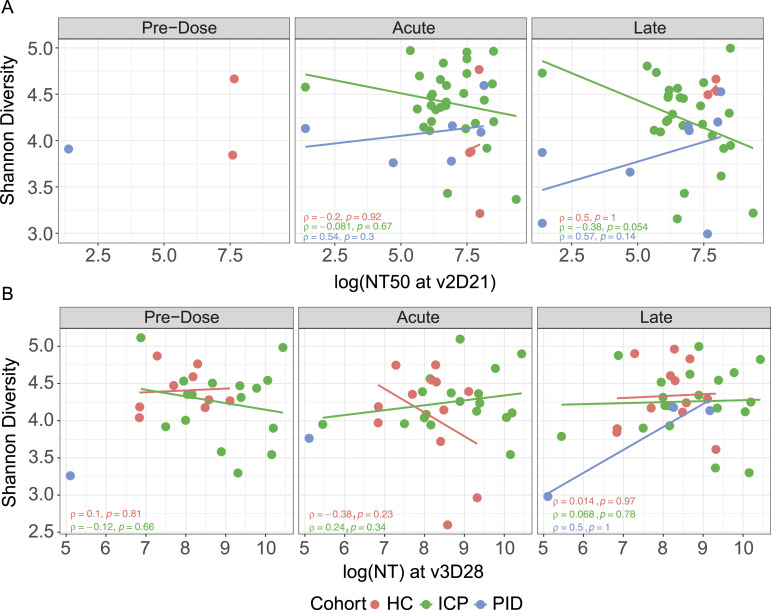
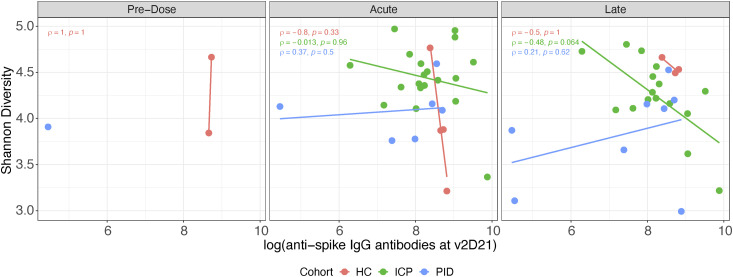
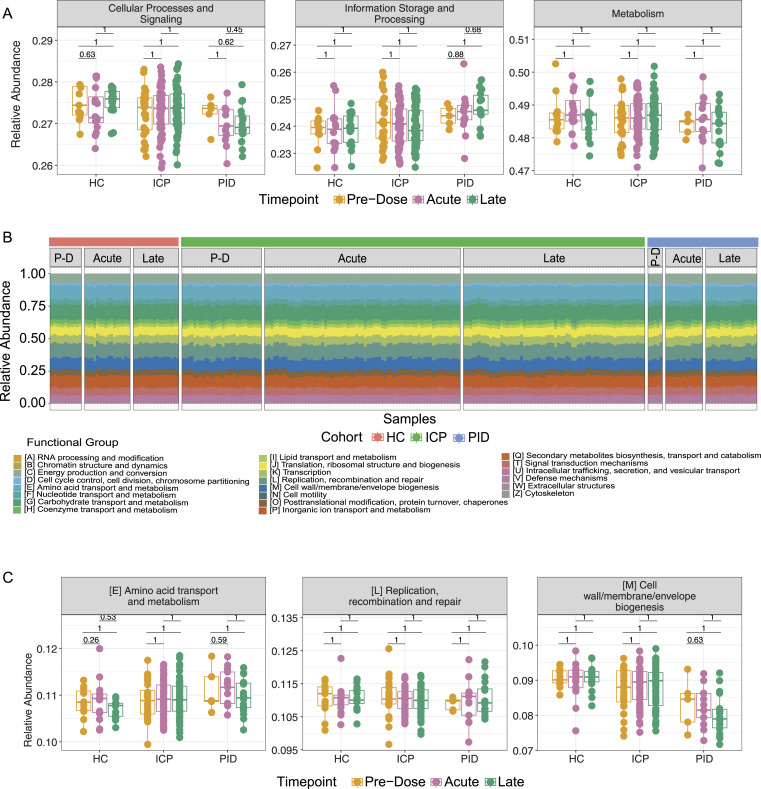
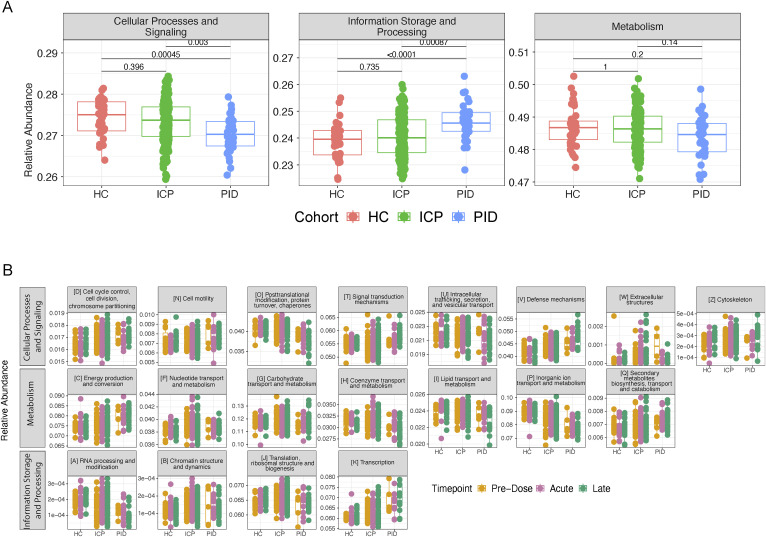
Bidirectional interactions between the immune system and the gut microbiota are key contributors to various physiological functions. Immune-associated diseases such as cancer and autoimmunity, and efficacy of immunomodulatory therapies, have been linked to microbiome variation. Although COVID-19 infection has been shown to cause microbial dysbiosis, it remains understudied whether the inflammatory response associated with vaccination also impacts the microbiota. Here, we investigate the temporal impact of COVID-19 vaccination on the gut microbiome in healthy and immuno-compromised individuals; the latter included patients with primary immunodeficiency and cancer patients on immunomodulating therapies. We find that the gut microbiome remained remarkably stable post-vaccination irrespective of diverse immune status, vaccine response, and microbial composition spanned by the cohort. The stability is evident at all evaluated levels including diversity, phylum, species, and functional capacity. Our results indicate the resilience of the gut microbiome to host immune changes triggered by COVID-19 vaccination and suggest minimal, if any, impact on microbiome-mediated processes. These findings encourage vaccine acceptance, particularly when contrasted with the significant microbiome shifts observed during COVID-19 infection.


Conflict of interest statement

The authors declare that they have no conflict of interest.

Figures

Figure S1.
Figure S1.. Participant gut microbiome sampling across three doses of COVID-19 vaccinations (V1, vaccine dose 1; V2, vaccine dose 2; and V3, vaccine dose 3) from the different cohorts: healthy control, immune-checkpoint therapy-treated cancer patients, or patients with primary immunodeficiencies.
Figure 1.
Figure 1.. The composition of the gut microbiome remains unaltered after COVID-19 vaccination.
(A) 59 patients were recruited for longitudinal analysis of the effect of the vaccines against COVID-19. Samples were assigned to one of three cohorts, healthy control, immune-checkpoint therapy treated cancer patients (ICP), or patients with primary immunodeficiencies (PID). Blood samples were analysed for their live-virus neutralisation capacity and quantifying the amount of anti-spike IgG antibodies, whilst fecal samples were analysed with shotgun metagenomics for taxonomic and functional annotations. (B) Diversity measures of chao1 and Shannon assessed in fecal samples taken from different vaccine timepoints, from within healthy control, ICP and patients with PID. Statistical testing performed using Wilcoxon test and adjusted for multiple testing using Bonferroni correction. (C) Principal component (PC) analysis at the operational taxonomic unit level. Each dot represents a unique sample from within each cohort (shapes) taken at unique timepoints after vaccination (colours). (D) Relative abundance at the phyla taxonomic level depicted by colours of each of the bars, from samples taken from each of the cohorts (HC, ICP, and PID), separated by the vaccine timepoints from which the sample was taken; PD, Pre-Dose, Acute, and Late. (E) Relative abundance of the six most prevalent phyla in patient samples from within each of the cohorts and separated by the vaccine timepoint from which the sample was taken. Statistical testing performed using Wilcoxon test and adjusted for multiple testings using Bonferroni correction. (N = 43 HC, 160 ICP, and 36 PID).
Figure S2.
Figure S2.. Gut microbiome compositional differences are evident between cohorts but not vaccine timepoints.
(A) Alpha diversity measures of chao1 and Shannon diversity in samples from different cohorts, healthy control, immune-checkpoint therapy-treated cancer patients (ICP), or patients with primary immunodeficiencies (PID) (N = 43 HC, 160 ICP, and 36 PID). (B) Paired analysis of the alpha diversity measures of patient samples taken from different vaccine timepoints from each of our cohorts (N = 40 HC, 153 ICP, and 31 PID). (C) Reported P-values of the linear model comparing baseline model of fixed patient effects on the explained variance, to the model using the vaccine timepoints of the patient samples as random effects when using the principal components (PC) (healthy controls [HCs], ICP, PID). (D) Relative abundance of the six most prevalent phyla in our patient samples from within each of our patient cohorts and separated by the vaccine timepoint from which the sample was taken (N = 43 HC, 160 ICP, and 36 PID). (E) Paired analysis of the six most prevalent phyla in our patient samples taken from different vaccine timepoints from each of our cohorts (N = 40 HC, 153 ICP, and 31 PID). (F) Volcano plot of the paired relative phylum abundance between two timepoints across all pair combinations unique to different vaccine doses and different cohorts. Colours represent the significance indicated in the legend. Statistical testing within figures was performed using Wilcoxon test and adjusted for multiple testing using bonferonni, paired where appropriate.
Figure 2.
Figure 2.. Bacterial species demonstrate minimal change attributable to the COVID-19 vaccines.
(A) Differential abundance analysis using DESeq2 of relative abundance of the top 35 differential species between samples taken at pre-dose (N = 29) and acutely (N = 69) after vaccination. (B) Log2 fold-change of the significant differential abundant species taken from the DESeq2 analysis. (C) Relative abundance of Klebsiella pneumoniae in ICP cohort samples. (D) Relative abundance of Butyrivibrio crossotus in ICP cohort samples. (E) Relative abundance of the top 15 abundant species within the ICP cohort taken at each of the vaccine timepoints (N = 43 HC, 160 ICP, and 36 PID). (F, G, H) Relative abundance of various bacterial species correlated with immune-related diseases: Faecalibacterium prausnitzii (F), Akkermansia muciniphila (G), and Escherichia coli (H) within patient samples taken at each vaccine timepoint. Statistical testing performed using Wilcoxon test and adjusted for multiple testing using Bonferroni correction. (N = 43 HC, 160 ICP, and 36 PID).
Figure S3.
Figure S3.. Differential abundance analysis of HC and PID cohort samples taken at pre-dose and acutely after COVID-19 vaccination.
(A, B, C, D) DESeq analysis of HC cohort (N = 11 Pre-Dose, 16 Acute) and PID cohort (N = 5 Pre-Dose, 13 Acute) (B), along with corresponding log2FoldChange of significantly different bacterial species between pre-dose and acute samples in HC samples (C) and PID samples (D), colours represent different phyla. (E) Relative abundance of Enterobacter sp. in our cohorts.
Figure 3.
Figure 3.. Vaccine efficacy is not correlated with the gut microbiome diversity.
Live-virus neutralisation capacity (NT) assessed against Shannon diversity of fecal samples, each point represents a different sample taken at one of the three vaccine timepoints. Colours represent cohorts, within healthy control, immune-checkpoint therapy-treated cancer patients (ICP) and patients with primary immunodeficiencies (PID). Correlated vaccine response through neutralisation capacity of patient serum taken at the peak of the second dose (v2D21) (N = 9 HC, 57 ICP, and 15 PID). (A) or third dose (v3D28) (N = 33 HC, 54 ICP, and 5 PID). (B) rho and P-values from Spearman’s Rank correlation testing displayed.
Figure S4.
Figure S4.. Absence of correlation between vaccine efficacy and gut microbiome composition.
Second dose anti-spike IgG antibody levels assessed against Shannon diversity of fecal samples; each point represents a different sample taken at one of the three vaccine timepoints. Colours represent cohorts, within healthy control, ICP and patients with PID. rho and P-values from Spearman correlation testing displayed (N = 9 HC, 35 ICP, and 15 PID).
Figure 4.
Figure 4.. Functional capacity of microbiome samples are not altered by the COVID-19 vaccines.
(A) The relative abundance of the highest functional annotation level using the EGGNOG database within patient samples at different vaccine timepoints in each of our patient cohorts. (B) Functional composition depicted by colours of each of the bars, from samples taken from each of the cohorts (HC, ICP, and PID), separated by the vaccine timepoints from which the sample was taken; PD, Pre-Dose, Acute, and Late. (C) Relative abundance of the three most abundant functional annotations in our patient samples from within each of our patient cohorts and separated by the vaccine timepoint from which the sample was taken. Statistical testing performed using Wilcoxon test and adjusted for multiple testing using Bonferroni correction (N = 43 HC, 160 ICP, and 36 PID).
Figure S5.
Figure S5.. Functional annotation differences between cohorts, but not between vaccine timepoints.
(A) The relative abundance of the highest functional annotation level within patient samples from different patient cohort (HC, ICP, and PID), separated by the vaccine timepoints from which the sample was taken. (B) Relative abundance of the remaining 19 out of a possible 22 functional annotations in our patient samples from within each of our patient cohorts and separated by the vaccine timepoint from which the sample was taken. Statistical testing performed using Wilcoxon test and adjusted for multiple testing using FDR (N = 43 HC, 160 ICP, and 36 PID).

References

    1. WHO (2023) WHO Coronavirus (COVID-19) Dashboard. Available at: https://covid19.who.int
    1. Lind ML, Dorion M, Houde AJ, Lansing M, Lapidus S, Thomas R, Yildirim I, Omer SB, Schulz WL, Andrews JR, et al. (2023) Evidence of leaky protection following COVID-19 vaccination and SARS-CoV-2 infection in an incarcerated population. Nat Commun 14: 5055. 10.1038/s41467-023-40750-8 - DOI - PMC - PubMed
    1. Jennings W, Valgarðsson V, McKay L, Stoker G, Mello E, Baniamin HM (2023) Trust and vaccine hesitancy during the COVID-19 pandemic: A cross-national analysis. Vaccin X 14: 100299. 10.1016/j.jvacx.2023.100299 - DOI - PMC - PubMed
    1. Bellamkonda N, Lambe UP, Sawant S, Nandi SS, Chakraborty C, Shukla D (2022) Immune response to SARS-CoV-2 vaccines. Biomedicines 10: 1464. 10.3390/biomedicines10071464 - DOI - PMC - PubMed
    1. Bergamaschi C, Terpos E, Rosati M, Angel M, Bear J, Stellas D, Karaliota S, Apostolakou F, Bagratuni T, Patseas D, et al. (2021) Systemic IL-15, IFN-gamma, and IP-10/CXCL10 signature associated with effective immune response to SARS-CoV-2 in BNT162b2 mRNA vaccine recipients. Cell Rep 36: 109504. 10.1016/j.celrep.2021.109504 - DOI - PMC - PubMed

Publication types

Substances