. 2024 Feb 13;38(1-2):70-94.
doi: 10.1101/gad.350740.123.

DNA damage remodels the MITF interactome to increase melanoma genomic instability

Affiliations

DNA damage remodels the MITF interactome to increase melanoma genomic instability

Romuald Binet et al. Genes Dev. .

Abstract

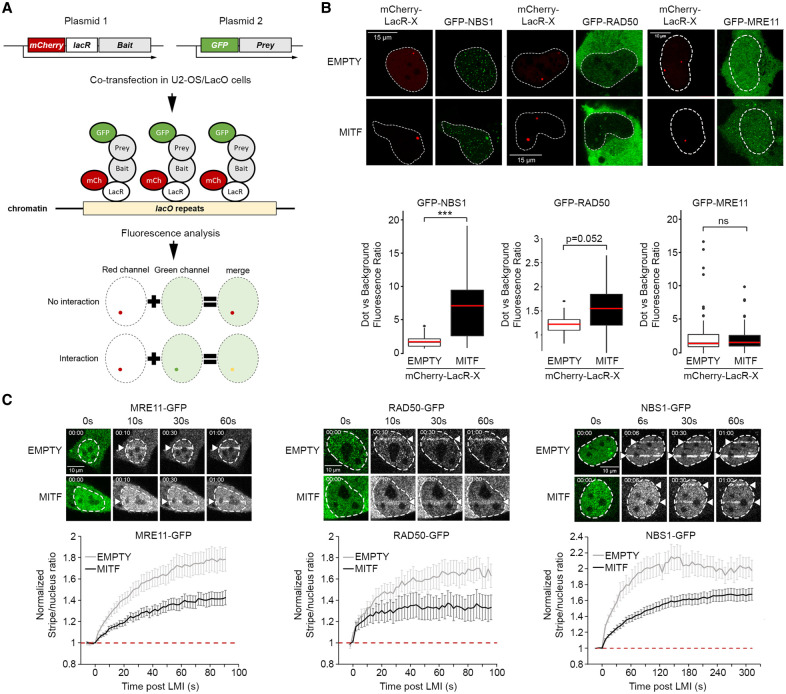
Since genome instability can drive cancer initiation and progression, cells have evolved highly effective and ubiquitous DNA damage response (DDR) programs. However, some cells (for example, in skin) are normally exposed to high levels of DNA-damaging agents. Whether such high-risk cells possess lineage-specific mechanisms that tailor DNA repair to the tissue remains largely unknown. Using melanoma as a model, we show here that the microphthalmia-associated transcription factor MITF, a lineage addition oncogene that coordinates many aspects of melanocyte and melanoma biology, plays a nontranscriptional role in shaping the DDR. On exposure to DNA-damaging agents, MITF is phosphorylated at S325, and its interactome is dramatically remodeled; most transcription cofactors dissociate, and instead MITF interacts with the MRE11-RAD50-NBS1 (MRN) complex. Consequently, cells with high MITF levels accumulate stalled replication forks and display defects in homologous recombination-mediated repair associated with impaired MRN recruitment to DNA damage. In agreement with this, high MITF levels are associated with increased single-nucleotide and copy number variant burdens in melanoma. Significantly, the SUMOylation-defective MITF-E318K melanoma predisposition mutation recapitulates the effects of DNA-PKcs-phosphorylated MITF. Our data suggest that a nontranscriptional function of a lineage-restricted transcription factor contributes to a tissue-specialized modulation of the DDR that can impact cancer initiation.

Keywords: DNA damage repair; DNA replication; E318K; MITF; NBS1; SUMOylation; homologous recombination; melanoma; replication stress.


Figures

Figure 1.
Figure 1.
MITF associates with mutational burden and replication stress. (A) Box plots showing the distribution of single-nucleotide variants (SNVs) per bin (top) and the distribution of copy number variations (CNVs) per bin (bottom) from 428 melanoma samples from ICGC, plotted after log transformation computed as log10(0.1+SNV) in five bins by their MITF expression value. The P-value was computed using the paired Wilcoxon rank sum test. Medians are indicated in red. (B, top) Description of the differentiation process from hPSCs to melanoblasts and melanocytes (created with BioRender.com). (Middle and bottom) Total copy number log ratio (logR) of melanoblasts (middle) and melanocytes (bottom). The orange horizontal line indicates the inferred diploid state, and red lines show copy number segments along each chromosome. Melanoblasts display a flat profile, indicating no copy number alterations, whereas melanocytes show copy number alterations on chromosomes 1, 7, and 10. (C, top) Timeline of the DNA fiber experiment. Cells were transfected for 48 h before being treated sequentially for 30 min with BrdU and for 30 min with EdU, before DNA extraction. (Bottom) Examples of patterns used to quantify the percentage of stalled forks, ongoing forks, and new origins in the DNA fiber assay. BrdU-containing fibers are stained red, and EdU-containing fibers are stained green. (D) Graph expressing the percentage of ongoing forks (OF) plus new origins (NO) and stalled replication forks (SF) in 501mel cells transfected with siMITF (black) or the nontargeting siRNA (gray). The P-value was determined using Fisher's exact test. For siMITF, P = 9.453417 × 10⁻⁶. (E) Immunofluorescence analysis of the accumulation of ssDNA in 501mel cells transfected with siMITF (gray) of the nontargeting siRNA (black). Cells incorporated BrdU for 24 h and were treated with 10 µM camptothecin (CPT) for 1 h. ssDNA foci were detected using an anti-BrdU antibody. (Left) Bee swarm plots representing the quantification of the number of BrdU foci. The P-value was computed using the Wilcoxon rank sum test. For siMITF, P = 1.442 × 10⁻⁶. The medians are indicated in red. (Right) Representative images of ssDNA staining. Scale bar, 5 μm. (F) Immunofluorescence analysis of the accumulation of ssDNA after CPT treatment in HEK293 and 501mel cells transfected with HA-MITF or the corresponding empty vector. All cells had incorporated BrdU for 24 h and were treated with 10 µM camptothecin (CPT) for 1 h. ssDNA foci were detected using an anti-BrdU antibody. (Left) Bee swarm plots representing the quantification of the number of BrdU foci. The P-values were computed using the Wilcoxon rank sum test. For HEK293, P = 0.002372; for 501mel, P = 6.014 × 10⁻⁶. The medians are indicated in red. (Right) Representative images of ssDNA staining in HEK293 and 501mel cells as indicated. Scale bars, 5 μm. (G) Graph expressing the percentage of ongoing forks (OF) plus new origins (NO) and stalled replication forks (SF) in HEK293 cells overexpressing MITF WT (black) or the corresponding empty vector (gray). P-values were determined using Fisher's exact test. For MITF WT, P = 0.0109008. (H) Graph expressing the percentage of ongoing forks (OF) plus new origins (NO) and stalled replication forks (SF) in 501mel cells overexpressing MITF WT (black), ΔR217 (blue), or the corresponding empty vector (gray). P-values were determined using Fisher's exact test. For MITF WT, P = 2.461506 × 10⁻⁶; for del217, P = 1.960337 × 10⁻¹⁹. (I) Diagram depicting the position of the basic domain of MITF and the ΔR217 deletion.
Figure 2.
Figure 2.
MITF-positive cells are sensitive to different types of DNA damage. (A) Immunofluorescence analysis of γH2AX activation in HEK293 cells transfected with HA-MITF (black) or the corresponding empty vector (gray). Cells were exposed to 24 J/m2 UV or treated for 2 h with 10 µM camptothecin (CPT) or 300 ng/mL cisplatin (CisPt). Bee swarm plots represent the distribution of γH2AX intensities per cells. The P-values were computed using the Wilcoxon rank sum test. (****) P < 0.0001. The medians are indicated in red. (B) Immunofluorescence analysis of γH2AX activation over time after 24 J/m2 UV irradiation. HEK293 cells were transfected with HA-MITF (black) or the corresponding empty vector (gray). (Left) Representative images. Scale bar, 40 μm. (Right) Box plots representing the distribution of γH2AX intensities per cells. The P-values were computed using the Wilcoxon rank sum test. (*) P < 0.05, (***) P < 0.001, (****) P < 0.0001. The medians are indicated in red. (C) Immunofluorescence analysis of γH2AX activation over time after 24 J/m2 UV irradiation. HEK293 cells were transfected with HA-MITF (black), the ΔR217 mutant (blue), or the corresponding empty vector (gray). (Left) Representative images. Scale bar, 100 μm. (Right) Box plots representing the distribution of γH2AX intensities per cells. The P-values were computed using the Wilcoxon rank sum test. (**) P < 0.01, (****) P < 0.0001. The medians are indicated in red. (D) Western blot of HEK293 cells transfected with HA-tagged MITF WT, the ΔR217 mutant, or the control vector and exposed to 100 J/m2 UV. GAPDH was used as a loading control. (E) Western blot of melanoma cell lines exposed to 100 J/m2 UV and harvested at the indicated times. Phospho-ATM was used as a DDR activation control, and GAPDH was used as a loading control. (F) Immunofluorescence analysis of the formation of RAD51 foci after 2 Gy of IR (X-rays) in U2-OS cells transfected with HA-MITF or the corresponding empty vector. Cells were fixed and processed at the indicated times after IR. (Left) Representative images. Scale bar, 20 μm. (Right) Box plots representing the distribution of the number of RAD51 foci per cell. The P-values were computed using the Wilcoxon rank sum test. (****) P < 0.0001. The medians are indicated in red. (G) Immunofluorescence analysis of the formation of 53BP1 foci after 2 Gy of IR (X-rays) in U2-OS cells transfected with HA-MITF or the corresponding empty vector. Cells were fixed and processed at the indicated times after IR. (Left) Representative images. Scale bar, 20 μm. (Right) Box plots representing the distribution of the number of 53BP1 foci per cell. The P-values were computed using the Wilcoxon rank sum test. (***) P < 0.001, (****) P < 0.0001. The medians are indicated in red. (H) Cartoon depicting the principle of the U2-OS-DR-GFP reporter system. (I, left) Graph showing the relative efficiency of homologous recombination using the U2-OS-DR-GFP reporter system. Data represent the mean (±SEM) from three independent experiments and are normalized against the I-SceI-only samples. The P-values were computed using the Wilcoxon rank sum test. (ns) Nonsignificant, (**) P < 0.01. (Right): Western blot of U2-OS-DR-GFP reporter cells transfected with MITF WT, the ΔR217 mutant, or the control vector. GAPDH was used as a loading control. (J) Western blot of FLAG-MITF induction with doxycycline. GAPDH was used as a loading control. (K) Timeline of the experiment. Cells were induced with doxycycline for 4 h before being exposed to 24 J/m2 UV. Immunofluorescence analysis was performed after 24 h. (L) Immunofluorescence analysis of the persistence of 53BP1 foci (red) in FLAG-MITF-expressing cells (green). Scale bar, 30 μm. Violin plot representing the distribution of the number of 53BP1 foci per cells in inducible HEK293 cells expressing FLAG-MITF (gray) or the corresponding empty FLAG (white) 24 h after being exposed to UV. The P-values were computed using the Wilcoxon rank sum test. (ns) Nonsignificant, (****) P < 0.0001. The medians are indicated in red.
Figure 3.
Figure 3.
The MITF interactome is remodeled by DNA damage. (A) Dot plot of BioID data showing the significant proximity partners of MITF in nontreated versus CPT-treated HEK293 cells. The color of the dots represents the average spectral count. The size of the dots represents the relative abundance between conditions. The gray intensity of the line encircling the dots represents the Bayesian false discovery rate (BFDR) cutoff. Association with any of the six categories (DNA replication and recombination, RNA processing, ubiquitin system, chromatin, transcription, and membrane trafficking) is depicted by the colored lines at the right of each box. Components of the MRN complex are indicated in red. (B) Diagram representing the BioID results according to the effect of CPT on MITF interaction. Where possible, proteins from A were classified using the KEGG BRITE database (https://www.kegg.jp) and information from UniProt (https://www.uniprot.org) into six categories (transcription regulation, chromatin regulators, RNA processing, ubiquitin system, membrane trafficking, and DNA replication and recombination) and segregated into columns highlighting (from left to right) a decreased, unchanged, or increased interaction with MITF after CPT treatment. Components of the MRN complex are indicated in red.
Figure 4.
Figure 4.
(A) Cartoon depicting the nuclear tethering assay. (B) Representative images and quantification of the nuclear tethering assay showing interaction between MITF and NBS1, RAD50, or MRE11. (Top) The left panels show the localization of mCherry-LacR-NLS or mCherry-LacR-MITF dots in the nuclei of U2OS-LacO#13 cells, and the right panels show GFP-NBS1, GFP-RAD50, and GFP-MRE11. Scale bar, 15 μm. (Bottom) The quantification is expressed as the ratio between the GFP fluorescence measured inside the area delimited by the mCherry dot and in the rest of the nucleus. The P-values were computed using the Wilcoxon rank sum test. (ns) Nonsignificant, (***) P < 0.001. The medians are indicated in red. (C, top) Still images of MRE11-GFP, RAD50-GFP, and NBS1-GFP LMI. Nuclei are delimited using the preirradiation images. The positions of the irradiated lines are indicated with an arrowhead. Scale bar, 10 μm. (Bottom) Quantification of MRE11-GFP, RAD50-GFP, and NBS1-GFP recruitment in U2-OS cells after LMI when cotransfected with an empty vector or HA-MITF. The graphs represent the mean ± SEM of the stripe/nucleus ratio over time. Values were normalized against the pre-LMI measurements. The baselines are indicated with red dotted lines.
Figure 5.
Figure 5.
MITF recruitment to DNA damage sites. (A) Immunofluorescence of stable 501mel⋅HA-MITF cells after UV-LMI. The irradiated area was identified using an anti-γH2AX antibody (red) and MITF using anti-HA (green). Scale bar, 40 μm. (B) Immunofluorescence of stable 501mel⋅HA-MITF cells after NIR-LMI. The irradiated area was identified using an anti-γH2AX antibody (red). MITF was detected with an anti-HA antibody (green). DAPI was used to stain the nuclei. Scale bar, 20 μm. (C) Still images and quantification of live video microscopy showing recruitment of MITF in 501mel cells stably expressing GFP-MITF after NIR-LMI. Cells were treated with DNA-PK (1 µM NU7441) or PARP (10 µM olaparib) inhibitors for 24 h before irradiation. Scale bar, 10 μm. The graphs represent the mean ± SEM of the stripe/nucleus ratio over time. Values were normalized against the pre-LMI measurements. For clarity, each individual graph represents the same control curve (black) against only one type of inhibitor (DNAPKi [turquoise] or PARPi [pink]). The baselines are indicated with red dotted lines. (D, top) Diagram depicting the position of the bHLH-LZ domain of MITF and the position of the SUMOylation sites K182 and K316 (green), the phosphorylation site S325 (red), and the familial mutation E318K (blue). (Bottom) Sequence of the 314–333 peptides showing that residues K316, E318, and S325 are conserved from humans to zebrafish. (E) Western blot of HEK293 cells transiently transfected with the indicated mutants of HA-MITF or the corresponding empty vector. Phosphorylation of MITF on serine 325 was detected by a phospho-specific antibody. GAPDH was used as a loading control. (F) In vitro kinase assay performed on a peptide array. Peptide-bound anti-pS325 antibodies were detected using chemiluminescence. The size and intensity of the dots are proportional to the amount of bound antibodies. The kinases used are indicated above. (G) Western blot of HEK293 cells transiently transfected with HA-MITF. Cells were UV-irradiated and harvested at different time points to measure phosphorylation of S325. The ATM inhibitor KU55933 was used to confirm the role of the kinase. GAPDH was used as a loading control. (H, left) Still images of GFP-MITF recruitment in 501mel cells stably expressing GFP-MITF WT and S325 and E318 mutants after LMI. Nuclei were delimited using the preirradiation images. The positions of the irradiated lines are indicated with arrowheads. Scale bar, 10 μm. (Right) Quantification. The graph represents the mean ± SEM of the stripe/nucleus ratio over time. Values were normalized against the pre-LMI measurements. The baseline is indicated with a red dotted line. (I) Still images of GFP-MITF behavior in 501mel cells stably expressing GFP-MITF wild type and S325 and E318 mutants after LMI as quantified in J and K. Nuclei were delimited using the preirradiation images. Scale bar, 10 μm. (J) Details of GFP-MITF behavior in 501mel cells stably expressing GFP-MITF WT and S325 and E318 mutants after LMI. Quantification of GFP intensities at (stripes) and away from (nuclei) the LMI sites. The graph represents the mean ± SEM of GFP fluorescence over time. Values were normalized against the pre-LMI measurements. The dotted lines represent the key values as described in K. The baselines are indicated with red dotted lines. (K) Key values extracted from the quantification in J. “Stripe—time ≥100% intensity” represents the time GFP fluorescence remained ≥1 after LMI, “stripe—time to decrease to 80% intensity” represents the time required to see the GFP intensity at the stripe drop to 80% of the pre-LMI value from the time of irradiation, “stripe—from 100% to 80%” represents the time required to see the GFP intensity at the stripe drop to 80% of the pre-LMI value after it started to decrease, and “nucleus—time to decrease to 70% intensity” represents the time required to see the GFP intensity away from the stripe drop to 70% of the pre-LMI value.
Figure 6.
Figure 6.
The effects of S325 and E318 mutations on MITF-mediated genome instability. (A) Immunofluorescence images (top) and quantification (bottom) of the formation of RAD51 foci after 2 Gy of IR (X-rays) in U2-OS cells transfected with HA-MITF WT (gray/black), S325A (purple), S235E (gold), or E318K (red) or the corresponding empty vector (white). Cells were fixed and processed at the indicated times after IR. Scale bar, 30 μm. The P-values were computed using the paired Wilcoxon rank sum test. (ns) Nonsignificant, (*) P < 0.05, (**) P < 0.01, (****) P < 0.0001. The medians are indicated in red. (B, left) Still images of MRE11-GFP LMI in the presence of MITF WT and E318K and ΔBasic mutants or the corresponding empty vector. Nuclei are delimited using the preirradiation images. The positions of the irradiated lines are indicated with arrowheads. Scale bar, 10 μm. (Right) Quantification of MRE11-GFP recruitment. The graph represents the mean ± SEM of the stripe/nucleus ratio over time. Values were normalized against the pre-LMI measurements. The baseline is indicated with a red dotted line. (C, left) Still images of MRE11-GFP LMI in the presence of MITF WT or S325A or S325E mutants. Nuclei are delimited using the preirradiation images. The positions of the irradiated lines are indicated with arrowheads. Scale bar, 10 μm. (Right) Quantification MRE11-GFP recruitment. The graph represents the mean ± SEM of the stripe/nucleus ratio over time. Values were normalized against the pre-LMI measurements. The baseline is indicated with a red dotted line. (D,E) Nuclear tethering assay showing the effects of MITF (D) and MITF-E318K (E) on the NBS1/MRE11 or RAD50/MRE11 interactions. The quantification is expressed as the ratio between the GFP fluorescence measured inside the area delimited by the mCherry dot and in the rest of the nucleus. Scale bars: D, 5 μm; E, 10 μm. The P-values were computed using the Wilcoxon rank sum test. (ns) Nonsignificant, (**) P < 0.01. The medians are indicated in red. (F) Graph expressing the percentage of ongoing forks (OF)/new origins (NO) and stalled replication forks (SF) in 501mel cells overexpressing MITF WT (black) or E318K (red) or the corresponding empty vector (gray). P-values were determined using Fisher's exact test. For MITF WT, P = 2.461506 × 10⁻⁶; for E318K, P = 1.605343 × 10⁻²⁰. Empty HA and MITF WT are the same as in Figure 1H. (G) Graph expressing the percentage of ongoing forks (OF)/new origins (NO) and stalled replication forks (SF) in 501mel cells overexpressing MITF WT (black), S325A (purple), or S325E (gold) or the corresponding empty vector (gray). P-values were determined using Fisher's exact test. For MITF WT, P = 6.942773 × 10⁻⁷; for S325A, P = 6.332160 × 10⁻²; for S325E, P = 2.172679 × 10⁻⁷. (H) GFP-TRAP experiment in HEK293 cells transfected with GFP-MITF WT or MITF K316R, K316R/S325A, or E318K mutants and exposed to 100 J/m2 UV. An anti-phospho-SQ antibody was used to measure MITF phosphorylation after immunoprecipitation. Ten percent of the protein extract was kept as input.
Figure 7.
Figure 7.
The impact of MITF expression on DNA damage repair. (I) In cells that do not express MITF, the MRN complex senses DNA damage, binds to DSBs, and then activates ATM to amplify the DDR and trigger a CHK2-dependent cell cycle arrest and DNA repair by HRR. (II) In melanocytes and melanoma cells, MITF is rapidly phosphorylated by DNA-PK and interacts with NBS1–RAD50 but not MRE11, destabilizing the MRN complex. As a result, the rate of MRN recruitment is decreased, slowing down HR-mediated repair and promoting the formation of SNVs/CNVs. The delay in MRN recruitment is emphasized in cells expressing the mutated MITF-E318K. (III) Subsequently, MITF is rapidly degraded, releasing its transcription cofactors, which results in cell cycle entry and proliferation of SNV-harboring melanocytes/melanoma cells. Later, UV-activated MC1R signaling restores MITF expression, promoting a differentiation program characterized by the expression of pigmentation and survival genes. Elevated melanocyte numbers combined with increased pigment production will provide robust protection against future UV-mediated DNA damage.

References

    1. Ahrabi S, Sarkar S, Pfister SX, Pirovano G, Higgins GS, Porter AC, Humphrey TC. 2016. A role for human homologous recombination factors in suppressing microhomology-mediated end joining. Nucleic Acids Res 44: 5743–5757. 10.1093/nar/gkw326 - DOI - PMC - PubMed
    1. Bacharach-Buhles M, Lubowietzki M, Altmeyer P. 1999. Dose-dependent shift of apoptotic and unaltered melanocytes into the dermis after irradiation with UVA 1. Dermatology 198: 5–10. 10.1159/000018056 - DOI - PubMed
    1. Baggiolini A, Callahan SJ, Montal E, Weiss JM, Trieu T, Tagore MM, Tischfield SE, Walsh RM, Suresh S, Fan Y, et al. 2021. Developmental chromatin programs determine oncogenic competence in melanoma. Science 373: eabc1048. 10.1126/science.abc1048 - DOI - PMC - PubMed
    1. Beck M, Schmidt A, Malmstroem J, Claassen M, Ori A, Szymborska A, Herzog F, Rinner O, Ellenberg J, Aebersold R. 2011. The quantitative proteome of a human cell line. Mol Syst Biol 7: 549. 10.1038/msb.2011.82 - DOI - PMC - PubMed
    1. Beishline K, Kelly CM, Olofsson BA, Koduri S, Emrich J, Greenberg RA, Azizkhan-Clifford J. 2012. Sp1 facilitates DNA double-strand break repair through a nontranscriptional mechanism. Mol Cell Biol 32: 3790–3799. 10.1128/MCB.00049-12 - DOI - PMC - PubMed

Publication types

Substances