. 2024 Mar 13;44(11):e0784232024.
doi: 10.1523/JNEUROSCI.0784-23.2024.

Transcranial Low-Intensity Focused Ultrasound Stimulation of the Visual Thalamus Produces Long-Term Depression of Thalamocortical Synapses in the Adult Visual Cortex

Affiliations

Transcranial Low-Intensity Focused Ultrasound Stimulation of the Visual Thalamus Produces Long-Term Depression of Thalamocortical Synapses in the Adult Visual Cortex

Lukas Mesik et al. J Neurosci. .

Abstract

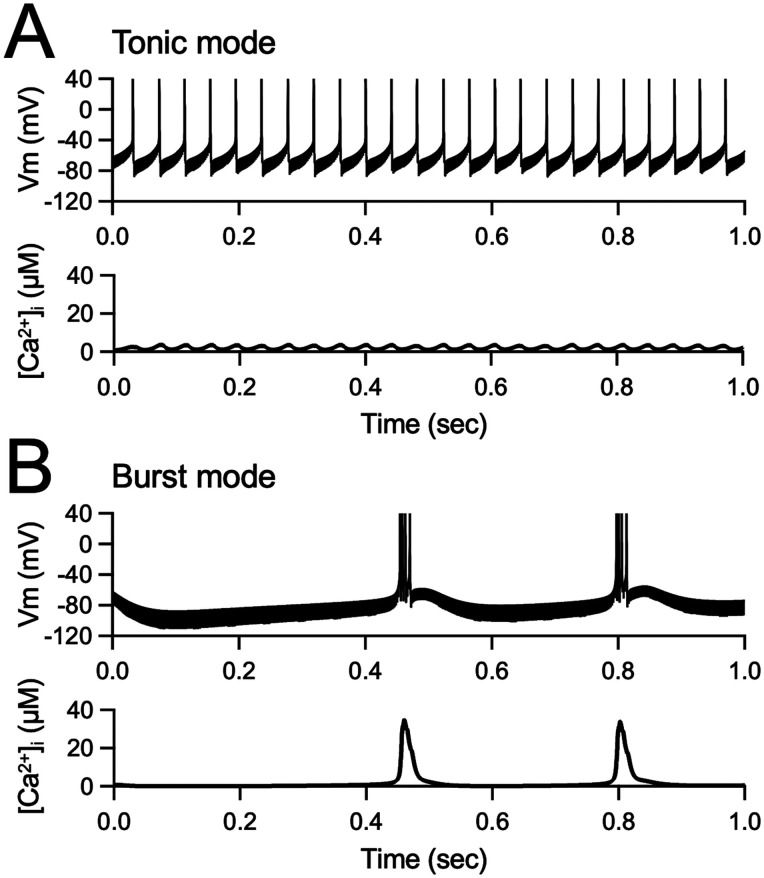
Transcranial focused ultrasound stimulation (tFUS) is a noninvasive neuromodulation technique, which can penetrate deeper and modulate neural activity with a greater spatial resolution (on the order of millimeters) than currently available noninvasive brain stimulation methods, such as transcranial magnetic stimulation (TMS) and transcranial direct current stimulation (tDCS). While there are several studies demonstrating the ability of tFUS to modulate neuronal activity, it is unclear whether it can be used for producing long-term plasticity as needed to modify circuit function, especially in adult brain circuits with limited plasticity such as the thalamocortical synapses. Here we demonstrate that transcranial low-intensity focused ultrasound (LIFU) stimulation of the visual thalamus (dorsal lateral geniculate nucleus, dLGN), a deep brain structure, leads to NMDA receptor (NMDAR)-dependent long-term depression of its synaptic transmission onto layer 4 neurons in the primary visual cortex (V1) of adult mice of both sexes. This change is not accompanied by large increases in neuronal activity, as visualized using the cFos Targeted Recombination in Active Populations (cFosTRAP2) mouse line, or activation of microglia, which was assessed with IBA-1 staining. Using a model (SONIC) based on the neuronal intramembrane cavitation excitation (NICE) theory of ultrasound neuromodulation, we find that the predicted activity pattern of dLGN neurons upon sonication is state-dependent with a range of activity that falls within the parameter space conducive for inducing long-term synaptic depression. Our results suggest that noninvasive transcranial LIFU stimulation has a potential for recovering long-term plasticity of thalamocortical synapses in the postcritical period adult brain.

Keywords: LIFU; adult plasticity; long-term depression; noninvasive; synaptic plasticity; ultrasound.


Conflict of interest statement

The authors declare no competing financial interests.

Figures

Figure 1.
Figure 1.
LIFU transducer acoustic intensity profile. A, Normalized acoustic intensity profile (normalized to the peak intensity) of the LIFU transducer measured in a water tank using a calibrated needle hydrophone. The tip of the transducer and the tip of the custom-fabricated waveguide (23 mm length) are shown. The intensity profile was measured without the waveguide present; however, the focal pattern remains the same with part of the focal pattern occurring within the waveguide as depicted in the figure because the waveguide matches the acoustic specific impedance of water. Long dashed gray line outlines −3 dB of maximum acoustic intensity. Short dashed gray line outlines 90% of maximum acoustic intensity. B, The tip of the waveguide is placed flat on the head of a mouse after removing the fur to expose the skin. The acoustic intensity profile in (A) is overlaid with a traced outline of a mouse brain taken from a mouse brain atlas [Plate 50, Bregma −2.3 mm in (Paxinos and Franklin, 2001)] to show the expected location of the peak acoustic energy inside the skull. The boundaries of dLGN are outlined in pink. The center of the LIFU transducer was placed approximately ∼2 mm lateral to the midline and the lambdoid suture, which is visible through the exposed skin, was used as a guide for estimating the anterior-posterior target location.
Figure 2.
Figure 2.
LIFU stimulation of dLGN results in NMDAR-dependent long-term depression of dLGN synaptic strength measured in V1 L4. A, Illustration of LIFU stimulation of a mouse. The fur on the top of the head was removed to expose the skin of an anesthetized mouse, which was head-fixed on a stereotaxic frame, and the LIFU waveguide tip was firmly coupled using ultrasound gel. Mouse was enucleated at least the day before to remove any potential visually evoked responses. LIFU stimulation was delivered under isoflurane anesthesia. B, Schematics of the experiment. ChR2-mCherry was expressed in dLGN of VGluT2-Cre mice at least 2 weeks before the LIFU stimulation and 6 weeks before the ex vivo brain slice electrophysiology. Whole-cell voltage-clamp recordings were done in V1 L4 principal neurons and dLGN axon terminals expressing ChR2-mCherry were activated by LED (455 nm, 5 ms pulse width) delivered through the objective lens. V1 of both hemispheres (LIFU stimulated and unstimulated CTL) were used for recording LED-evoked Sr2+-mEPSCs. C, An example of recorded V1 L4 neurons visualized by processing for biocytin, which was present in the internal solution. After the recording, the slice was fixed and counterstained with DAPI (blue). Three L4 neurons were recorded from this particular slice. Left, A tiled image using a 10× objective lens showing the location of the recorded cells (green). Right, A higher magnification (63×) confocal image showing the same recorded cells (green) counterstained with DAPI (blue) and overlaid with mCherry (magenta) signals showing dLGN axons expressing ChR2-mCherry. D, Left, Comparison of the average amplitude of LED-evoked Sr2+-mEPSCs recorded from CTL and LIFU stimulated hemispheres. The average amplitude from each V1 L4 neuron is shown as open circles and overlaid on the bars showing the group averages (mean ±  SEM). *p < 0.05 (two-tailed unpaired t test with Welch’s correction, t = 2.372, p = 0.0268). Middle, Average traces of calculated LED-evoked Sr2+-mEPSCs (see Methods for details). Right, Example recording traces (top, from a neuron in CTL hemisphere; bottom, from a neuron in LIFU stimulated hemisphere). The Gray dotted line represents the time window to measure spontaneous mEPSCs. The blue arrow denotes the time of LED stimulation (5 ms pulse duration), which is followed by an initial synchronized release mediated synaptic responses. The blue line represents the time window used to measure LED post events (started 50 ms after the LED to remove the initial synchronized release event), which include LED-evoked Sr2+-mEPSCs in the background of spontaneous mEPSCs (see Methods for details on mathematical subtraction of spontaneous mEPSCs to quantify LED-evoked Sr2+-mEPSCs). E, Systemic application of an NMDAR antagonist (CPP, 10 mg/kg, i.p.) prevents LIFU-induced depression of LED-evoked Sr2+-mEPSCs. Left, Comparison of the average amplitude of LED-evoked Sr2+-mEPSCs recorded from CTL + CPP and LIFU + CPP hemispheres. The average amplitude from each V1 L4 neuron is shown as open circles and overlaid on the bars showing the group averages (mean ±  SEM). CTL + CPP data set did not pass the normality test (Shapiro–Wilk test, p = 0.0110); hence, statistical comparison was done using a nonparametric test (two-tailed Mann–Whitney test, p = 0.6891). n.s., not statistically significant. Middle, Average traces of calculated LED-evoked Sr2+-mEPSCs (see Methods for details). Right, Example recording traces (top, from a neuron in CTL + CPP hemisphere; bottom, from a neuron in LIFU + CPP hemisphere). Annotations are the same as in panel D.
Figure 3.
Figure 3.
Validation of cFosTRAP2;Ai14 mouse. A, Coronal sections of monocularly enucleated cFosTRAP2;Ai14 mice were counterstained with DAPI and confocal tiled images were taken. Using the DAPI channel, brain areas of interest were outlined by comparing the landmarks with corresponding plates in a mouse brain atlas (Paxinos and Franklin, 2001). Left, DAPI imaging with ROIs outlined. 1, retrospleneal cortex (RSP); 2, V2; 3, V1; 4, somatosensory cortex (S1); 5, auditory cortex (A1); 6, dLGN. Right, ROIs selected in the DAPI channel were used to quantify tdTomato (tdT) positive cells in each brain area. Contra, contralateral hemisphere from the enucleated eye (i.e., visually deprived hemisphere). Ipsi, ipsilateral hemisphere from the enucleated eye (i.e., dominantly driven by the open eye). Hemispheres were identified by a nick made to the bottom of one hemisphere as is visible in this image. B, Zoomed-in images of each brain area from the example brain shown in (A). Left panels, DAPI. Right panels, tdTomato (cFosTRAP2;Ai14). Images from contra- and ipsilateral hemispheres are shown for V1, V2, RSP, and S1. C, Comparison of quantified density of tdTomato positive cells in contra (C) and ipsi (I) hemispheres for V1, V2, dLGN, RSP, S1, and A1. Note a significant increase in tdTomatoe labeling of active cells in V1 and V2 of ipsilateral hemispheres to the enucleated eye. dLGN only showed minimal labeling in both hemispheres. cFosTRAP2-induced tdTomato cell density (mean ±  SEM), Contra V1 = 8.4 ± 3.21 mm−2, Ipsi V1 = 71.8 ± 13.06 mm−2, n = 4 sections; Contra V2 = 15.5 ± 3.08 mm−2, Ipsi V2 = 32.4 ± 4.90 mm−2, n = 10 sections; Contra dLGN = 4.4 ± 1.59 mm−2, Ipsi dLGN = 8.7 ± 2.32 mm−2, n = 9 sections; Contra RSP = 31.4 ± 6.54 mm−2, Ipsi RSP = 35.7 ± 7.56 mm−2, n = 10 sections; Contra S1 = 9.4 ± 2.30 mm−2, Ipsi S1 = 8.5 ± 1.68 mm−2, n = 11 sections; Contra A1 = 13.1 ± 3.34 mm−2, Ipsi A1 = 26.3 ± 1.00 mm−2, n = 3 sections; 2 mice. *p < 0.05, **p < 0.01, n.s., not significant (two-tailed paired t tests, dLGN, t = 1.747, p = 0.1187; RSP, t = 1.937, p = 0.0848; A1, t = 3.058, p = 0.0924). Ipsi V1, Ipsi V2, and both S1 data sets did not pass the normality test (Shapiro–Wilk test, Ipsi V1 p = 0.0108; Ipsi V2 p = 0.0455; Contra S1 p = 0.246; Ipsi S1 p = 0.0080); hence, the statistical comparisons of V1, V2, and S1 tdT-positive cell densities were done using a nonparametric test (two-tailed Mann–Whitney test; V1, p = 0.0286; V2, p = 0.0232; S1, p = 0.7969). D, Left, Image of a negative control brain section of cFosTRAP2;Ai14, which did not receive an injection of 4-OHT. There is very little background cFosTRAP2-driven tdTomato (tdT) expression. Right, Image of a control brain of a normal-sighted cFosTRAP2;Ai14, which received an injection of 4-OHT. Note induction of tdTomato across both hemispheres.
Figure 4.
Figure 4.
LIFU stimulation does not induce cFosTRAP2-driven gene expression. A, Left, Unilateral LIFU stimulated cFosTRAP2;Ai14 mouse brain sections were counterstained with DAPI to identify landmarks for outlining the ROIs in the tile scanned confocal image. In sections corresponding to the LIFU target region, we outlined a 1-mm-wide rectangle that is within the predicted LIFU acoustic beam path (∼2-mm diameter based on acoustic intensity measurements, see Figure 1). Within this rectangle, the overlaying cortex (Ctx, labeled 1), hippocampus (HC, labeled 2), and dLGN (labeled 3) were outlined. Right, Using the outlined ROIs from the DAPI channel, tdTomato positive cells were quantified in the tdTomato (tdT) channel. Hemispheres were identified by a nick to the bottom of one hemisphere as shown in these images. B, Left, A plot showing the depth profile of identified tdT positive cells (orange circles) within the outlined rectangles in panel (A) for CTL and LIFU stimulated hemispheres. Blue line, pia. Right. A graph showing quantification of the depth of each tdT positive cell in relation to the outlined pia from the plot shown in the left panel. C, Quantification of the depth profile of tdT positive cells across five mice with unilateral LIFU stimulation. Only the brain sections corresponding to the similar coronal plane as shown in panel (A) were analyzed. There was no statistical significance in the fraction of tdT positive cells across the depth between CTL and LIFU hemispheres, while there is a significant effect on the depth [two-way repeated measures ANOVA, depth × group (CTL/LIFU), F (35, 70) = 4.159, p = 0.7851; depth, F (35, 70) = 4.159, p < 0.0001]. D, Quantification of the density of tdT-positive cells in dLGN, Ctx, HC, and V1. Open circles, Data from each brain section containing the specific ROI. Bars, Average tdT positive cell density (mean ±  SEM, dLGN, CTL = 18.2 ± 7.83 mm−2, LIFU = 14.8 ± 4.47 mm−2, n = 8 sections; Ctx, CTL = 34.7 ± 9.46 mm−2, LIFU = 34.5 ± 9.54 mm−2, n = 8 sections; HC, CTL = 8.7 ± 1.96 mm−2, LIFU = 11.5 ± 3.20 mm−2, n = 8 sections; V1, CTL = 19.1 ± 5.10 mm−2, LIFU = 18.8 ± 5.21 mm−2, n = 11 sections) quantified from five mice. n.s., not significant (two-tailed paired t tests, Ctx, t = 0.2227, p = 0.8347; HC, t = 1.131, p = 0.3213; V1, t = 0.243, p = 0.8200). dLGN data sets did not pass the normality test (Shapiro–Wilk test, CTL, p = 0.0131; LIFU, p = 0.0123); hence, the statistical comparison of dLGN cell density was done using a nonparametric test (two-tailed Mann–Whitney test, p = 0.7024).
Figure 5.
Figure 5.
LIFU stimulation does not produce changes in activated microglia. A, Brain sections from unilateral LIFU stimulated cFosTRAP2;Ai14 mice were stained for activated microglial marker IBA-1 and counterstained with DAPI. Left, DAPI images (10× objective lens, tiled confocal image) were used to outline the ROIs as described above. Right, The ROIs were then used for quantifying the IBA-1 images. In this particular example, images from each hemisphere were saved as different image files, hence displayed as separate panels. Hemispheres were identified by a nick to the bottom of one side as shown. B, Left, A plot showing the depth profile of identified IBA-1 positive cells (orange circles) within the outlined rectangles in panel (A) for CTL and LIFU stimulated hemispheres. Blue line, pia. Right, A graph showing quantification of the depth of each IBA-1 positive cell in relation to the outlined pia from the plot shown in the left panel. C, Quantification of the depth profile of IBA-1 positive cells across 5 mice with unilateral LIFU stimulation. Only the brain sections corresponding to the similar coronal plane as shown in panel (A) were analyzed. There was no statistical significance in the fraction of IBA-1 positive cells across the depth between CTL and LIFU hemispheres, while there was a significant effect of the depth [two-way repeated measures ANOVA, depth × group (CTL/LIFU), F (35, 560) = 0.5992, p = 0.9682; depth, F (5.277, 84.43) = 5.027, p = 0.0003]. D, Quantification of the density of IBA-1 positive cells in dLGN, Ctx, HC, and V1. Open circles, Data from each brain section containing the specific ROI. Bars, Average IBA-1 positive cell density (mean ±  SEM, dLGN, CTL = 8.8 ± 18.19 mm−2, LIFU = 18.2 ± 6.48 mm−2, n = 8 sections; Ctx, CTL = 7.2 ± 2.48 mm−2, LIFU = 8.6 ± 2.63 mm−2, n = 6 sections; HC, CTL = 7.7 ± 1.92 mm−2, LIFU = 6.2 ± 1.93 mm−2, n = 6 sections; V1, CTL = 18.1 ± 5.74 mm−2, LIFU = 14.8 ± 3.64 mm−2, n = 7 sections) quantified from five mice. n.s., not significant (two-tailed paired t tests, Ctx, t = 1.161, p = 0.2980; HC, t = 0.9803, p = 0.3824; V1, t = 0.5349, p = 0.6298). dLGN LIFU data set did not pass the normality test (Shapiro–Wilk test, p = 0.0121); hence, the statistical comparison of dLGN cell density was done using a nonparametric test (two-tailed Mann–Whitney test, p = 0.1605). Two data points for Ctx were removed based on an outlier test (ROUT, Q = 1%), but the inclusion of these data points does not alter the conclusion (two-tailed paired t test, t = 0.7689, p = 0.4671). E, Quantification of the intensity (a.u., arbitrary unit of fluorescence intensity) of IBA-1 positive cells in dLGN, Ctx, HC, and V1. Open circles, Data from each brain section containing the specific ROI. Bars, Average IBA-1 positive cell intensity (mean ±  SEM, dLGN, CTL = 169 ± 6.5 a.u., LIFU = 164 ± 6.6 a.u., n = 8 sections; Ctx, CTL = 165 ± 7.0 a.u., LIFU = 164 ± 6.6 a.u., n = 6 sections; HC, CTL = 164 ± 6.4 a.u., LIFU = 164 ± 5.8 a.u., n = 6 sections; V1, CTL = 165 ± 4.1 a.u., LIFU = 167 ± 3.8 a.u., n = 7 sections) quantified from five mice. n.s., not significant (two-tailed paired t tests, dLGN, t = 0.3307, p = 0.7574; Ctx, t = 0.6487, p = 0.5519; HC, t = 0.2322, p = 0.8278; V1, t = 0.3281, p = 0.7644).
Figure 6.
Figure 6.
Simulation of predicted neuronal activity in dLGN with LIFU stimulation parameters used experimentally. A, Results from simulation in the SONIC model using the parameters for dLGN when in a depolarized tonic firing mode. Top, Predicted membrane potential (Vm) changes show a train of single action potentials at ∼25 Hz. Bottom, Predicted intracellular Ca2+ concentration. B, Results from simulation in the SONIC model using the parameters for dLGN when in a hyperpolarized burst firing mode. Top, Predicted membrane potential (Vm) changes show bursts of action potentials repeated at ∼250 msec inter-burst interval. Bottom, Predicted intracellular Ca2+ concentration. See Table 1 for the details on ionic conductances used for the simulation.

Similar articles

Cited by

References

    1. Baek H, Pahk KJ, Kim H (2017) A review of low-intensity focused ultrasound for neuromodulation. Biomed Eng Lett 7:135–142. 10.1007/s13534-016-0007-y - DOI - PMC - PubMed
    1. Barkat TR, Polley DB, Hensch TK (2011) A critical period for auditory thalamocortical connectivity. Nat Neurosci 14:1189–1194. 10.1038/nn.2882 - DOI - PMC - PubMed
    1. Chokshi V, Gao M, Grier BD, Owens A, Wang H, Worley PF, Lee HK (2019) Input-specific metaplasticity in the visual cortex requires homer1a-mediated mGluR5 signaling. Neuron 104:736–748 e736. 10.1016/j.neuron.2019.08.017 - DOI - PMC - PubMed
    1. Chung S, Jeong JH, Ko S, Yu X, Kim YH, Isaac JTR, Koretsky AP (2017) Peripheral sensory deprivation restores critical-period-like plasticity to adult somatosensory thalamocortical inputs. Cell Rep 19:2707–2717. 10.1016/j.celrep.2017.06.018 - DOI - PMC - PubMed
    1. Coleman JE, Nahmani M, Gavornik JP, Haslinger R, Heynen AJ, Erisir A, Bear MF (2010) Rapid structural remodeling of thalamocortical synapses parallels experience-dependent functional plasticity in mouse primary visual cortex. J Neurosci 30:9670–9682. 10.1523/JNEUROSCI.1248-10.2010 - DOI - PMC - PubMed

Publication types

LinkOut - more resources