. 2024 Dec;62(6):4472-4493.
doi: 10.1007/s10528-024-10688-7. Epub 2024 Feb 5.

Identification and Functional Mechanism Verification of Novel MicroRNAs Associated with the Fibrosis Progression in Chronic Kidney Disease

Affiliations

Identification and Functional Mechanism Verification of Novel MicroRNAs Associated with the Fibrosis Progression in Chronic Kidney Disease

Kaiying He et al. Biochem Genet. 2024 Dec.

Abstract

Chronic kidney disease (CKD) is a serious threat to human health worldwide, and its incidence is increasing annually. A growing amount of information is emerging about the role of micoRNAs (miRNAs) in the regulation of renal fibrosis, which has aroused interest in the development of drugs that block pathogenic miRNAs or restore protective miRNAs levels. To clarify the role of miRNAs in CKD, we selected patients with significant renal fibrotic disease (diabetic nephropathy (DN) and focal segmental glomerulosclerosis (FSGS)) as the disease group, and patients with little or no renal fibrotic disease (minimal change disease (MCD) and renal carcinoma adjacent to normal kidney) as controls. Significantly differentially expressed miRNAs were obtained by human kidney tissue sequencing, subsequently verified in mice models of DN and FSGS, and subsequently inhibited or overexpressed in human renal tubular epithelial cells (HK-2) stimulated by high glucose (HG) and TGF-β1 in vitro. Therefore, the mechanism of its action in renal fibrosis was further elaborated. Finally, the downstream target genes of the corresponding miRNAs were verified by bioinformatics analysis, qRT-PCR, western blot and double luciferase report analysis. Two novel miRNAs, hsa-miR-1470-3p (miR-1470) and hsa-miR-4483-3p (miR-4483), were detected by renal tissue sequencing in the disease group with significant renal fibrosis (DN and FSGS) and the control group with little or no renal fibrosis (MCD and normal renal tissue adjacent to renal carcinoma). Subsequent human renal tissue qRT-PCR verified that the expression of miR-1470 was significantly increased, while the expression of miR-4483 was markedly decreased in the disease group (p < 0.05). Moreover, in vivo DN and FSGS mice models, the expression levels of miR-1470 and miR-4483 were consistent with the results of human kidney tissue. In vitro, miR-4483 was suppressed, whereas miR-1470 was induced by treatment with TGF-β1 or HG. Inhibition of miR-1470 or overexpression of miR-4483 promoted HG or TGF-β1-induced fibrosis in HK-2 cells. Further study revealed that MMP-13 and TIMP1 were the target genes ofmiR-1470 and miR-4483, respectively. Our study identifies newly dysregulated miRNA profiles related to fibrosis kidneys. miR-1470 and miR-4483 are demonstrated to participate in kidney fibrosis by regulation of MMP-13, TIMP1 respectively. Our results may represent a promising research direction for renal disorders and help identify new biomarkers and therapeutic targets for CKD.

Keywords: Chronic kidney disease; DN; FSGS; Novel miRNAs; Renal fibrosis.


Conflict of interest statement

Declarations. Conflict of interest: The authors declare that they have no competing interests. Ethical Approval: The study was approved by the Institutional Review Board and Ethics Committee of The First Affiliated Hospital of Sun Yat-sen University. Every patient had provided written informed consent. All animal experiments were approved by the Committee on Animal Experimentation of Sun Yat-sen University and performed in compliance with the Guidelines for the Care and Use of Laboratory Animals of the university. Consent for Publication: Not applicable.

Figures

Fig. 1
Fig. 1
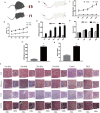
AC: Number of DE miRNAs in kidney biopsy tissues of MCD, DN, FSGS. The expression of these miRNAs in MCD, DN, FSGS are illustrated in the heatmaps (n = 4 in each group). The miRNAs with fold change > 1.5 and p-value < 0.05 for expression in MCD, DN, FSGS patients compared to normal control were considered as differentially expressed (DE). D: Venn diagram has shown the number of DE miRNAs in MCD, DN, FSGS groups. E: ISH data using human FFPE sections show that both miR-1470 and miR-4483 were mainly expressed in tubular epithelial cells. F: qRT-PCR shows the expression levels of miR-1470 and miR-4483 in human FFPE sections of MCD, FSGS, DN and normal kidney tissues from healthy donor. G: Cell viability stimulated by HG stimulation at different concentrations (NG, HG) for 0 h, 24 h, 48 h, 72 h and 96 h. H: Cell viability stimulated by TGF-β1 stimulation at 10 ng/mL concentrations for 0 h, 2 h, 4 h, 8 h, 12 h, 24 h, 48 h, 72 h and 96 h. MCD: minimal change disease, FSGS: focal segmental glomerulosclerosis, DN: diabetic nephropathy, Con: normal kidney tissues from healthy donor. *p < 0.05 versus control group
Fig. 2
Fig. 2
A: Simulated images of DN mice (16w db/db, 24w db/db) and db/m mice. B: Simulated images of FSGS mice and control mice. C: Comparison of weight between db/db mice and db/m mice at different weeks of age. D: Comparison of blood glucose between db/db mice and db/m mice at different weeks of age. E: Comparison of urinary albumin/creatinine(ACR) between db/db mice and db/m mice at different weeks of age. F: Comparison of serum creatinine (Scr) between db/db mice and db/m mice at different weeks of age. G: Comparison of urinary albumin/creatinine(ACR) between FSGS mice and control mice. H: Comparison of serum creatinine (Scr) between FSGS mice and control mice. I: H&E, Masson, PAS, PASM staining was used to observe the pathological change in kidney tissues among groups (magnification times: 200 × and 1000 ×)
Fig. 3
Fig. 3
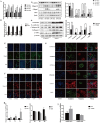
A: QRT-PCR was used to detect the mRNA levels of fibrosis markers (including FN, COL1, COL3 and a-SMA) among the four groups. B: QRT-PCR was used to detect the mRNA levels of fibrosis markers (including FN, COL1, COL3 and a-SMA) among the two groups. C: Western blot assay and quantitative analysis was used to detect the protein levels of fibrosis markers (including E-CAD, COL1, COL3, a-SMA, Vimentin) among the four groups. D: Western blot assay and quantitative analysis was used to detect the protein levels of fibrosis markers (including E-CAD, COL1, COL3, a-SMA, Vimentin) among the two groups. E, F, G: Immuno-fluorescence of E-CAD, COL1, COL3 and Vimentin among the six groups. H, I: QRT-PCR was used to detect the levels of miR-1470 and miR-4483 in the kidney of DN and FSGS, respectively. *P < 0.05, **P < 0.01, ***P < 0.001
Fig. 4
Fig. 4
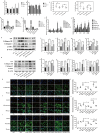
A, B: QRT-PCR was used to detect the levels of miR-1470 and miR-4483 in HK-2 cells stimulated by HG (30 mmol/L) for 0 h,24 h,48 h,72 h. C:Changes of cell viability under different transfection conditions. D, E: QRT-PCR was used to detect the levels of miR-1470 (D) and miR-4483 (E) in HK-2 cells after overexpression or inhibition of miR-1470 and miR-4483 under HG stimulation. F, G: QRT-PCR was used to determine the mRNA levels of fibrosis markers (including FN, COL1 COL3 and a-SMA) after overexpression or inhibition of miR-1470 (F) or miR-4483 (G) among the five groups. H, I, J, K,L: Western blot and quantitative analysis were used to detect the protein levels of FN, COL1, COL3 and a-SMA among HG (−), HG (+), miR-1470 mimic + HG, miR-1470 mimic NC+HG, miR-1470 inhibitor+HG, miR-1470 inhibitor NC+HG groups. M, N, O, P, Q: Western blot and quantitative analysis were used to determine the protein levels of FN, COL1, COL3 and a-SMA among HG (−), HG (+), miR-4483 mimic+HG, miR-4483 mimic NC+HG, miR-4483 inhibitor+HG, miR-4483 inhibitor NC+HG groups. R, S, T, U, V, W: Immunofluorescence of collagen IV, FN, Vimentin and quantitative immunofluorescence analysis of collagen IV, FN, Vimentin in HK-2 with HG, HG+miR-1470 mimic, HG+miR-1470 mimic NC, miR-1470 inhibitor, miR-1470 inhibitor NC, HG+miR-4483 mimic, HG+miR-4483 mimic NC, miR-4483 inhibitor, miR-4483 inhibitor NC transfection, respectively. ns: no significance,*P < 0.05, **P < 0.01, ***P < 0.001
Fig. 5
Fig. 5
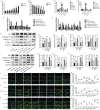
A, B: QRT-PCR assay was used to detect the levels of miR-1470 and miR-4483 in HK-2 cells stimulated by TGF-β1(10 ng/mL) for 0 h,2 h,4 h,8 h,12 h,24 h,48 h,72 h. C, D: QRT-PCR assay was used to detect the levels of miR-1470 (C) and miR-4483 (D) in HK-2 cells after overexpression or inhibition of miR-1470 and miR-4483 under TGF-β1 stimulation. E, F: QRT-PCR was used to detect the mRNA levels of fibrosis markers (including FN, COL1, COL3 and a-SMA) after overexpression and inhibition of miR-1470 (E) or miR-4483 (F) among the five groups. G, H, I, J, K: Western blot and the quantitative analysis were used to detect the protein levels of FN, COL1, COL3 and a-SMA among TGF-β1(−),TGF-β1(+), miR-1470 mimic+TGF-β1, miR-1470 mimic NC+TGF-β1, miR-1470 inhibitor+TGF-β1, miR-1470 inhibitor NC+TGF-β1. L, M, N, O, P: Western blot and the quantitative analysis was used to detect the protein levels of FN, COL1, COL3 and a-SMA among TGF-β1(−), TGF-β1(+), miR-4483 mimic+TGF-β1, miR-4483 mimic NC+TGF-β1, miR-4483 inhibitor+TGF-β1, miR-4483 inhibitor NC+TGF-β1. Q, R, S, T, U, V: Immunofluorescence of collagen IV, FN, Vimentin and quantitative immunofluorescence analysis of Collagen IV, FN, Vimentin in HK-2 with TGF-β1(−), TGF-β1(+), miR-1470 mimic+TGF-β1, miR-1470 mimic NC+TGF-β1, miR-1470 inhibitor+TGF-β1, miR-4483 mimic+TGF-β1, miR-4483 mimic NC+TGF-β1, miR-4483 inhibitor+TGF-β1, miR-4483 inhibitor NC+TGF-β1. *P < 0.05, **P < 0.01, ***P < 0.001
Fig.6
Fig.6
A, B: GO and KEGG enrichment predicted the top 30 significant target genes of miR-1470. C, D: GO and KEGG enrichment predicted the top 30 significant target genes of miR-4483. E: QRT-PCR was used to determine the mRNA expression of related downstream target genes (MMP-14, MMP-2, MMP-13, MMP-9, CTGF) under miR-1470 overexpression or inhibition conditions. F: QRT-PCR was used to detect the mRNA expression of the related downstream target gene (TIMP-1) under miR-4483 overexpression or inhibition conditions. G Simple illustration of the double luciferase gene reporter vector. H, I, J: The schematic luciferase reporter constructs. A mutant construct was made by replacing four nucleotides in the miRNA seed binding site of the 3'-UTR of the target gene. The mutant nucleotides were marked in bold and underlined. K: The luciferase reporter assay of MMP-13 3′-UTR reporter in HK-2 cells for 48 h after miR-1470 mimic transfection. L: The luciferase reporter assay of TIMP-1 3′-UTR reporter in HK-2 cells for 48 h after miR-4483 transfection
Fig. 7
Fig. 7
A, B: The protein expression and quantitative analysis of MMP-13 after transfection of miR-1470 mimic, miR-1470 mimic NC, miR-1470 inhibitor, miR-1470 inhibitor NC in HK-2 cells. C, D: The level of protein expression and quantitative analysis of TIMP-1 after transfection of miR-4483 mimic, miR-4483 mimic NC, miR-4483 inhibitor, miR-4483 inhibitor NC in HK-2 cells. E, G: The level of protein expression and quantitative analysis of MMP-13 in 24w db/m and 24w db/db mice. F, H: The protein expression level and quantitative analysis of TIMP-1 in 24w db/m and 24w db/db mice. I, J, K: Protein–protein interaction network (PPI), GO and KEGG enrichment predicted the top 10 target genes of MMP-13. L, M, N: Protein–protein interaction network (PPI), GO and KEGG enrichment predicted the top 10 significant target genes of TIMP-1. Rluc vector empty vector, WT wild-type, Mut mutant, NC scrambled negative control transfection. *P < 0.05, **P < 0.01, ***P < 0.001

Similar articles

Cited by

References

    1. Cao D et al (2021) Regulation of connective tissue growth factor expression by miR-133b for the treatment of renal interstitial fibrosis in aged mice with unilateral ureteral obstruction. Stem Cell Res Ther 12:171. 10.1186/s13287-021-02210-2 - PMC - PubMed
    1. Cerqueira DM, Tayeb M, Ho J (2022) MicroRNAs in kidney development and disease. JCI Insight. 10.1172/jci.insight.158277 - PMC - PubMed
    1. Chau BN et al (2012) MicroRNA-21 promotes fibrosis of the kidney by silencing metabolic pathways. Sci Transl Med. 10.1126/scitranslmed.3003205 - PMC - PubMed
    1. Declèves AE, Sharma K (2014) Novel targets of antifibrotic and anti-inflammatory treatment in CKD. Nat Rev Nephrol 10:257–267. 10.1038/nrneph.2014.31 - PMC - PubMed
    1. Denby L et al (2011) miR-21 and miR-214 are consistently modulated during renal injury in rodent models. Am J Pathol 179:661–672. 10.1016/j.ajpath.2011.04.021 - PMC - PubMed

MeSH terms