. 2024 Feb 5;15(1):1055.
doi: 10.1038/s41467-023-44566-4.

HIV-associated gut microbial alterations are dependent on host and geographic context

Affiliations

HIV-associated gut microbial alterations are dependent on host and geographic context

Muntsa Rocafort et al. Nat Commun. .

Abstract

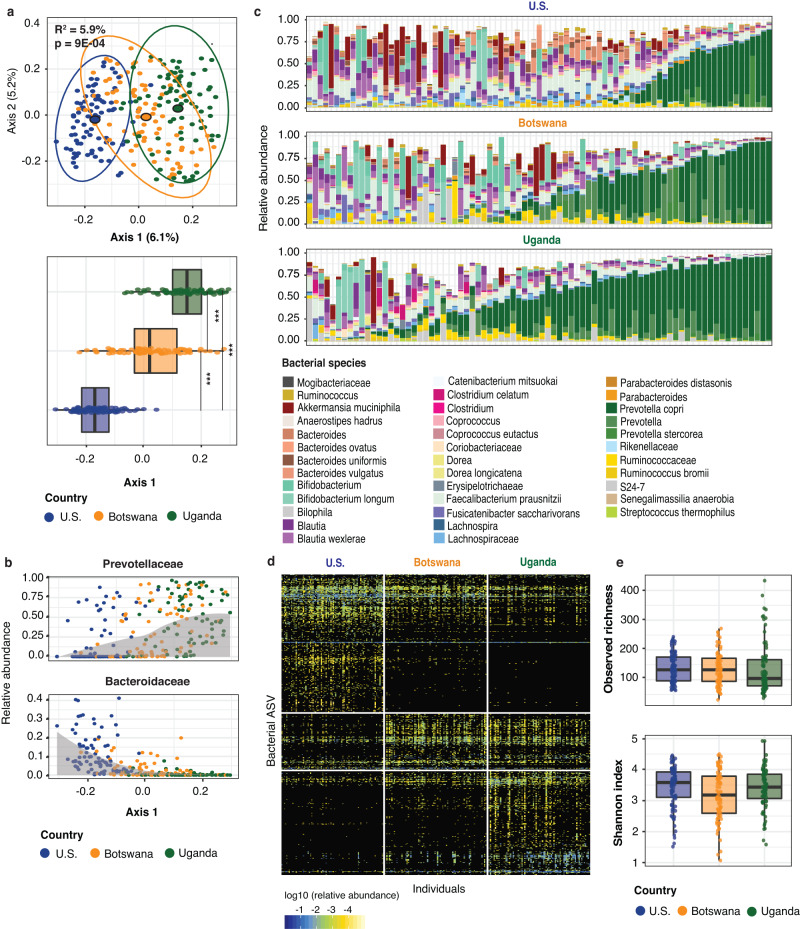
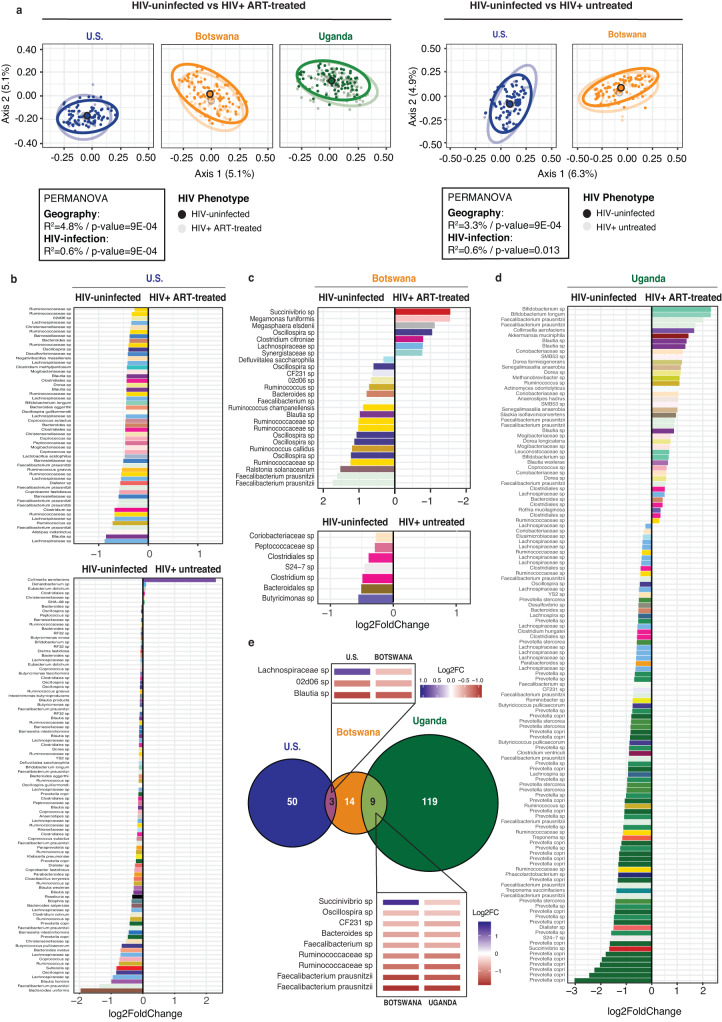
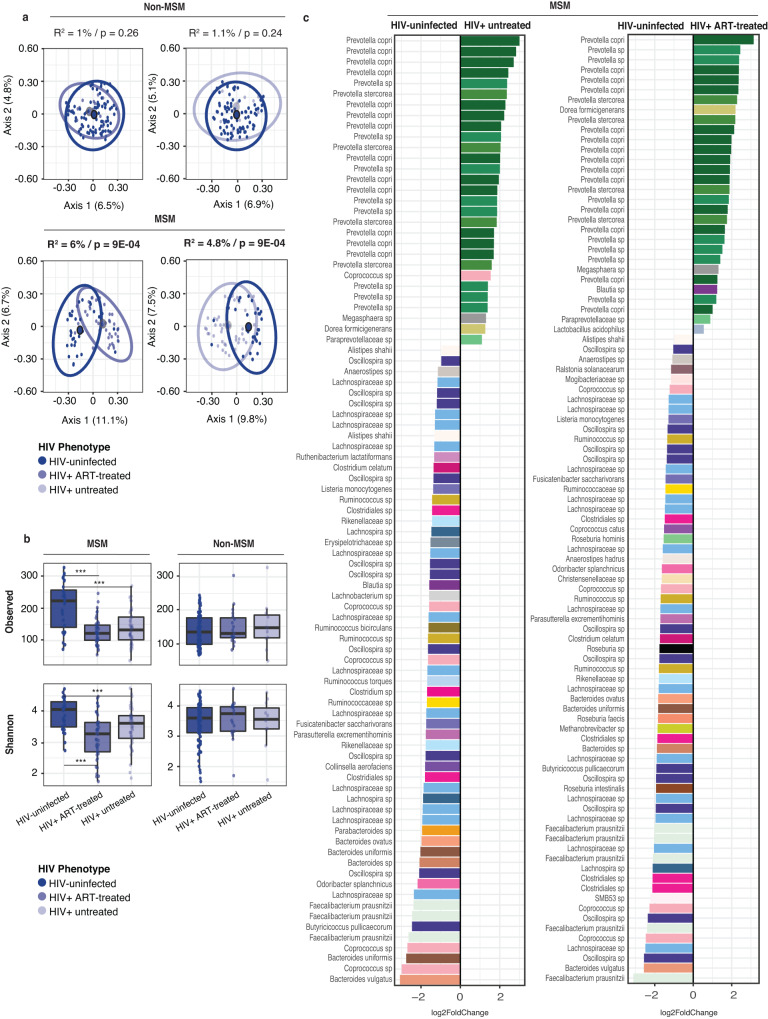
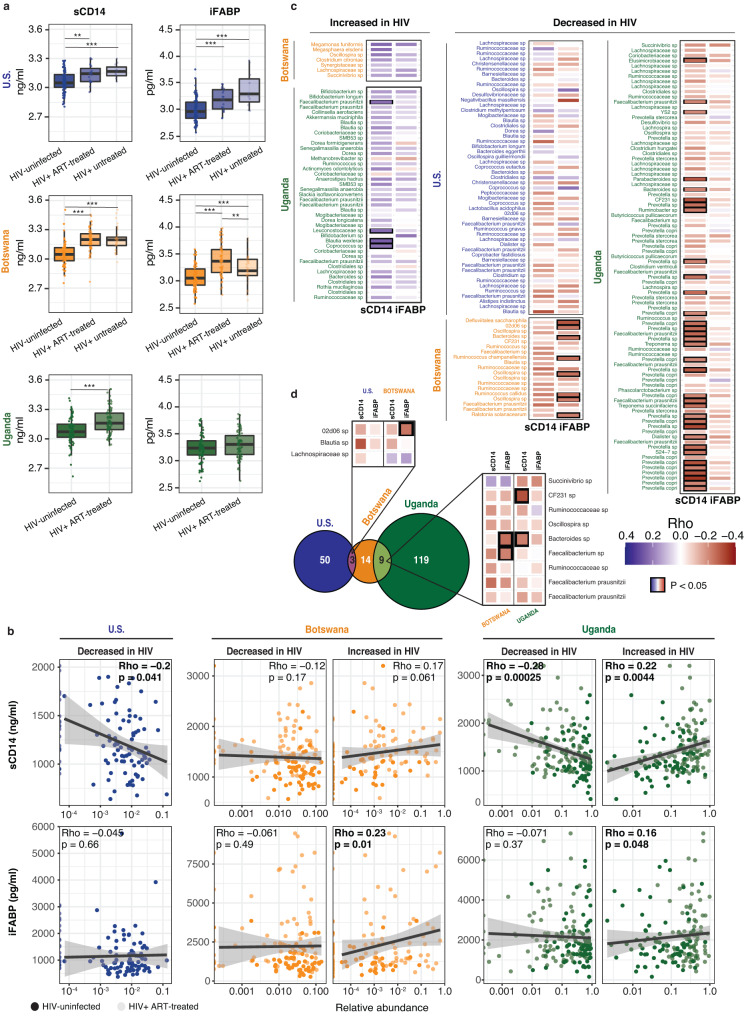
HIV-associated changes in intestinal microbiota are believed to be important drivers of disease progression. However, the majority of studies have focused on populations in high-income countries rather than in developing regions where HIV burden is greatest. To better understand the impact of HIV on fecal microbiota globally, we compare the fecal microbial community of individuals in the U.S., Uganda, and Botswana. We identify significant bacterial taxa alterations with both treated and untreated HIV infection with a high degree of uniqueness in each cohort. HIV-associated taxa alterations are also significantly different between populations that report men who have sex with men (MSM) behavior and non-MSM populations. Additionally, while we find that HIV infection is consistently associated with higher soluble markers of immune activation, most specific bacterial taxa associated with these markers in each region are not shared and none are shared across all three geographic locations in our study. Our findings demonstrate that HIV-associated changes in fecal microbiota are overall distinct among geographical locations and sexual behavior groups, although a small number of taxa shared between pairs of geographic locations warrant further investigation, highlighting the importance of considering host context to fully assess the impact of the gut microbiome on human health and disease.


Conflict of interest statement

The authors declare no competing interests.

Figures

Fig. 1
Fig. 1. HIV-uninfected non-MSM individuals have a distinct fecal microbiota composition in the U.S., Botswana and Uganda.
a PCoA showing unweighted UniFrac distances calculated at the ASV (amplicon sequence variant) level among all non-MSM (men who have sex with men) HIV-uninfected individuals. The boxplot represents the distribution of coordinates in Axis 1 of the PCoA above for the three cohorts. Boxplots are displayed with the median as the center value with the box as IQR and whiskers as minima and maxima. For the ordination plot, R2 and p value were obtained from a PERMANOVA analysis accounting for geographical location (n = 245 biologically independent samples, F(df = 2) = 7.662, p = 0.0009, R2 = 5.9%), and for the boxplot below, from a Kruskal–Wallis test with Bonferroni correction (***p value < 0.001); χ2(df = 2) = 234.0, p < 0.0001; pairwise comparisons: Botswana – U.S. Z = 9.53 (p < 0.0001), Uganda – U.S. Z = 12.94 (p < 0.0001), Botswana – Uganda Z = 8.13 (p < 0.0001). b Relative abundance of ASVs in the families Prevotellaceae and Bacteroidaceae. Each dot represents the relative abundance of a given sample and samples are plotted from left to right based on their position on Axis 1 from the PCoA in subfigure (a). A local regression (gray) shows the relation between the bacterial families’ relative abundance and the samples’ distribution on Axis 1. These families were significantly different in relative abundance amongst all cohorts as measured by Kruskal–Wallis test with Bonferroni correction (Prevotellaceae: χ2(df = 2) = 52.0, p < 0.001; Bacteroidaceae: χ2(df = 2) = 131.24, p < 0.001). c Relative abundance of the bacterial species with at least 1 count in 50% of the samples that show significant differential abundances in HIV-uninfected individuals between cohorts based on a Kruskal–Wallis test with Bonferroni multiple comparison correction (threshold p value < 0.01). Bacterial taxa are identified to the most precise taxonomic resolution. d Heatmap showing differentially abundant bacterial ASVs between the three cohorts (Kruskal–Wallis test, threshold p value < 0.01). Color gradient represents the relative abundance of each taxon in each individual. ASV in the y-axis and individuals in the x-axis are ordered based on an average clustering using Bray Curtis distance. ASVs are additionally organized and split based on the abundance in the U.S., Botswana or Uganda. e Boxplots showing the observed richness and Shannon diversity metrics for the HIV-uninfected individuals (n = 245 biologically independent samples) in the three countries. Boxplots are displayed with the median as the center value with the box as IQR and whiskers as minima and maxima.
Fig. 2
Fig. 2. Geography-specific HIV-associated fecal microbial alterations.
a PCoA ordination plots using unweighted UniFrac distance at the ASV (amplicon sequence variant) level among all non-MSM (men who have sex with men) HIV-uninfected and ART (antiretroviral)-treated HIV-infected subjects (left) and HIV-uninfected and untreated HIV-infected subjects (right). R2 and p value were obtained from a PERMANOVA analysis accounting for either geographical location or HIV infection status. HIV-uninfected vs HIV + ART-treated (n = 427 biologically independent samples): geography F(df = 2) = 10.78, p = 0.0009, R2 = 4.8%; and HIV infection F(df = 2) = 2.94, p = 0.0009, R2 = 0.6%. HIV-uninfected vs HIV+ untreated (n = 217 biologically independent samples): geography F(df = 2) = 7.56, p = 0.0009, R2 = 3.3%; and HIV infection F(df = 2) = 1.44, p = 0.007, R2 = 0.6%. b Results from an ANCOM analysis testing for differences of both ART-treated and -untreated HIV infection compared to the HIV-uninfected controls in the U.S. Only ASVs present in at least 5% of the samples in each HIV infection group were considered. The Log2FC values are represented on the x-axis for all those single ASVs with significantly different abundance in each of the tested groups (threshold p value < 0.05). Color represents taxonomic classification and ASVs are identified to the taxonomic level of greatest resolution. Multiple ASVs can be assigned to the same taxonomy and therefore the same taxonomic name and coloring may appear more than once in the analysis. The same analyses were conducted for the Botswanan (c) and Ugandan cohorts (d). e Venn diagram showing the proportion of unique and shared differentially abundant ASVs between ART-treated HIV-infected and HIV-uninfected individuals among the cohorts. The heatmap indicates the 9 shared ASVs among Botswana and Uganda as well as the 3 shared ASVs among Botswana and the U.S. and their Log2FC in abundance calculated from ANCOM analysis.
Fig. 3
Fig. 3. HIV infection impacts fecal microbiota composition differently in MSM and non-MSM populations.
a PCoA ordination plots using unweighted UniFrac distances at the ASV (amplicon sequence variant) level comparing both ART (antiretroviral)-treated and -untreated HIV infection to the corresponding HIV-uninfected controls for MSM (men who have sex with men) and non-MSM individuals in the U.S. For the ordination plots, R2 and p values were obtained from a PERMANOVA analysis accounting for HIV infection status. HIV-uninfected vs ART-treated HIV infection: F(df = 1) = 1.06, p = 0.26, R2 = 1% non-MSM (n = 104 biologically independent samples) vs F(df = 1) = 4.66, p = 0.0009, R2 = 6% MSM (n = 74 biologically independent samples). HIV-uninfected vs untreated HIV infection: (F(df = 1) = 1.08, p = 0.25, R2 = 1.1% non-MSM (n = 96 biologically independent samples) vs F(df = 1) = 3.77, p = 0.0009, R2 = 4.8% MSM (n = 76 biologically independent samples). b Boxplots showing the values for the observed richness and Shannon diversity metrics for the three HIV groups in MSM (n = 236 biologically independent samples) and non-MSM (n = 230 biologically independent samples) individuals (***p value ≤ 0.01). Boxplots are displayed with the median as the center value with the box as IQR and whiskers as minima and maxima. Observed (MSM): Kruskal–Wallis with Bonferroni correction χ2(df = 2) = 24.2, p < 0.001; pairwise comparisons: HIV-uninfected vs ART-treated Z > 4 (p < 0.0001), HIV-uninfected vs untreated HIV infection Z > 4 (p < 0.0001), ART-treated vs untreated HIV infection Z = 0.01 (p = 0.99). Shannon (MSM): Kruskal–Wallis with Bonferroni correction χ2(df = 2) = 17.7, p < 0.001; pairwise comparisons: HIV-uninfected vs ART-treated Z > 4 (p < 0.0001), HIV-uninfected vs untreated HIV infection Z = 2.35 (p = 0.019), ART-treated vs untreated HIV infection Z = 1.37 (p = 0.17). c Results from an ANCOM analysis testing for differences of both ART-treated and -untreated HIV infection compared to the HIV-uninfected controls in the MSM group in the U.S. Only ASVs present in at least 5% of the samples in each HIV infection group were considered. The Log2FC values are represented on the x-axis for all those single ASVs with significantly more or less abundance in each of the tested groups. Color code represents taxonomic classification at the species level and ASVs are identified up to most resolutive taxonomic level.
Fig. 4
Fig. 4. Markers of immune activation are associated with unique microbial alterations in each region.
a Boxplots showing sCD14 and iFABP plasma measurements in non-MSM (men who have sex with men) HIV-infected and -uninfected individuals in each of the cohorts (***p value < 0.01, **p value < 0.05). n = 115(U.S.)/194(Botswana)/170(Uganda) biologically independent samples. Boxplots are displayed with the median as the center value with the box as IQR and whiskers as minima and maxima. Significance determined by Kruskal–Wallis with Bonferroni correction (three groups) or Wilcoxon (two groups) testing. U.S./sCD14: χ2(df = 2) = 14.4, p < 0.001; pairwise comparisons: HIV-uninfected vs ART (antiretroviral)-treated Z = 2.68 (p = 0.007), HIV-uninfected vs untreated HIV infection Z = 3.29 (p = 0.001), ART-treated vs untreated HIV infection Z = 0.96 (p = 0.34). U.S./iFABP: χ2(df = 2) = 21.4, p < 0.001; pairwise comparisons: HIV-uninfected vs ART-treated Z = 3.43 (p = 0.0006), HIV-uninfected vs untreated HIV infection Z = 3.89 (p = 0.0001), ART-treated vs untreated HIV infection Z = 1.15 (p = 0.25). Botswana/sCD14: χ2(df = 2) = 52.5, p < 0.001; pairwise comparisons: HIV-uninfected vs ART-treated Z > 4 (p < 0.0001), HIV-uninfected vs untreated HIV infection Z > 4 (p < 0.0001), ART-treated vs untreated HIV infection Z = 0.34 (p = 0.73). Botswana/iFABP: χ2(df = 2) = 35.2, p < 0.001; pairwise comparisons: HIV-uninfected vs ART-treated Z > 4 (p < 0.0001), HIV-uninfected vs untreated HIV infection Z = 3.09 (p = 0.002), ART-treated vs untreated HIV infection Z = 1.51 (p = 0.13). Uganda/sCD14: Wilcoxon W = 2040, p < 0.0001. Uganda/iFABP: Wilcoxon W = 2758, p = 0.11. b Association between each plasma marker and the total relative abundance of all the ASVs with significantly different abundance between ART-treated HIV-infected and -uninfected individuals in each of the cohorts. Each dot is a sample and the color represents whether they are ART-treated HIV-infected (light) or HIV-uninfected individuals (dark). Rho and p values were determined via two-sided Pearson’s correlation. Trendline fit using linear regression and error band denotes 95% confidence interval. U.S./decreased/sCD14: t(df = 100) = −2.07, p = 0.041, Rho = −0.20 [−0.38, −0.01]; U.S./decreased/iFABP: t(df = 100) = −0.45, p = 0.66, Rho = −0.045 [−0.23, 0.15]; Botswana/decreased/sCD14: t(df = 125) = −1.37, p = 0.17, Rho = −0.12 [−0.29, 0.05]; Botswana/increased/sCD14: t(df = 125) = 1.89, p = 0.061, Rho = 0.17 [−0.01, 0.33]; Botswana/decreased/iFABP: t(df = 125) = −0.69, p = 0.49, Rho = −0.061 [−0.23, 0.11]; Botswana/increased/iFABP: t(df = 125) = 2.62, p = 0.01, Rho = 0.23 [0.06, 0.39]; Uganda/decreased/sCD14: t(df = 159) = −3.74, p = 0.00025, Rho = −0.28 [−0.42, −0.14]; Uganda/increased/sCD14: t(df = 159) = 2.89, p = 0.0044, Rho = 0.22 [0.07, 0.37]; Uganda/decreased/iFABP: t(df = 159) = −0.89, p = 0.37, Rho = −0.071 [−0.22, 0.09]; Uganda/increased/iFABP t(df = 159) = 1.99, p = 0.048, Rho = 0.16 [0.001, 0.30]. c Spearman correlation between the relative abundance of each individual ASV detected in the ANCOM comparison between ART-treated HIV-infected and -uninfected subjects in each cohort, and either sCD14 or iFABP. Color code represents the Rho value. Statistically significant correlations after adjusting with FDR are highlighted in a black square (threshold set to 0.05). For each geographic location, ASVs are ordered from highest to lowest Log2FC in the ANCOM comparison (Fig. 2b–d). d Zoom out from panel (c) highlighting those ASVs that are shared among at least 2 of the geographical locations.

References

    1. Biedermann L, Rogler G. The intestinal microbiota: its role in health and disease. Eur. J. Pediatr. 2015;174:151–167. doi: 10.1007/s00431-014-2476-2. - DOI - PubMed
    1. Clemente JC, Ursell LK, Parfrey LW, Knight R. The impact of the gut microbiota on human health: an integrative view. Cell. 2012;148:1258–1270. doi: 10.1016/j.cell.2012.01.035. - DOI - PMC - PubMed
    1. Das, B. & Nair, G. B. Homeostasis and dysbiosis of the gut microbiome in health and disease. J. Biosci.44, 117 (2019). - PubMed
    1. Gootenberg DB, Paer JM, Luevano JM, Kwon DS. HIV-associated changes in the enteric microbial community: potential role in loss of homeostasis and development of systemic inflammation. Curr. Opin. Infect. Dis. 2017;30:31–43. doi: 10.1097/QCO.0000000000000341. - DOI - PMC - PubMed
    1. Yang Y, Jobin C. Microbial imbalance and intestinal pathologies: connections and contributions. Dis. Model Mech. 2014;7:1131–1142. doi: 10.1242/dmm.016428. - DOI - PMC - PubMed