. 2024 Feb 5;15(1):1069.
doi: 10.1038/s41467-024-45152-y.

Geographic pair matching in large-scale cluster randomized trials

Affiliations

Geographic pair matching in large-scale cluster randomized trials

Benjamin F Arnold et al. Nat Commun. .

Abstract

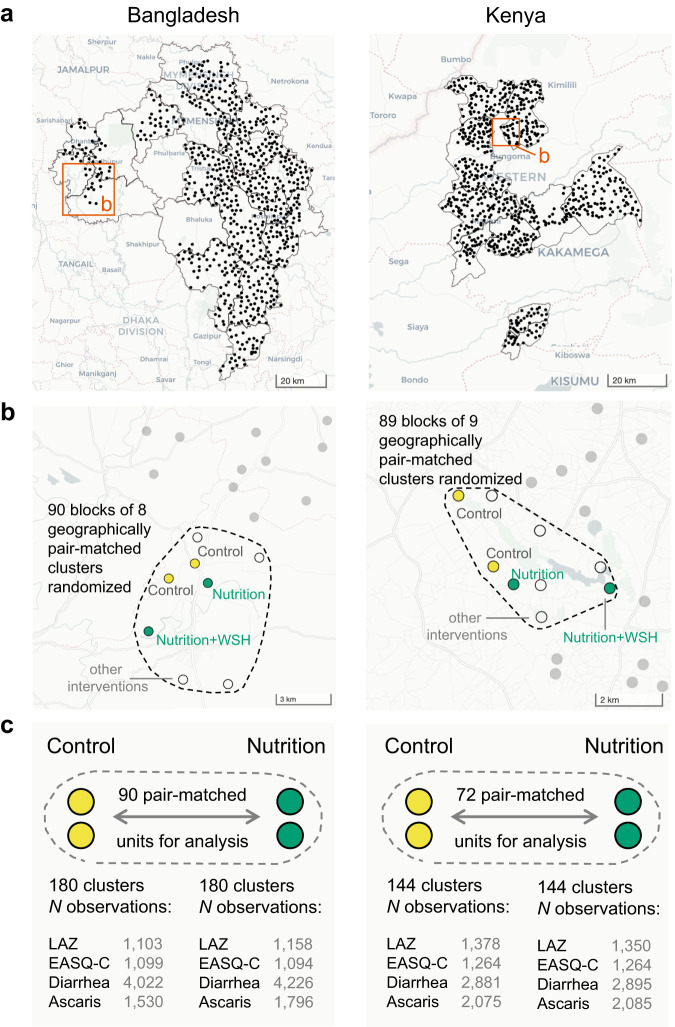
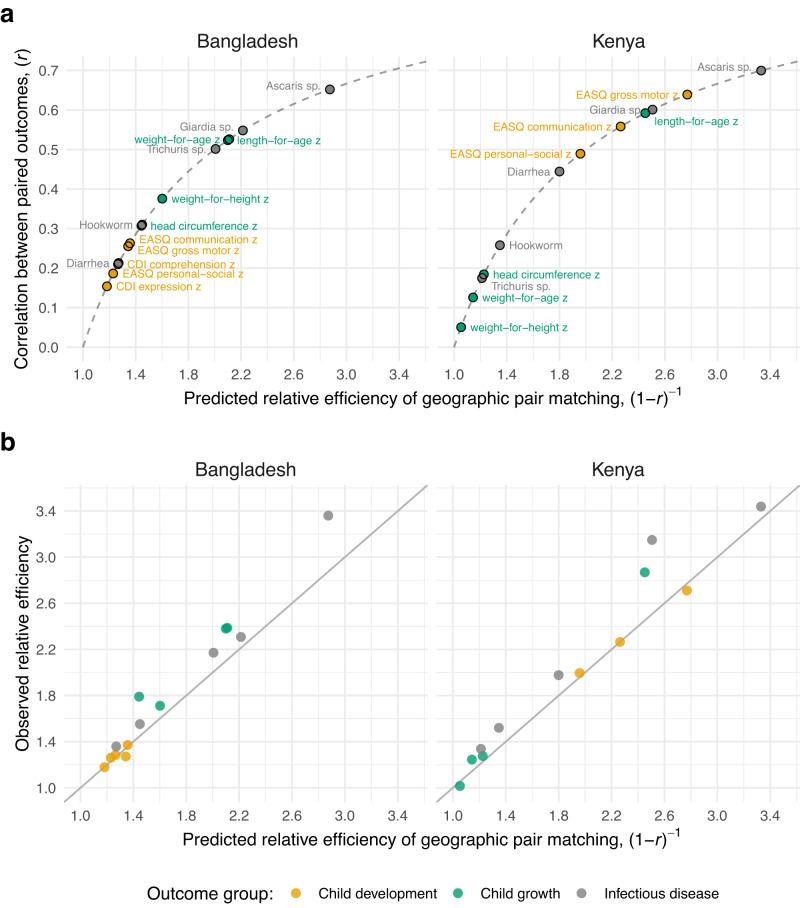
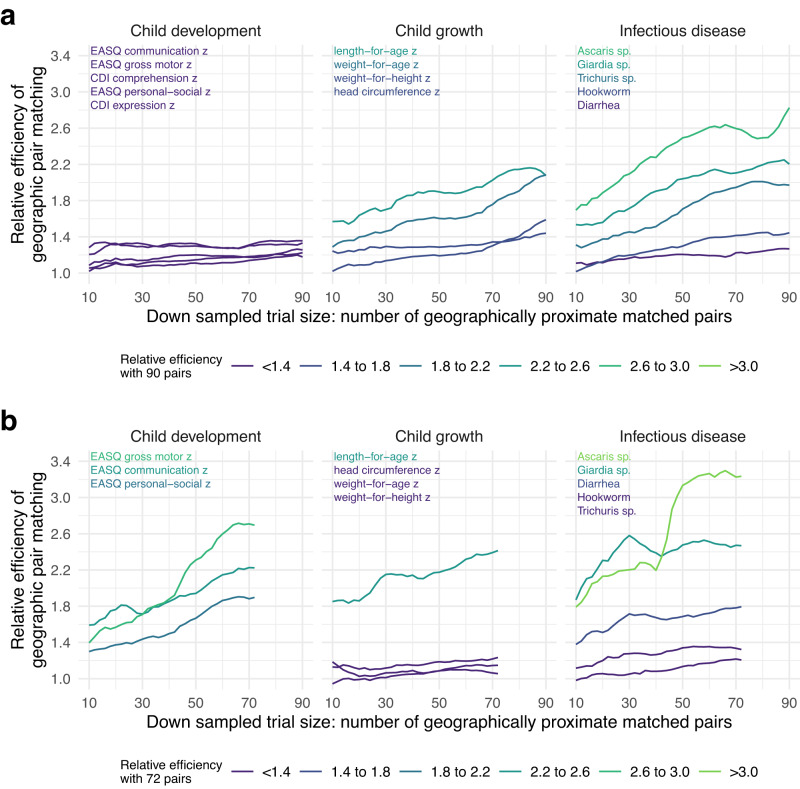
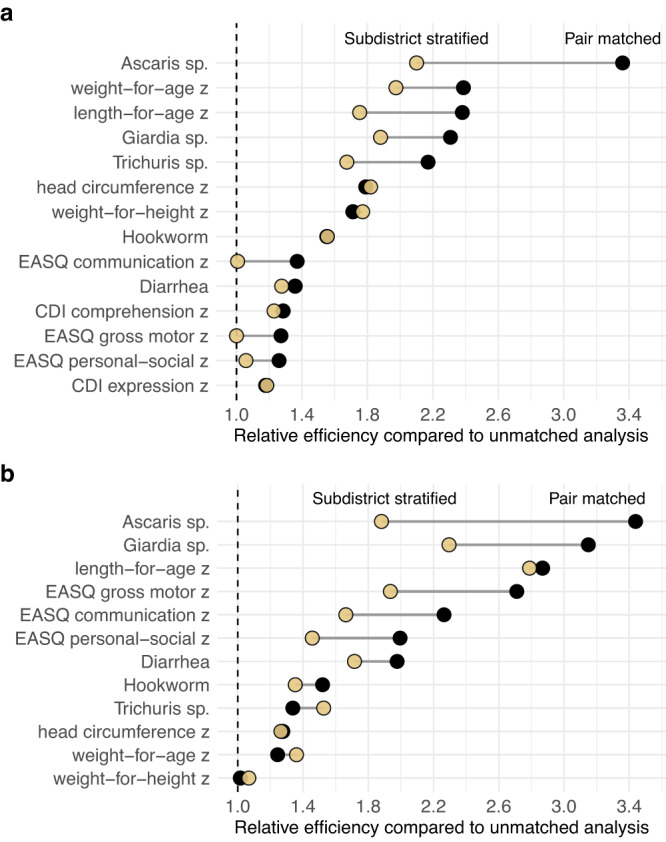
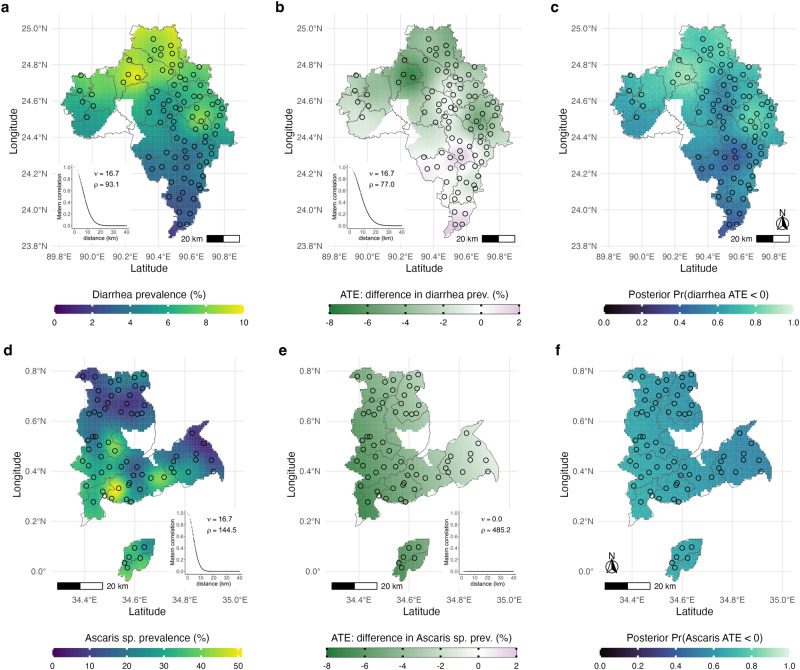
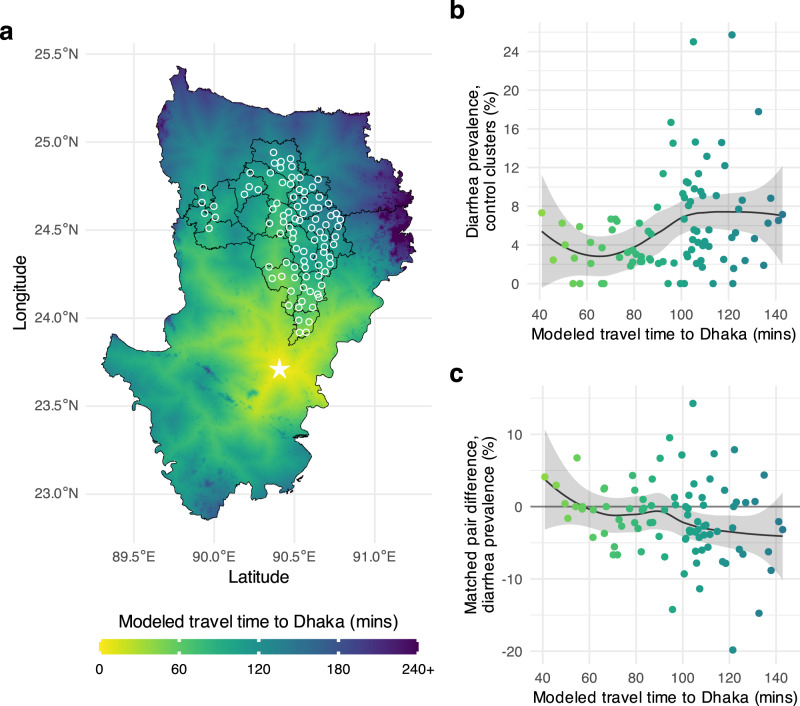
Cluster randomized trials are often used to study large-scale public health interventions. In large trials, even small improvements in statistical efficiency can have profound impacts on the required sample size and cost. Location integrates many socio-demographic and environmental characteristics into a single, readily available feature. Here we show that pair matching by geographic location leads to substantial gains in statistical efficiency for 14 child health outcomes that span growth, development, and infectious disease through a re-analysis of two large-scale trials of nutritional and environmental interventions in Bangladesh and Kenya. Relative efficiencies from pair matching are ≥1.1 for all outcomes and regularly exceed 2.0, meaning an unmatched trial would need to enroll at least twice as many clusters to achieve the same level of precision as the geographically pair matched design. We also show that geographically pair matched designs enable estimation of fine-scale, spatially varying effect heterogeneity under minimal assumptions. Our results demonstrate broad, substantial benefits of geographic pair matching in large-scale, cluster randomized trials.


Conflict of interest statement

The authors declare no competing interests.

Figures

Fig. 1
Fig. 1. Overview of geographically pair matched designs in the WASH Benefits Bangladesh and Kenya trials.
a Large-scale cluster randomized trials in Bangladesh (n = 720 clusters) and Kenya (n = 702 clusters). Points indicate study clusters, with subdistricts and panel b insets outlined. b Clusters were geographically pair matched in blocks of 8 (Bangladesh) or 9 (Kenya) and then randomized. Children in the control and nutritional intervention clusters were included in the present analyses. c Sample sizes included in analyses for four representative outcomes, length-for-age z (LAZ), verbal communication scores (EASQ-C), diarrhea and Ascaris sp. infection. The Kenya trial was restricted from 89 to 72 blocks with a balanced set of control (2) and nutrition (2) clusters. Supplementary Information Tables 1 and 2 include sample sizes for all outcomes. Open source data from OpenStreetMap with rendering from CARTO using R’s leaflet package. Created with notebook https://osf.io/bzrpk.
Fig. 2
Fig. 2. Relative efficiency of geographic pair matching compared to an unmatched design in the Bangladesh and Kenya WASH Benefits trials.
a Paired outcome correlation across geographically matched pairs (n = 90 in Bangladesh, n = 72 in Kenya), translated into predicted relative efficiency for 14 child development, child growth, and infectious disease outcomes. Dashed lines show the (1-r)−1 function, the predicted relationship between pair-wise correlation (r) and relative efficiency. b Observed relative efficiency of a the non-parametric, pair matched estimator versus gains predicted based on the paired outcome correlation in panel a. The observed relative efficiency used an unmatched analysis as the basis for comparison (Methods). A solid line marks the 1:1 axis. Correlation estimates based on outcomes weighted by sample sizes of each pair. MacArthur-Bates Communicative Development Inventory (CDI) comprehension and expression were only measured in the Bangladesh trial. Created with notebooks https://osf.io/pdver and https://osf.io/d2x3b.
Fig. 3
Fig. 3. Relative efficiency of geographic pair matching across resampled trials of varying size.
a Relative efficiency of geographic pair matching compared with an unmatched design by number of geographically proximate matched pairs in the Bangladesh trial. Lines represent mean relative efficiency over 1000 bootstrap resampled subsets of geographically proximate matched pairs in samples ranging from 10 to 90 pairs. Outcome labels in each panel are ordered and colored by relative efficiency with 90 pairs. b Similar estimates of mean relative efficiency over 1000 bootstrap resampled subsets of different sizes in the Kenya trial, ranging from subsamples of 10 to 72 pairs. MacArthur-Bates Communicative Development Inventory (CDI) comprehension and expression were only measured in the Bangladesh trial. Created with notebook https://osf.io/n276c.
Fig. 4
Fig. 4. Relative efficiency of geographic pair matching and subdistrict stratified estimators.
a Estimates from the Bangladesh trial (90 matched pairs in 19 subdistricts) for 14 outcomes, sorted by the relative efficiency of the pair matched estimator. b Estimates from the Kenya trial (72 matched pairs in 10 subdistricts) for 12 outcomes, sorted by the relative efficiency of the pair matched estimator. MacArthur-Bates Communicative Development Inventory (CDI) comprehension and expression were only measured in the Bangladesh trial. In both panels, relative efficiency was estimated as the ratio of the variance between a non-parametric, unmatched estimator and each alternative estimator. Created with notebooks https://osf.io/89g7m and https://osf.io/d2x3b.
Fig. 5
Fig. 5. Spatial heterogeneity of intervention effects in geographically pair matched trials.
a Spatially heterogeneity in diarrhea prevalence in the control group in the WASH Benefits Bangladesh trial, visualized through universal outcome kriging with a Matérn spatial correlation structure. b Spatially smoothed average treatment effects (ATE) of matched-pair differences of diarrhea prevalence comparing nutrition and control clusters in the Bangladesh trial. c Posterior probability that the nutrition intervention reduced diarrhea in Bangladesh, derived from the geostatistical model used to smooth the ATE in panel b. d Spatial heterogeneity in Ascaris sp. infection prevalence in the Kenya trial. e Spatially smoothed ATE of matched-pair differences of Ascaris sp. prevalence comparing nutrition and control clusters in the WASH Benefits Kenya trial. f Posterior probability that the nutrition intervention reduced Ascaris sp. infection in Kenya, derived from the geostatistical model used to smooth the ATE in panel e. Smoothed surfaces at 1 km resolution were estimated using a geostatistical model with Matérn spatial covariance, trimmed by study subdistrict boundaries and a 10 km buffer around matched pair centroids. Insets of panels a, b, d and e show estimated parameters and Matérn correlation function with distance between matched pairs, illustrating no spatial correlation in the ATE for Ascaris sp. in Kenya. Points represent matched pair centroids and lines demark subdistricts in the study regions (zillas in Bangladesh, sub-counties in Kenya). In panels c and f, posterior probabilities were estimated from 1,000 simulation replicates at each location, drawn from the geostatistical model fits of the ATE (Methods) Created with notebook https://osf.io/j9r4k.
Fig. 6
Fig. 6. Heterogeneity in the effect of nutrition on diarrhea prevalence by travel time from Dhaka, Bangladesh.
a Modeled travel time in minutes at 1 km2 resolution between Dhaka (marked by a star) and the 90 WASH Benefits Bangladesh matched pair centroids (white circles). Black lines mark subdistricts (zillas). b Diarrhea prevalence in control clusters by travel time to Dhaka. The line represents a non-parametric locally weighted regression fit, and the shaded band its approximate pointwise 95% confidence interval c Matched pair differences in diarrhea prevalence (nutrition – control) by travel time to Dhaka. The line represents a non-parametric locally weighted regression fit, and the shaded band its approximate pointwise 95% confidence interval. In panels b and c, points are colored by the surface in panel a. Created with notebook https://osf.io/fmgex.

Update of

References

    1. Murray DM, Varnell SP, Blitstein JL. Design and analysis of group-randomized trials: a review of recent methodological developments. Am. J. Public Health. 2004;94:423–432. doi: 10.2105/AJPH.94.3.423. - DOI - PMC - PubMed
    1. Dron L, et al. The role and challenges of cluster randomised trials for global health. Lancet Glob. Health. 2021;9:e701–e710. doi: 10.1016/S2214-109X(20)30541-6. - DOI - PubMed
    1. Hayes, R. J. & Moulton, L. H. Cluster randomised trials. (Taylor & Francis Group, 2017).
    1. Luby SP, et al. Effects of water quality, sanitation, handwashing, and nutritional interventions on diarrhoea and child growth in rural Bangladesh: a cluster randomised controlled trial. Lancet Glob. Health. 2018;6:e302–e315. doi: 10.1016/S2214-109X(17)30490-4. - DOI - PMC - PubMed
    1. Null C, et al. Effects of water quality, sanitation, handwashing, and nutritional interventions on diarrhoea and child growth in rural Kenya: a cluster-randomised controlled trial. Lancet Glob. Health. 2018;6:e316–e329. doi: 10.1016/S2214-109X(18)30005-6. - DOI - PMC - PubMed