Meta-Analysis
. 2024 Feb 5;15(1):1082.
doi: 10.1038/s41467-024-45074-9.

Health effects associated with chewing tobacco: a Burden of Proof study

Affiliations
Meta-Analysis

Health effects associated with chewing tobacco: a Burden of Proof study

Gabriela F Gil et al. Nat Commun. .

Abstract

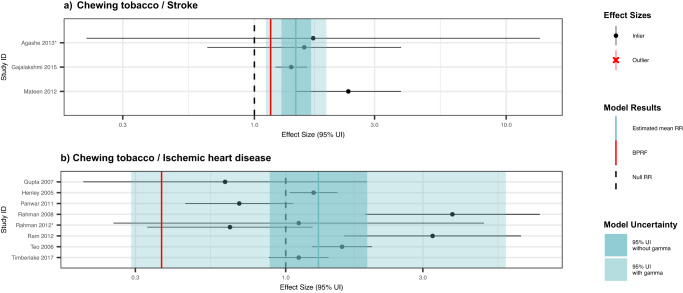
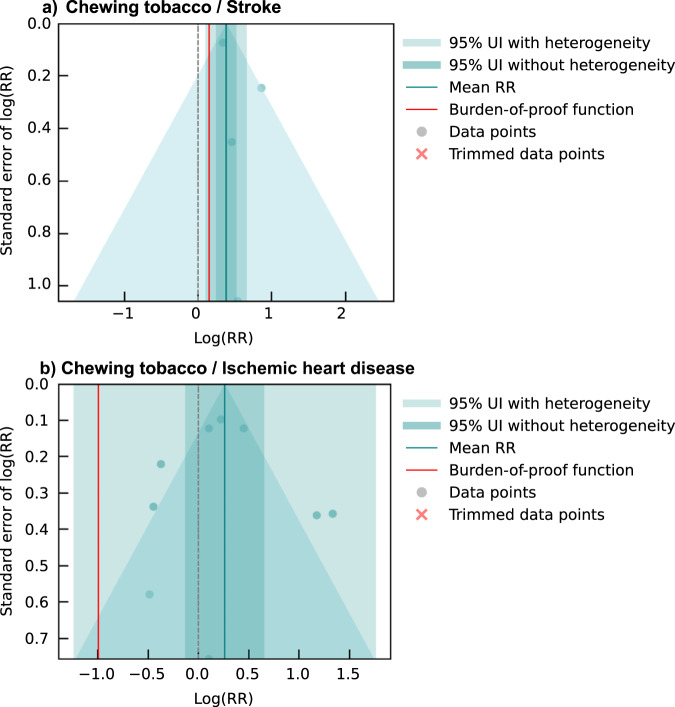
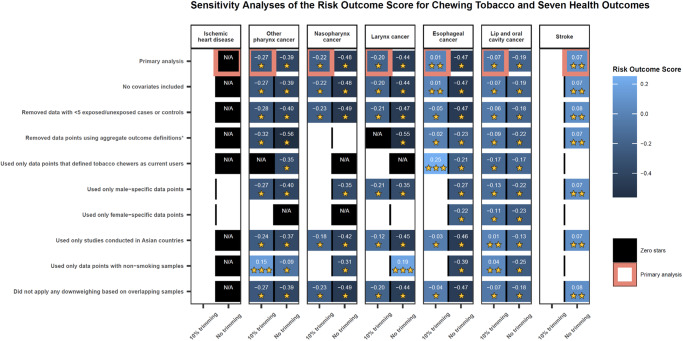
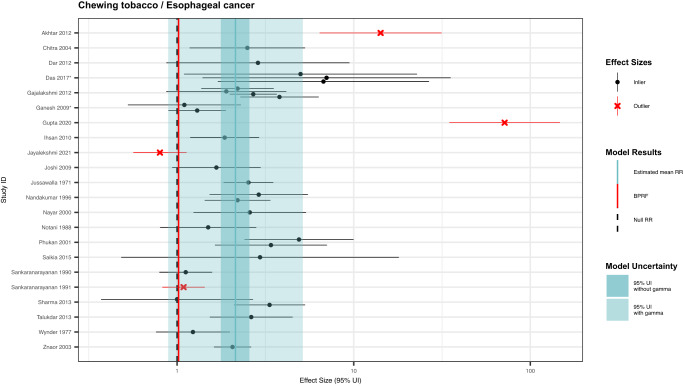
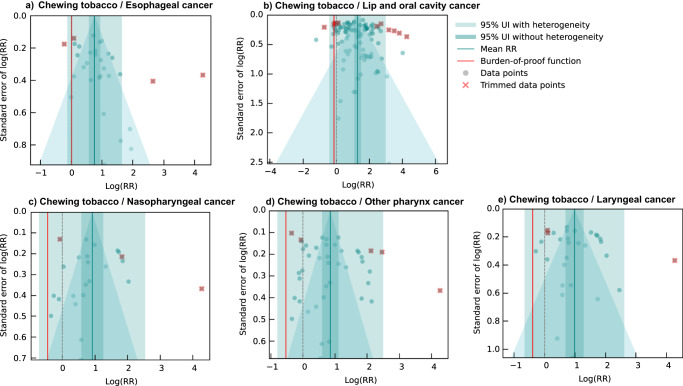
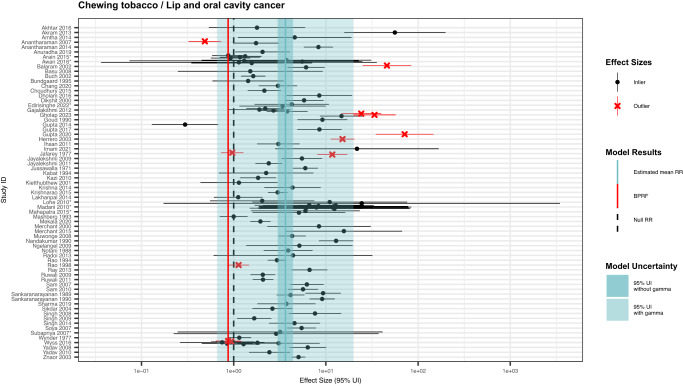
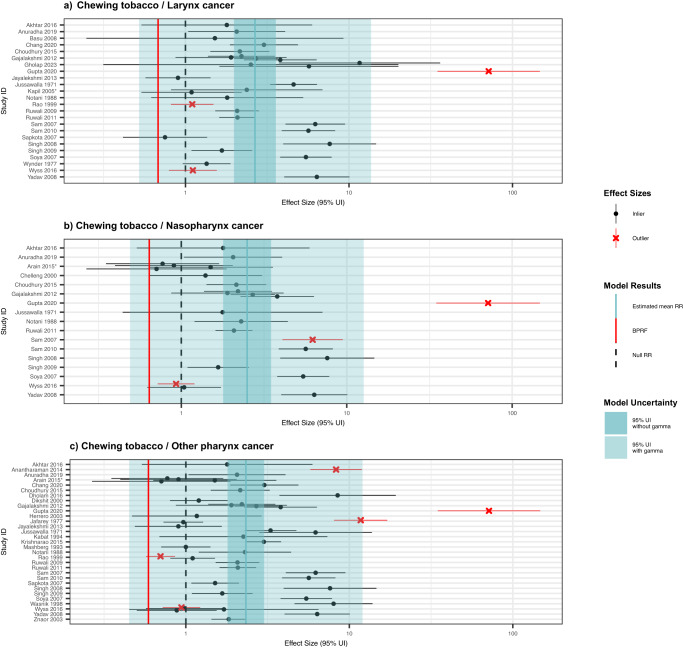
Chewing tobacco use poses serious health risks; yet it has not received as much attention as other tobacco-related products. This study synthesizes existing evidence regarding the health impacts of chewing tobacco while accounting for various sources of uncertainty. We conducted a systematic review and meta-analysis of chewing tobacco and seven health outcomes, drawing on 103 studies published from 1970 to 2023. We use a Burden of Proof meta-analysis to generate conservative risk estimates and find weak-to-moderate evidence that tobacco chewers have an increased risk of stroke, lip and oral cavity cancer, esophageal cancer, nasopharynx cancer, other pharynx cancer, and laryngeal cancer. We additionally find insufficient evidence of an association between chewing tobacco and ischemic heart disease. Our findings highlight a need for policy makers, researchers, and communities at risk to devote greater attention to chewing tobacco by both advancing tobacco control efforts and investing in strengthening the existing evidence base.


Conflict of interest statement

The authors declare no competing interests.

Figures

Fig. 1
Fig. 1. Forest plots of underlying data for chewing tobacco and two cardiovascular outcomes.
These forest plots depict the estimated mean relative risk (blue vertical line) and its 95% uncertainty interval (blue shaded intervals) for the association between chewing tobacco and stroke (panel a) and for the association between chewing tobacco and ischemic heart disease (panel b) and the underlying data points. The narrower darker blue intervals correspond to the 95% uncertainty interval estimated without accounting for between-study heterogeneity in accordance with traditional meta-analytic approaches. The light blue intervals correspond to the 95% uncertainty interval that incorporates between-study heterogeneity and the uncertainty around it. Similarly, the red vertical lines are the Burden of Proof Risk Function (BPRF), which correspond to the 5th quantile and is used to derive our risk-outcome score (ROS) for risk-outcome pairs in which the darker blue intervals (the 95% uncertainty interval without between-study heterogeneity) do not include the null value at relative risk = 1. The black dotted vertical lines reflect the null relative risk at 1. The black data points and horizontal lines each correspond to an effect size and 95% uncertainty interval from the study noted in on the y-axes that were included in the models. Neither model qualified for trimming, so no observations are marked with red Xs. Studies noted with an asterisk include effect sizes from overlapping samples whose uncertainty interval was scaled based on the number of overlapping observations to avoid overrepresenting one sample in the models.
Fig. 2
Fig. 2. Modified funnel plots for chewing tobacco and two cardiovascular disease outcomes.
These modified funnel plots show the residuals of the reported mean relative risk (RR) relative to 0, the null value, on the x-axis and the residuals of the standard error, as estimated from both the reported standard error and gamma, relative to 0 on the y-axis for the association between chewing tobacco and stroke (panel a) and between chewing tobacco and ischemic heart disease (panel b). The light blue vertical interval corresponds to the 95% uncertainty interval incorporating between-study heterogeneity; the dark blue vertical interval corresponds to the 95% uncertainty interval without between-study heterogeneity; the dots are each included observation; the red Xs are outliered observations if relevant; the grey dotted line reflects the null log(RR); the blue line is the mean log(RR) for chewing tobacco and the outcome of interest; the red line is the burden of proof function at the 5th quantile for these harmful risk-outcome associations.
Fig. 3
Fig. 3. Summarized results of various sensitivity analyses conducted across all seven health outcomes.
This heatmap reports the results of the various sensitivity analyses conducted for the seven health outcomes. The details of each, beyond the description on the y-axis, are described in detail in the Supplementary Information. Each model parameter or change in data inclusion was tested both incorporating 10% trimming and with no trimming, as depicted along the x-axis. It was only feasible to test models with more than three observations, and 10% trimming could only be implemented for models with more than 10 observations. The model combinations that were not possible to test are depicted as white boxes. The color of the blue boxes and number in each box corresponds to the risk-outcome score (ROS) calculated for models in which the estimates of association without incorporating between-study heterogeneity were statistically significant. Black boxes depict models that did not pass this threshold and, thus, ROS did not apply (N/A). For models that did pass this threshold, the ROS reflects a conservative interpretation of the data that aligns with the Burden of Proof approach incorporating between-study heterogeneity and other sources of uncertainty. The ROS translates into a star rating from 1 to 5 stars. The star rating for each model result is reported as the yellow stars in each box. A one-star association suggests that there is weak evidence supporting estimates of an association between the risk and outcome. A two-star association reflects that there is weak-to-moderate evidence suggesting an association between the risk and outcome, and additional stars illustrate increasing strength of evidence. The pink outlined boxes highlight our primary models with the trimming approach that corresponds to the number of observations (10% trimming for models with more than 10 observations; no trimming for models with fewer observations).
Fig. 4
Fig. 4. Forest plot of underlying data for chewing tobacco and esophageal cancer.
This forest plot depicts the estimated mean relative risk (blue vertical line) and its 95% uncertainty interval (blue shaded intervals) for the association between chewing tobacco and esophageal cancer and the data points used to produce our primary results. The narrower darker blue interval corresponds to the 95% uncertainty interval estimated without accounting for between-study heterogeneity in accordance with traditional meta-analytic approaches. The light blue interval corresponds to the 95% uncertainty interval that incorporates between-study heterogeneity and the uncertainty around it in alignment with our Burden of Proof meta-analytic approach. Similarly, the red vertical line is the Burden of Proof Risk Function (BPRF), which corresponds to the 5th quantile and is the estimate from which our risk-outcome score (ROS) is derived for risk-outcome pairs in which the darker blue interval (the 95% uncertainty interval without between-study heterogeneity) does not include the null value at relative risk = 1. The black dotted vertical line reflects the null relative risk at 1. The black data points and horizontal lines each correspond to an effect size and 95% uncertainty interval from the study noted in on the y-axis that was included in the model. The red Xs and horizontal lines correspond to effect sizes and 95% uncertainty intervals from the studies on the y-axis that were automatically trimmed by the trimming algorithm based on deviation from the mean. Studies noted with an asterisk include effect sizes from overlapping samples whose uncertainty interval was scaled based on the number of overlapping observations to avoid overrepresenting one sample in the model.
Fig. 5
Fig. 5. Modified funnel plots for chewing tobacco and five head and neck cancer outcomes.
These modified funnel plots show the residuals of the reported mean relative risk (RR) relative to 0, the null value, on the x-axis and the residuals of the standard deviation, as estimated from both the reported standard deviation and gamma, relative to 0 on the y-axis. Each funnel plot corresponds to a different model for esophageal cancer (panel a), lip and oral cavity cancer (panel b), nasopharyngeal cancer (panel c), other pharynx cancer (panel d), and laryngeal cancer (panel e) and their corresponding association with chewing tobacco. The light blue vertical interval corresponds to the 95% uncertainty interval incorporating between-study heterogeneity; the dark blue vertical interval corresponds to the 95% uncertainty interval without between-study heterogeneity; the dots are each included observation; the red Xs are outliered observations; the grey dotted line reflects the null log(RR); the blue line is the mean log(RR) for chewing tobacco and the outcome of interest; the red line is the burden of proof function at the 5th quantile for these harmful risk-outcome associations.
Fig. 6
Fig. 6. Forest plot of underlying data for chewing tobacco and lip and oral cavity cancer.
This forest plot depicts the estimated mean relative risk (blue vertical line) and its 95% uncertainty interval (blue shaded intervals) for the association between chewing tobacco and lip and oral cavity cancer and the data points used to produce our primary results. The narrower darker blue interval corresponds to the 95% uncertainty interval estimated without accounting for between-study heterogeneity in accordance with traditional meta-analytic approaches. The light blue interval corresponds to the 95% uncertainty interval that incorporates between-study heterogeneity and the uncertainty around it in alignment with our Burden of Proof meta-analytic approach. Similarly, the red vertical line is the Burden of Proof Risk Function (BPRF), which corresponds to the 5th quantile and is the estimate from which our risk-outcome score (ROS) is derived for risk-outcome pairs in which the darker blue interval (the 95% uncertainty interval without between-study heterogeneity) does not include the null value at relative risk = 1. The black dotted vertical line reflects the null relative risk at 1. The black data points and horizontal lines each correspond to an effect size and 95% uncertainty interval from the study noted in on the y-axis that was included in the model. The red Xs and horizontal lines correspond to effect sizes and 95% uncertainty intervals from the studies on the y-axis that were automatically trimmed by the trimming algorithm based on deviation from the mean. Studies noted with an asterisk include effect sizes from overlapping samples whose uncertainty interval was scaled based on the number of overlapping observations to avoid overrepresenting one sample in the model.
Fig. 7
Fig. 7. Forest plots of underlying data for chewing tobacco and three other head and neck cancers.
These forest plots depict the estimated mean relative risk (blue vertical line) and its 95% uncertainty interval (blue shaded intervals) for the association between chewing tobacco and laryngeal cancer (panel a), for the association between chewing tobacco and nasopharyngeal cancer (panel b), and for the association between chewing tobacco and other pharyngeal cancer (panel c) and the underlying data points. The narrower darker blue intervals correspond to the 95% uncertainty interval estimated without accounting for between-study heterogeneity in accordance with traditional meta-analytic approaches. The light blue intervals correspond to the 95% uncertainty interval that incorporates between-study heterogeneity and the uncertainty around it. Similarly, the red vertical lines are the Burden of Proof Risk Function (BPRF), which correspond to the 5th quantile and is used to derive our risk-outcome score (ROS) for risk-outcome pairs in which the darker blue intervals (the 95% uncertainty interval without between-study heterogeneity) do not include the null value at relative risk = 1. The black dotted vertical lines reflect the null relative risk at 1. The black data points and horizontal lines each correspond to an effect size and 95% uncertainty interval from the study noted in on the y-axes that were included in the models. The red Xs and horizontal lines correspond to effect sizes and 95% uncertainty intervals that were automatically trimmed based on deviation from the means. Studies noted with an asterisk include effect sizes from overlapping samples whose uncertainty interval was scaled based on the number of overlapping observations to avoid overrepresenting one sample in the models.

References

    1. Mehrotra R, et al. Smokeless tobacco control in 180 countries across the globe: call to action for full implementation of WHO FCTC measures. Lancet Oncol. 2019;20:e208–e217. doi: 10.1016/S1470-2045(19)30084-1. - DOI - PubMed
    1. Implementation practices in smokeless tobacco control. 28 https://fctc.who.int/publications/i/item/implementation-practices-in-smo... (2022).
    1. Kendrick, P. J. et al. Spatial, temporal, and demographic patterns in prevalence of chewing tobacco use in 204 countries and territories, 1990–2019: a systematic analysis from the Global Burden of Disease Study 2019. Lancet Public Health6, e482–e499 (2021). - PMC - PubMed
    1. WHO FCTC. Smokeless tobacco (SLT) products. WHO Framework Convention on Tobacco Controlhttps://extranet.who.int/fctcapps/fctcapps/fctc/kh/slt/news/smokeless-to... (2018).
    1. Sharan RN, Mehrotra R, Choudhury Y, Asotra K. Association of betel nut with carcinogenesis: Revisit with a clinical perspective. PLoS One. 2012;7:e42759. doi: 10.1371/journal.pone.0042759. - DOI - PMC - PubMed