. 2024 Feb 5;15(1):896.
doi: 10.1038/s41467-023-44667-0.

Bystander activated CD8+ T cells mediate neuropathology during viral infection via antigen-independent cytotoxicity

Affiliations

Bystander activated CD8+ T cells mediate neuropathology during viral infection via antigen-independent cytotoxicity

Elizabeth Balint et al. Nat Commun. .

Abstract

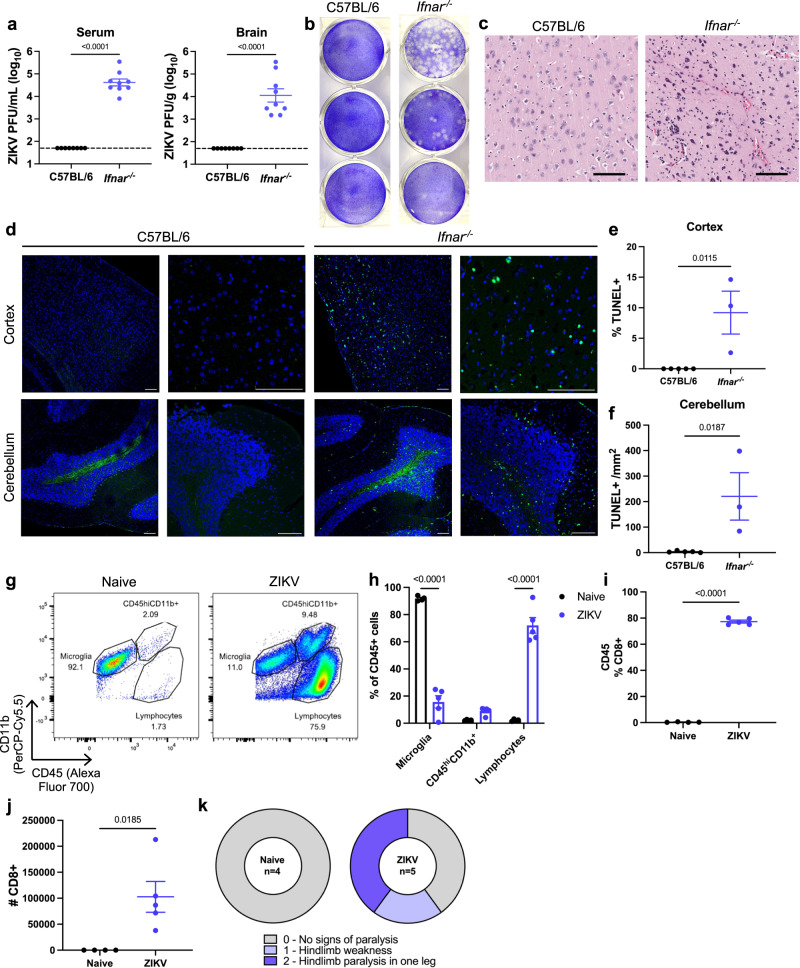
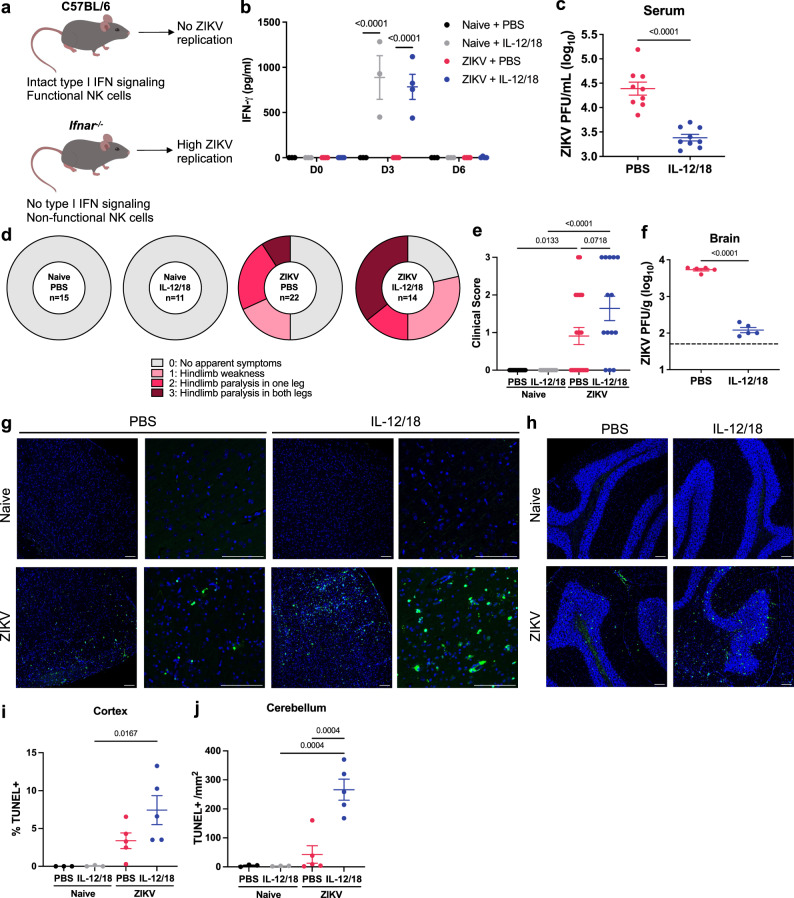
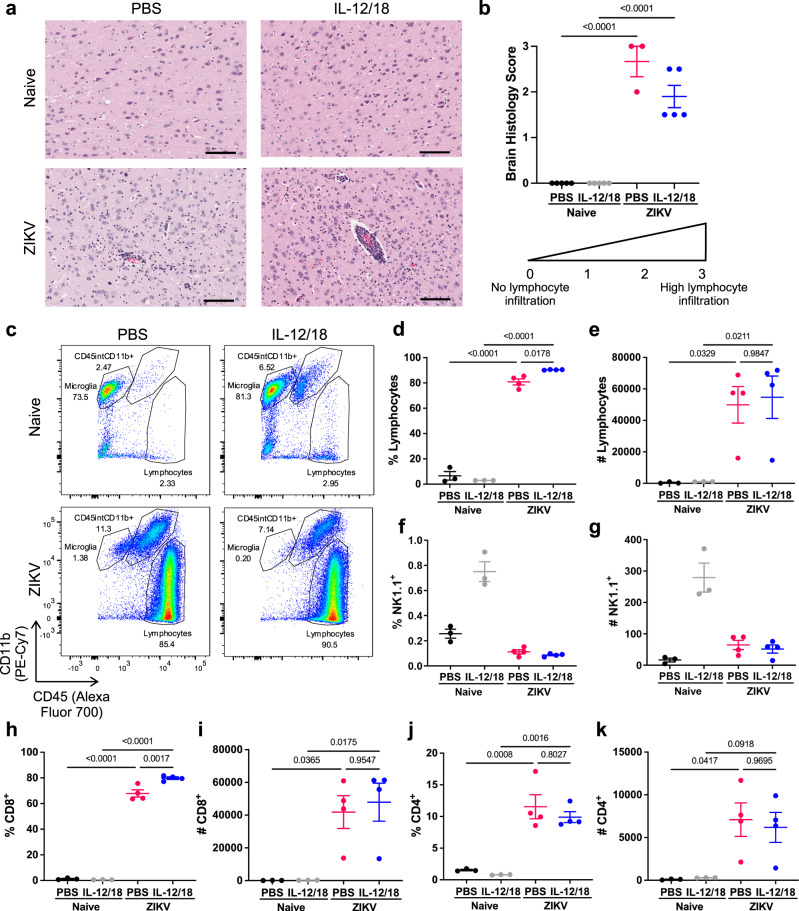
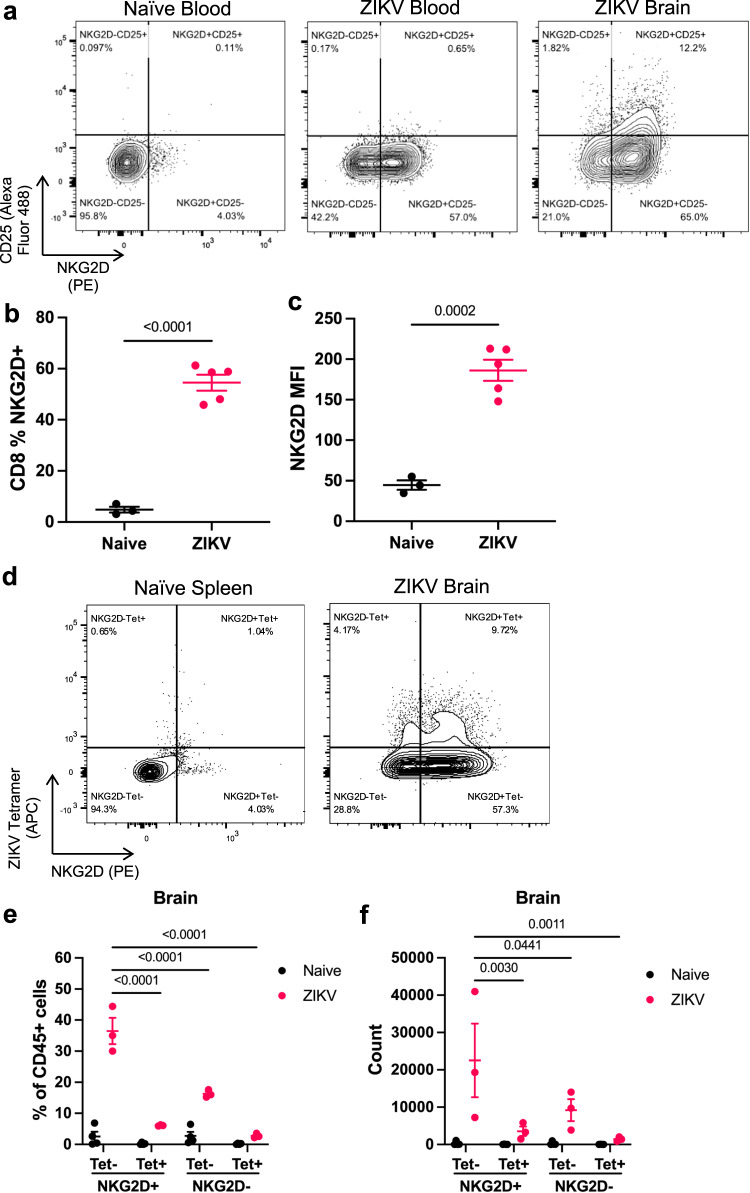
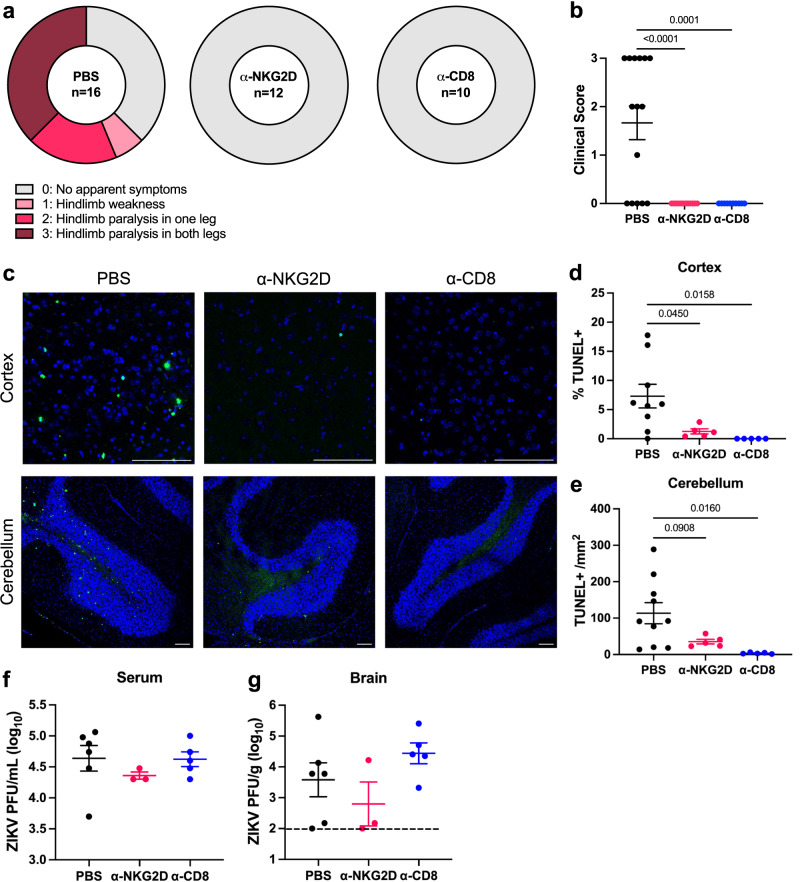
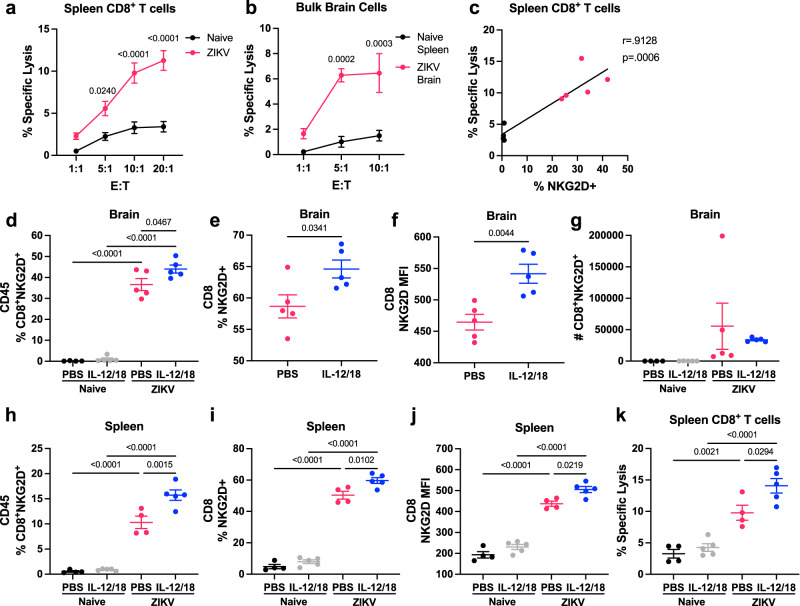
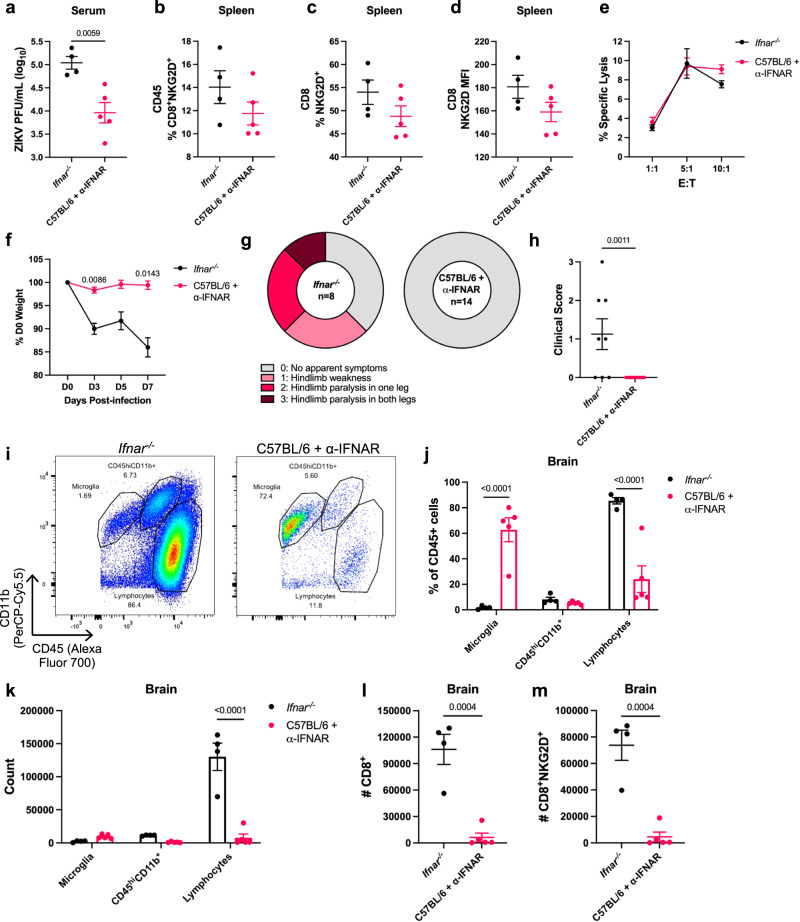
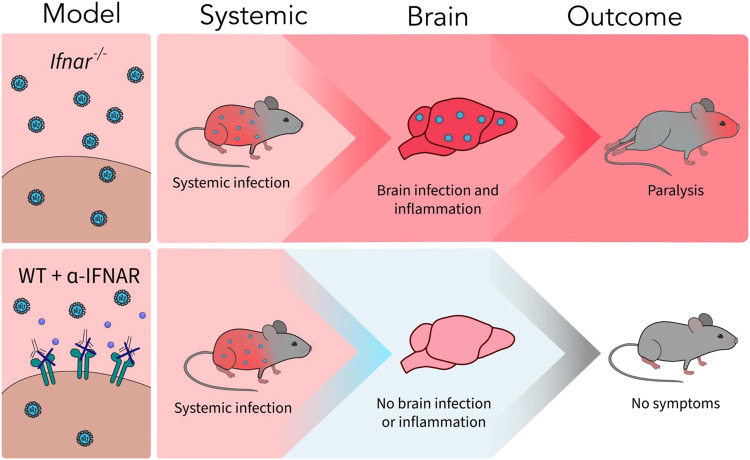
Although many viral infections are linked to the development of neurological disorders, the mechanism governing virus-induced neuropathology remains poorly understood, particularly when the virus is not directly neuropathic. Using a mouse model of Zika virus (ZIKV) infection, we found that the severity of neurological disease did not correlate with brain ZIKV titers, but rather with infiltration of bystander activated NKG2D+CD8+ T cells. Antibody depletion of CD8 or blockade of NKG2D prevented ZIKV-associated paralysis, suggesting that CD8+ T cells induce neurological disease independent of TCR signaling. Furthermore, spleen and brain CD8+ T cells exhibited antigen-independent cytotoxicity that correlated with NKG2D expression. Finally, viral infection and inflammation in the brain was necessary but not sufficient to induce neurological damage. We demonstrate that CD8+ T cells mediate virus-induced neuropathology via antigen-independent, NKG2D-mediated cytotoxicity, which may serve as a therapeutic target for treatment of virus-induced neurological disease.


Conflict of interest statement

The authors declare no competing interests.

Figures

Fig. 1
Fig. 1. ZIKV-infected Ifnar-/- mice exhibit clinical symptoms of neuropathology associated with immune cell infiltration of the brain.
C57BL/6 and Ifnar-/- mice were infected with 4 × 105 PFU ZIKV via FTPD. a Serum was collected at 3 dpi and brains were isolated at 7 dpi to quantify ZIKV by plaque assay (n =5, repeated once with similar results). b Representative images of a ZIKV plaque assay of serially diluted serum samples. c Representative images of H&E staining of the cortex of brains isolated from C57BL/6 and Ifnar-/- mice. Scale bar represents 100 μm. d Representative images of TUNEL staining of sagittal sections of cerebral cortex and cerebellum at ×10 and ×40 magnification. Scale bar represents 100 μm. e Quantification of % TUNEL+ nuclei in the cortex and f the # of TUNEL+ cells /mm2 within the granular layer (n =5, 3). g Representative flow cytometry plots of CD45+ cells isolated from PBS-treated (naïve) and ZIKV-infected Ifnar-/- mice at 7 dpi. See also Supplementary Fig. 1 for gating strategy. h Quantification of brain immune cell populations following PBS or ZIKV infection, represented as the percentage of CD45+ cells (n =4, 5). i Comparison of CD8+ T cells as a percentage of CD45+ cells and j absolute count of CD8+ T cells in the brains of PBS and ZIKV-infected mice (n =4, 5). k ZIKV-infected Ifnar-/- mice were assessed at 7 dpi for clinical symptoms of paralysis (n =5). Data represent mean ± SEM (a, e, f, h, i, j). Statistical significance was determined by two-tailed t-test (a, e, f, i, j) or two-way ANOVA with Sidak’s multiple comparison test (h). See also Supplementary Fig. 1. Source data are provided as a Source Data file.
Fig. 2
Fig. 2. Innate immune activation via IL-12/18 treatment of Ifnar-/- mice reduces ZIKV infection but enhances ZIKV-induced neuropathology.
a Visual representation of differences between C57BL/6 and Ifnar−/− mice and their susceptibility to ZIKV infection. b Ifnar−/− mice were infected with PBS or 4x10⁵ ZIKV PFU via FTPD and IP injected with PBS or IL-12/18 at 1 and 2 dpi. Serum was collected at 3 dpi and assessed for IFN-γ production (n =3, 3, 4, 4, repeated three times with similar results) or c viremia by plaque assay (n =9). d At 7 dpi, mice were assessed for clinical symptoms of paralysis (n =15, 11, 22, 14). e Quantification of d (n =15, 11, 22, 14). f ZIKV-infected mice were administered PBS or IL-12/18 at 0-3 dpi and brains were collected at 7 dpi for detection of infectious ZIKV particles (n =5). Dashed lines represent limit of detection. g Representative images of TUNEL staining of the cerebral cortex or h cerebellum. Scale bar represents 100 μm. i Quantification of % TUNEL+ nuclei in the cortex or j # of TUNEL+ nuclei/mm2 of the granular layer. Data represent mean ± SEM (b, c, e, f, i, j) of two (i) or three independent experiments (d, e). Statistical significance was determined by repeated measures (b) or ordinary (e) two-way ANOVA with Tukey’s multiple comparisons test and two-tailed Student’s t test (c, f, i, j). See also Supplementary Fig. 2. Source data are provided as a Source Data file.
Fig. 3
Fig. 3. Increased CD8+ T cell response in the brain correlates with exacerbated neurological disease in ZIKV-infected mice.
Ifnar-/- mice were infected with 4x10⁵ PFU via FTPD and administered PBS or IL-12/18 at 0-3 dpi (a, b) or 1 and 2 dpi (ck). a Representative images of H&E staining of the cortex of brains from naïve and ZIKV-infected mice treated with PBS or IL-12/18. Scale bar represents 100 μm. b Quantification of a. Data represent average scores per brain of two blinded measurements on a scale of 0–3, with 0 being no lymphocyte infiltration and 3 being high levels of infiltration and perivascular cuffing. c Representative flow cytometry plots of CD45+ cells isolated from brains of naïve and ZIKV-infected mice at 7 dpi. dk CD45+ cells were analyzed for proportion or total number of d, e lymphocytes, f, g NK1.1+, h, i CD8+, and j, k CD4+ (CD8-) cells (n =3, 3, 4, 4). Data represents mean ± SEM (b, dk). Statistical significance was determined by two-way ANOVA with Tukey’s multiple comparisons test (b, d, e, hk). See also Supplementary Fig. 1. Source data are provided as a Source Data file.
Fig. 4
Fig. 4. ZIKV infection induces a population of CD8+ T cells with a bystander activated phenotype.
Ifnar−/− mice were infected with PBS (naïve) or 4x10⁵ PFU ZIKV via FTPD. At 7 dpi, cells from the blood and brain were isolated for flow cytometry analysis. a Representative flow plots of NKG2D and CD25 staining of CD8+ T cells in the blood and brain of naïve and ZIKV-infected mice. b Proportion of blood CD8+ T cells that are NKG2D+(n =3, 5). c MFI of NKG2D on blood CD8+ T cells (n =3, 5). d Representative flow cytometry plots of APC-conjugated tetramer and NKG2D expression on CD8+ T cells in the naïve spleen and ZIKV-infected brains. e Proportion of CD45+ cells in naïve or ZIKV-infected brains that are CD8+ T cells and their expression of NKG2D and tetramer staining (n =3). f Counts of CD8+ T cells subset on NKG2D and tetramer staining (n =3). Data represent mean ± SEM (b, c, e, f) and represent one of two independent experiments with similar results. Statistical significance was determined by two-tailed t-test (b, c) and two-way ANOVA with Tukey’s multiple comparison test (e, f). Tet tetramer, MFI mean fluorescence intensity. See also Supplementary Fig. 3. Source data are provided as a Source Data file.
Fig. 5
Fig. 5. NKG2D blockade and CD8+ T cell depletion protect against ZIKV-induced neuropathology.
Ifnar-/- mice were infected with 4x10⁵ PFU via FTPD and treated with PBS, α-NKG2D, or α-CD8 antibody. a At 7 dpi, mice were assessed for clinical symptoms of paralysis (n =16, 12, 10; data represent three independent experiments). b Quantification of a. c Representative TUNEL staining of cerebral cortex and cerebellum at 7 dpi. Scale bar represents 100 μm. d Quantification of % TUNEL+ nuclei in the cortex or e # of TUNEL+ nuclei/mm2 of the granular layer of the cerebellum (n =9, 5, 5). f Serum was collected at 3 dpi and g brains were collected at 7 dpi for ZIKV quantification via plaque assay (n =5, 3, 5, data represent one of two independent experiments with similar results). Dashed lines represent limit of detection. Data represents mean ± SEM (b, df, g). Statistical significance was assessed by one-way ANOVA with Tukey’s multiple comparisons test (b, df, g, differences were not significant in f, g). See also Supplementary Fig. 4. Source data are provided as a Source Data file.
Fig. 6
Fig. 6. ZIKV infection in mice generates bystander activated CD8+ T cells capable of antigen-independent cytotoxicity.
Ifnar-/- mice were infected with PBS (naïve) or 4x10⁵ PFU ZIKV via FTPD. a At 7 dpi, spleens were harvested and CD8+ T cells isolated by negative selection. A cytotoxicity assay was performed by incubating CFSE-labeled YAC-1 cells with spleen CD8+ T cells at various effector:target (E:T) ratios (n =4, 5, repeated once with similar results). Each datapoint represents the mean of technical duplicates. b Bulk brain cells from ZIKV-infected mice were pooled, with 5 brains per sample (n =3) and compared to cytotoxicity of CD8+ T cells isolated from naïve mouse spleens (n =3, repeated once with similar results). Each datapoint represents the mean of technical duplicates. c Correlation of the proportion of spleen CD8+ T cells that were NKG2D+ with specific lysis at the 20:1 E:T ratio. dk Ifnar-/- mice were infected with PBS (naïve) or ZIKV and treated with PBS or IL-12/18 at 1 and 2 dpi. Brains were harvested for flow cytometry analysis and spleen CD8+ T cells were isolated for cytotoxicity assay at 7 dpi. d The proportion of brain CD45+ cells that were CD8+NKG2D+ (n =4, 5, 5, 5). e Proportion of brain CD8+ T cells from ZIKV-infected mice that were NKG2D+ (n =5). f MFI of NKG2D on brain CD8+ T cells from ZIKV-infected mice (n =5). g Count of CD8+NKG2D+ T cells in the brains of naïve and ZIKV-infected mice treated with PBS or IL-12/18 (n =4, 5, 5, 5). h Proportion of spleen CD45+ cells that were CD8+NKG2D+ (n =4, 5, 4, 5). i Proportion of spleen CD8+ T cells that were NKG2D+ (n =4, 5, 4, 5). j MFI of NKG2D on spleen CD8+ T cells (n =4, 5, 4, 5). k % specific lysis at 10:1 E:T ratios (n =4-5). Data represents mean ± SEM of one of two independent experiments with similar results (a, b, dk). Statistical significance was determined by two-way ANOVA with Sidak’s multiple comparison test (a, b) or Tukey’s multiple comparison test (d, gk), linear regression (c), and two-tailed Student’s t test (e, f). MFI mean fluorescence intensity. Source data are provided as a Source Data file.
Fig. 7
Fig. 7. ZIKV infection of α-IFNAR-treated C57BL/6 mice promotes bystander activation independent of viral load.
C57BL/6 mice were treated with α-IFNAR antibody at −1, 0, 1, 3, 5 dpi and infected via FTPD with 1.4 × 10⁶ ZIKV PFU. Ifnar-/- mice were infected via FTPD with 4 × 10⁵ ZIKV PFU. a Viral titer in the serum at 3 dpi (n =4, 5). b Spleen cells were isolated for flow cytometry at 8 dpi and CD45+ cells were assessed for % CD8+NKG2D+ T cells (n =4, 5). c Spleen CD8+ T cells were assessed for %NKG2D+ or D) NKG2D MFI (n =4, 5). e At 8 dpi, spleen CD8+ T cells were isolated via negative selection. A cytotoxicity assay was performed by incubating CFSE-labeled YAC-1 cells with spleen CD8+ T cells at various effector:target (E:T) ratios (n =4, 5). Each datapoint represents the mean of technical duplicates. f Weight loss at a % of D0 starting weight (n =4, 5). g Mice were assessed for clinical symptoms of paralysis at 8 dpi (n =8, 14; data represent two independent experiments). h Quantification of clinical scores in g (n =8, 14). i Representative flow cytometry plots of brains of ZIKV-infected Ifnar-/- and α-IFNAR-treated C57BL/6 mice. j Quantification of i (n =4, 5). k Counts of immune cell populations from i (n =4, 5). l Counts of CD8+ and m CD8+NKG2D+ in ZIKV-infected Ifnar-/- and α-IFNAR-treated C57BL/6 mice (n =4, 5). Data represents mean ± SEM (af, h, jm) of one of two independent experiments with similar results. Statistical significance was determined by two-tailed Student’s t test (ad, h, l, m) or repeated measures (f) or ordinary (e, j, k) two-way ANOVA with Sidak’s multiple comparisons test. MFI = mean fluorescence intensity. Source data are provided as a Source Data file.
Fig. 8
Fig. 8. Comparison of ZIKV infection and neurological outcomes in Ifnar-/- and C57BL/6 + α-IFNAR mouse models.
While both Ifnar-/- and C57BL/6 mice treated with α-IFNAR blocking antibody (WT + α-IFNAR) are susceptible to systemic ZIKV infection, only Ifnar-/- mice exhibit ZIKV infection and inflammation in the CNS, resulting in neurological symptoms of hindlimb paralysis.

Similar articles

Cited by

References

    1. Kawada JI, et al. Systemic cytokine responses in patients with influenza-associated encephalopathy. J. Infect. Dis. 2003;188:690–698. doi: 10.1086/377101. - DOI - PubMed
    1. Mizuguchi M, Yamanouchi H, Ichiyama T, Shiomi M. Acute encephalopathy associated with influenza and other viral infections. Acta Neurol. Scand. 2007;115:45–56. doi: 10.1111/j.1600-0404.2007.00809.x. - DOI - PubMed
    1. Carod-Artal FJ, Wichmann O, Farrar J, Gascón J. Neurological complications of dengue virus infection. Lancet Neurol. 2013;12:906–919. doi: 10.1016/S1474-4422(13)70150-9. - DOI - PubMed
    1. Ludlow M, McQuaid S, Milner D, De Swart RLD, Duprex WP. Pathological consequences of systemic measles virus infection. J. Pathol. 2015;235:253–265. doi: 10.1002/path.4457. - DOI - PubMed
    1. Ito Y, et al. Detection of influenza virus RNA by reverse transcription-PCR and proinflammatory cytokines in influenza-virus-associated encephalopathy. J. Med. Virol. 1999;58:420–425. doi: 10.1002/(SICI)1096-9071(199908)58:4<420::AID-JMV16>3.0.CO;2-T. - DOI - PubMed

MeSH terms

Substances