. 2024 Feb 5;15(1):1063.
doi: 10.1038/s41467-024-45213-2.

Single-cell insights into immune dysregulation in rheumatoid arthritis flare versus drug-free remission

Affiliations

Single-cell insights into immune dysregulation in rheumatoid arthritis flare versus drug-free remission

Kenneth F Baker et al. Nat Commun. .

Abstract

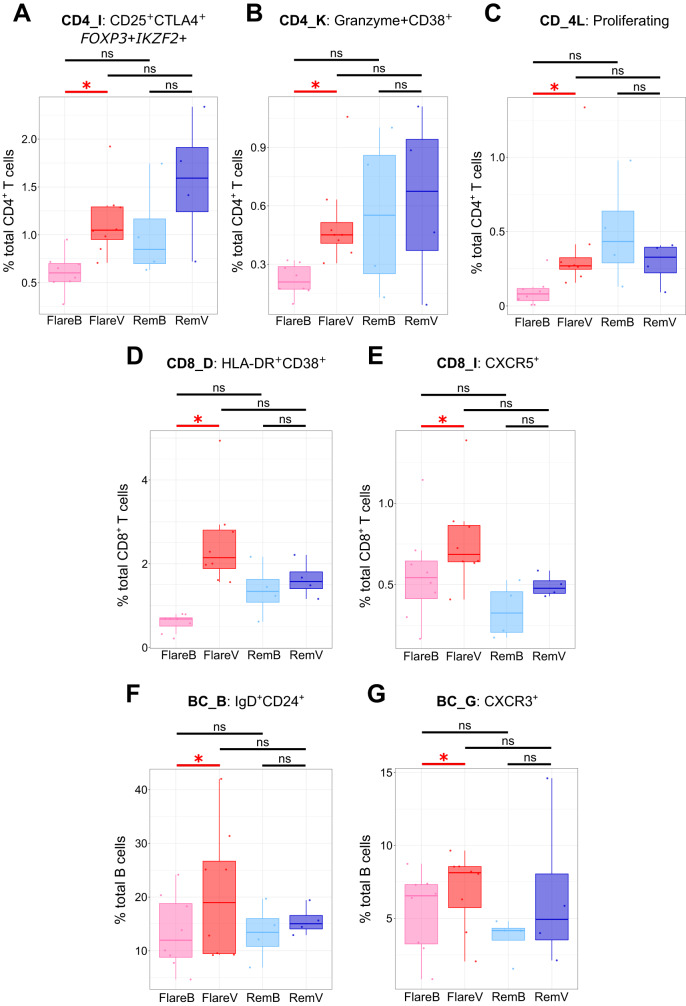
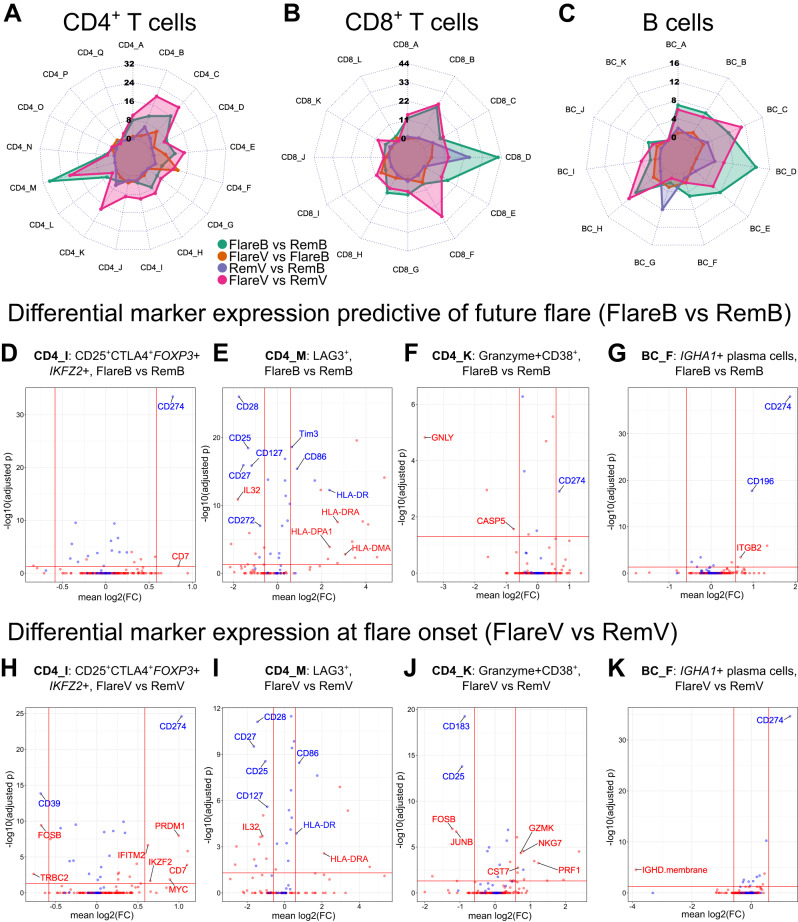
Immune-mediated inflammatory diseases (IMIDs) are typically characterised by relapsing and remitting flares of inflammation. However, the unpredictability of disease flares impedes their study. Addressing this critical knowledge gap, we use the experimental medicine approach of immunomodulatory drug withdrawal in rheumatoid arthritis (RA) remission to synchronise flare processes allowing detailed characterisation. Exploratory mass cytometry analyses reveal three circulating cellular subsets heralding the onset of arthritis flare - CD45RO+PD1hi CD4+ and CD8+ T cells, and CD27+CD86+CD21- B cells - further characterised by single-cell sequencing. Distinct lymphocyte subsets including cytotoxic and exhausted CD4+ memory T cells, memory CD8+CXCR5+ T cells, and IGHA1+ plasma cells are primed for activation in flare patients. Regulatory memory CD4+ T cells (Treg cells) increase at flare onset, but with dysfunctional regulatory marker expression compared to drug-free remission. Significant clonal expansion is observed in T cells, but not B cells, after drug cessation; this is widespread throughout memory CD8+ T cell subsets but limited to the granzyme-expressing cytotoxic subset within CD4+ memory T cells. Based on our observations, we suggest a model of immune dysregulation for understanding RA flare, with potential for further translational research towards novel avenues for its treatment and prevention.


Conflict of interest statement

K.F.B., A.G.P. and J.D.I. are named as inventors on a patent application by Newcastle University (“Prediction of Drug-Free Remission in Rheumatoid Arthritis”; International Patent Application Number PCT/GB2019/050902). D.Mc.D., G.H., R.H., J.C., D.S., A.R.S., H.E.M., L.Mac.D., A.F. and A.E.A. have no competing interests to declare.

Figures

Fig. 1
Fig. 1. Mass cytometry reveals an increase in specific memory T and B cell subsets at flare onset.
A tSNE plot of mass cytometry data showing 31 distinct circulating cellular clusters. Circulating abundance across study visits for CD19+CD27+CD86+CD21 B cells (B: cluster BC_1), CD3+CD4+CD45RO+ICOS+PD1+CD38hi T cells (C: cluster CD4_1), CD4+CD45RO+ICOSPD1CD38hi T cells (D: cluster CD4_2), CD45RO+ICOS+FoxP3+ T cells (E: cluster CD4_3), CD8+CD45RO+PD1+CD38hi T cells (F: cluster CD8_2), CD8+CD45RO+PD1hi T cells (G: cluster CD8_4), CD11c+CD1c+CXCR5+ dendritic cells (H: cluster DC_2), and CD3+CD4CD8 presumed ɣδ T cells (I: cluster GDT_3). Two-sided statistical significance by generalised linear mixed model with Benjamini–Hochberg multiple test correction across all clusters within each pairwise visit comparison. ***p < 0.001, **p < 0.01, *p < 0.05, ns not significant. Exact adjusted p values as follows: (B: cluster BC_1) FlareV vs. FlareB, p = 5.9 × 10−4; (C: cluster CD4_1) CD4_1: FlareV vs. FlareB: p = 5.9 × 10−4, FlareV vs. RemV: p = 5.7 × 10−3; (D: cluster CD4_2) RemV vs. RemB: p = 0.042; (E: cluster CD4_3) FlareV vs. FlareB: p = 1.7 × 10−5, RemV vs. RemB: p = 0.042; (F: cluster CD8_2) FlareV vs. FlareB: p = 6.3 × 10−9, RemV vs. RemB: p = 7.0 × 10−4, FlareV vs. RemV: p = 9.4 × 10−4; (G: cluster CD8_4) FlareV vs. FlareB: p = 4.4 × 10−11, RemV vs. RemB: p = 5.8 × 10−4), FlareV vs. RemV: p = 4.6 × 10−3; (H: cluster DC_2) FlareV vs. FlareB: p = 2.9 × 10−3; (I: cluster GDT_3) FlareV vs. FlareB: p = 1.2 × 10−4. FlareB flare patient, baseline visit; FlareV flare patient, flare visit; RemB remission patient, baseline visit; RemV remission patient, month 6 visit. Box plots represent data from n = 36 patients (20 flare, 16 remission) where the lower bound of lower whisker shows the minimum, lower bound of box shows the lower quartile, centre of box shows the median, upper bound of box shows the upper quartile, and upper bound of upper whisker shows the maximum. Source data are provided as a Source Data file.
Fig. 2
Fig. 2. Single-cell sequencing of circulating flare-associated memory T and B cells reveals distinct cellular clusters.
UMAP showing unsupervised clustering of CD4+CD45RO+PD1hi T cells (A), CD8+CD45RO+PD1hi T cells (B), and CD19+ B cells (C). Dot plots showing average surface proteins (blue) and gene (red) expression across CD4+ T cell (D), CD8+ T cell (E), and B cell (F) clusters. Source data are provided as a Source Data file.
Fig. 3
Fig. 3. Significant differences in proportional abundance of scRNAseq clusters at onset of flare.
Circulating proportional abundance across study visits for CD4+CD25+CTLA4+FOXP3+IKZF2+ T cells (A: cluster CD4_I), CD4+Granzyme + CD38+ T cells (B: cluster CD4_K), proliferating CD4+ T cells (C: cluster CD4_L), CD8+HLA-DR+CD38+ T cells (D: cluster CD8_D), CD8+CXCR5+ T cells (E: cluster CD8_I), IgD+CD24+ B cells (F: cluster BC_B) and CXCR3+ B cells (G: cluster BC_G). Two-sided statistical significance by Wilcoxon rank sum test with Benjamini–Hochberg multiple test correction across all clusters within each cell type and pairwise visit comparison. *p < 0.05, ns not significant. Exact adjusted p values for FlareV vs. FlareB contrast as follows: (A: cluster CD4_I) p = 0.044; (B: cluster CD4_K) p = 0.044; (C: cluster CD4_L) p = 0.044; (D: cluster CD8_D) p = 0.047; (E: cluster CD8_I) p = 0.047; (F: cluster BC_B) p = 0.043; (G: cluster BC_G) p = 0.043. FlareB flare patient, baseline visit; FlareV flare patient, flare visit; RemB remission patient, baseline visit; RemV remission patient, month 6 visit. Box plots represent data from n = 12 patients (8 flare, 4 remission) where the lower bound of lower whisker shows the minimum, lower bound of box shows the lower quartile, centre of box shows the median, upper bound of box shows the upper quartile, and upper bound of upper whisker shows the maximum. Source data are provided as a Source Data file.
Fig. 4
Fig. 4. Differential gene and surface protein expression within indicated clusters between flare and DFR.
Radar plots showing total number of differentially-expressed markers (two-sided p < 0.05 by Wilcoxon rank sum test with Bonferroni correction within each cluster, fold change threshold > ±1.5) within CD4+CD45RO+PD1hi T cell (A), CD8+CD45RO+PD1hi T cell (B), and B cell (C) clusters. DK Differential gene and surface protein expression within indicated cell clusters and patient visit group contrasts. The horizontal red line indicates adjusted two-sided p < 0.05 threshold (Wilcoxon rank sum test with Bonferroni correction); the vertical lines indicate ±1.5 fold change thresholds. Positive fold change values indicate an increased expression for the first group relative to second group within each contrast. Transcripts are shown in red and surface proteins in blue. Markers of interest as discussed in the results section are highlighted for reference. FlareB flare patient, baseline visit; FlareV flare patient, flare visit; RemB remission patient, baseline visit; RemV remission patient, month 6 visit. Source data are provided as a Source Data file.
Fig. 5
Fig. 5. V(D)J sequencing reveals significant T cell clonal expansion following DMARD cessation.
UMAPs showing the distribution of clonal cells (highlighted in red) within CD4+ T cells (A), CD8+ T cells (B), and B cells (C) including cells from all patients at all time points. Clonal cells were defined as at least two cells that shared the same paired CDR3 nucleotide sequence within the same patient. Cluster distribution of CD8+CD45RO+PD1hi T cell (D) and CD4+CD45RO+PD1hi T cell (E) clones that showed significant (two-sided p < 0.05, Fisher exact test with Benjamini–Hochberg correction) change in proportional abundance between visits. Each panel represents an individual patient. FlareB flare patient, baseline visit; FlareV flare patient, flare visit; RemB remission patient, baseline visit; RemV remission patient, month 6 visit. Source data are provided as a Source Data file.
Fig. 6
Fig. 6. Model describing the changes in circulating lymphocyte subsets that predispose towards and potentially trigger RA flare.
A In drug-induced remission, effector lymphocyte subsets are primed for activation and proliferation, but are balanced by the immunomodulatory effect of DMARDs, and attenuated CD4+ Treg cell suppression. B Upon DMARD cessation, pro-inflammatory effector lymphocyte subsets are activated, overwhelming a dysfunctional CD4+ Treg cell response. Mem memory.

References

    1. Smolen JS, et al. EULAR recommendations for the management of rheumatoid arthritis with synthetic and biological disease-modifying antirheumatic drugs: 2022 update. Ann. Rheum. Dis. 2023;82:3–18. doi: 10.1136/ard-2022-223356. - DOI - PubMed
    1. Fraenkel L, et al. 2021 American College of Rheumatology guideline for the treatment of rheumatoid arthritis. Arthritis Rheumatol. 2021;73:1108–1123. doi: 10.1002/art.41752. - DOI - PubMed
    1. Tascilar K, et al. Treatment tapering and stopping in patients with rheumatoid arthritis in stable remission (RETRO): a multicentre, randomised, controlled, open-label, phase 3 trial. Lancet Rheum. 2021;3:e767–e777. doi: 10.1016/S2665-9913(21)00220-4. - DOI - PubMed
    1. Klarenbeek NB, et al. Discontinuing treatment in patients with rheumatoid arthritis in sustained clinical remission: exploratory analyses from the BeSt study. Ann. Rheum. Dis. 2011;70:315–319. doi: 10.1136/ard.2010.136556. - DOI - PubMed
    1. Baker KF, et al. Predicting drug-free remission in rheumatoid arthritis: a prospective interventional cohort study. J. Autoimmun. 2019;105:102298. doi: 10.1016/j.jaut.2019.06.009. - DOI - PMC - PubMed