. 2024 Feb 5;15(1):1073.
doi: 10.1038/s41467-024-44866-3.

Short-term hypercaloric carbohydrate loading increases surgical stress resilience by inducing FGF21

Affiliations

Short-term hypercaloric carbohydrate loading increases surgical stress resilience by inducing FGF21

Thomas Agius et al. Nat Commun. .

Abstract

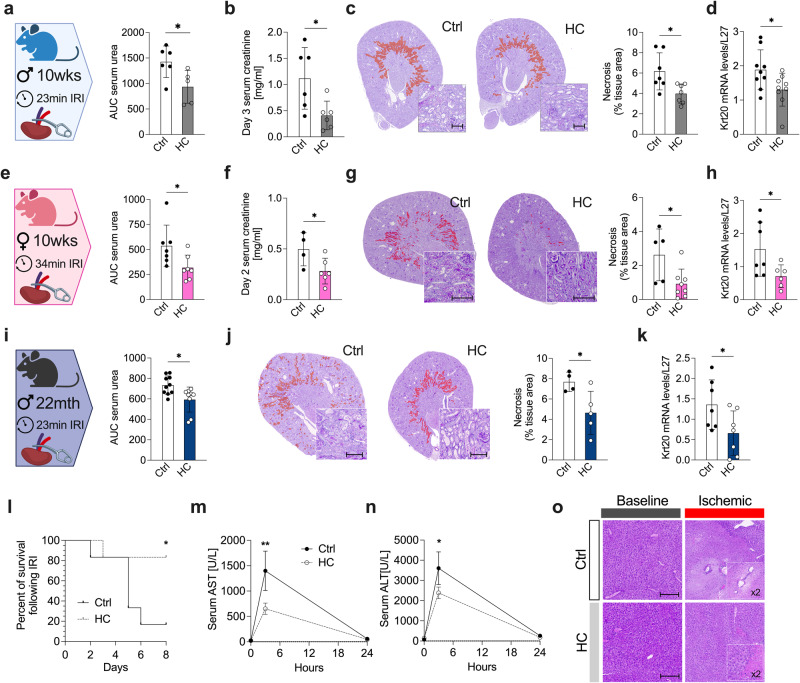
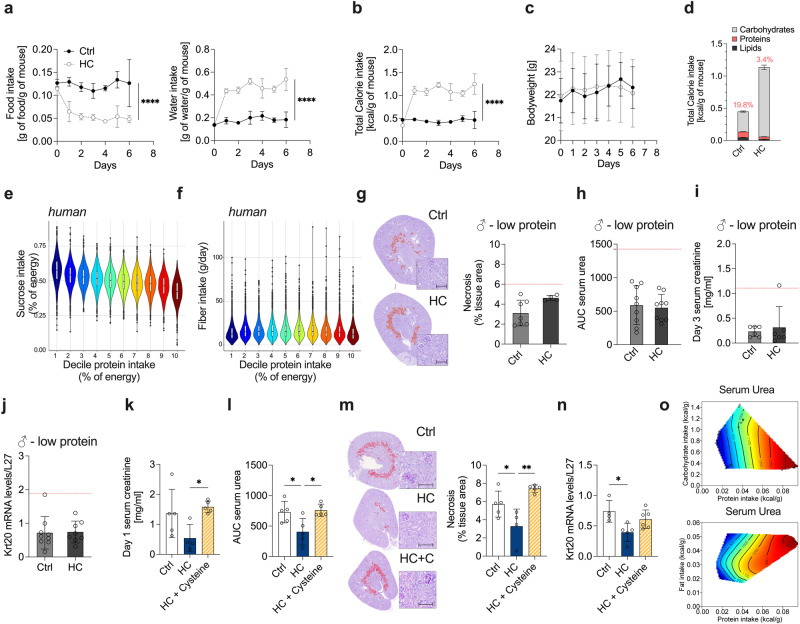
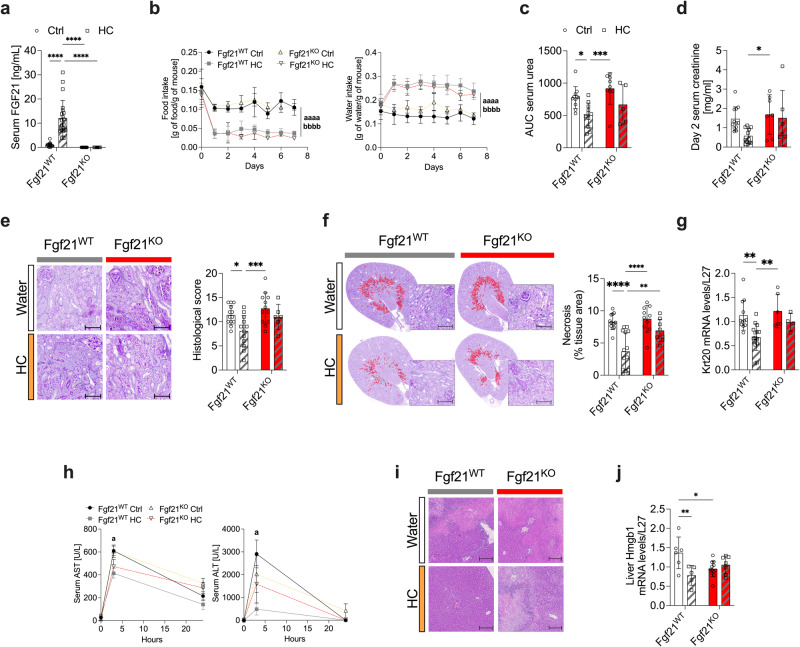
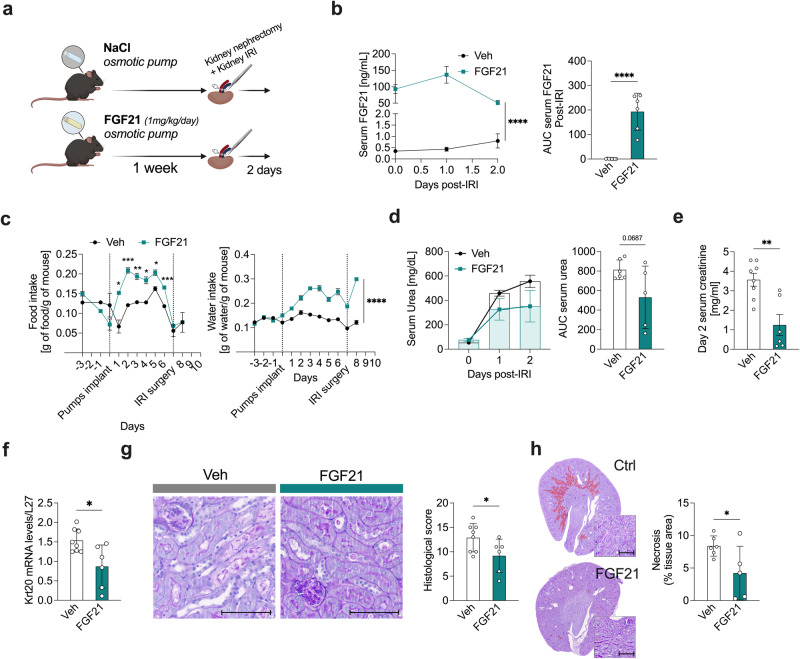
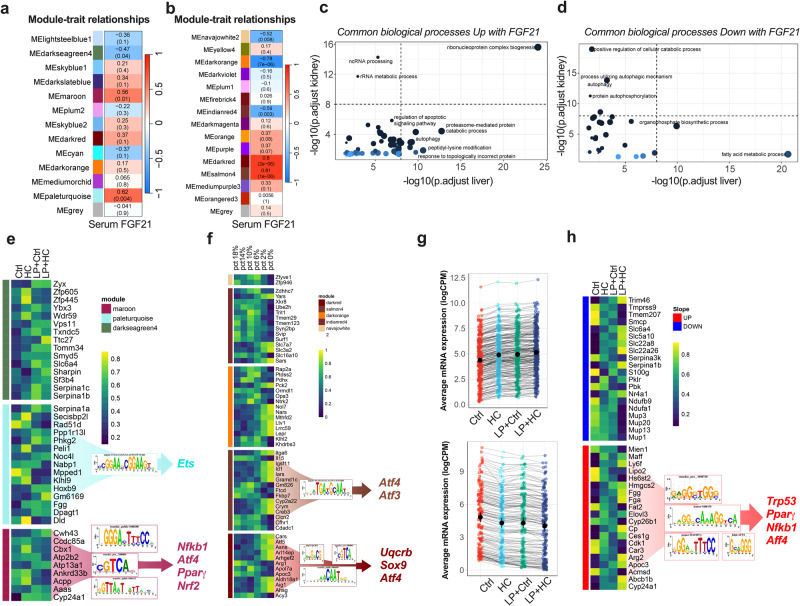
Dietary restriction promotes resistance to surgical stress in multiple organisms. Counterintuitively, current medical protocols recommend short-term carbohydrate-rich drinks (carbohydrate loading) prior to surgery, part of a multimodal perioperative care pathway designed to enhance surgical recovery. Despite widespread clinical use, preclinical and mechanistic studies on carbohydrate loading in surgical contexts are lacking. Here we demonstrate in ad libitum-fed mice that liquid carbohydrate loading for one week drives reductions in solid food intake, while nearly doubling total caloric intake. Similarly, in humans, simple carbohydrate intake is inversely correlated with dietary protein intake. Carbohydrate loading-induced protein dilution increases expression of hepatic fibroblast growth factor 21 (FGF21) independent of caloric intake, resulting in protection in two models of surgical stress: renal and hepatic ischemia-reperfusion injury. The protection is consistent across male, female, and aged mice. In vivo, amino acid add-back or genetic FGF21 deletion blocks carbohydrate loading-mediated protection from ischemia-reperfusion injury. Finally, carbohydrate loading induction of FGF21 is associated with the induction of the canonical integrated stress response (ATF3/4, NF-kB), and oxidative metabolism (PPARγ). Together, these data support carbohydrate loading drinks prior to surgery and reveal an essential role of protein dilution via FGF21.


Conflict of interest statement

The authors declare no competing interests.

Figures

Fig. 1
Fig. 1. Improved resistance to ischemia-reperfusion injury (IRI) following carbohydrate loading with 50% sucrose water.
a Experimental group (left) and serum urea levels (right; AUC) post-renal IRI after one week of preconditioning with Ctrl or HC. Created with BioRender.com. b Serum creatinine levels at day 3 post-renal IRI. c. Representative cross sections of PAS-stained kidneys with necrotic area digitally highlighted in red (left; x10 magnification; scale bar 100 µm) and necrotic tissue area quantification (right) at day 2 post-renal IRI. d Relative Krt20 mRNA levels in kidney at day 2 post-renal IRI. e Experimental group (left) and serum urea levels (AUC) post-renal IRI after one week of preconditioning with Ctrl or HC. Created with BioRender.com. f Serum creatinine levels at day 2 post-renal IRI. g Representative cross sections of PAS-stained kidneys with necrotic area digitally highlighted in red (left; x10 magnification; scale bar 100 µm) and quantification of necrotic tissue area (right) at day 2 post-renal IRI. h Relative Krt20 mRNA levels in kidney at day 2 post-renal IRI. i Experimental group (left) and serum urea levels (AUC) post-renal IRI after one week of preconditioning with Ctrl or HC. Created with BioRender.com. j Representative cross sections of PAS-stained kidneys with necrotic area digitally highlighted in red (left; x10 magnification; scale bar 100 µm) and quantification of necrotic tissue area (right) at day 2 post-renal IRI. k Relative Krt20 mRNA levels in kidney at day 2 post-renal IRI. l Kaplan-Meier survival curve post-renal IRI after one week of preconditioning with Ctrl or HC. m Serum aspartate aminotransferase (AST) and (n) alanine aminotransferase (ALT) enzyme levels at the indicated time post-hepatic IRI. o Representative cross sections of H&E-stained livers (x20 magnification; scale bar 30 µm) at baseline or at day 1 pos-thepatic IRI. *p values for a-k were calculated with unpaired two-tailed T-test, and for l with two-way repeated measures (RM) ANOVA with Geisser-Greenhouse correction and n, m with two-way ANOVA followed by a Sidak’s post hoc analysis, *p < 0.05 **p < 0.01. p values for a = 0.303, for b = 0.0234, for c = 0.0154, for d = 0.0345, for e = 0.0352, for f = 0.0467, for g = 0.0246, for h = 0.0445, for i = 0.0107, for j =, for k = 0.0427, for l = 0.0462, for m = 0.0346, for n = 0.0252. Images 1a, 1e and 1i were partly created with BioRender.com. ♂ indicates males, ♀ indicates females;. In a-d and l-o, experiments were carried out in 10-weeks old male mice; in e-h, in 10-week-old female mice; in i-k, in 22-month-old male mice. Sample sizes: (a–c), n = 6-7, n = 7 for Ctrl diet, and n = 6 for HC diet; (d) n = 9 in all experimental groups; (e–h), n = 7 in all experimental groups; (i), n = 10 in all experimental groups (2 experiments pooled, experiment 1: n = 7 in all experimental groups, experiment 2: n = 3 in all experimental groups; (j-k) n = 7 in all experimental groups; (l–o), n = 6 for all conditions. Data shown as mean ± SD. See also Supplementary Data Fig. 1.
Fig. 2
Fig. 2. Carbohydrate loading-induced protein dilution is required for protection against IRI.
a Food (left) and water (right) intake (normalized by body weight) of 10-weeks-old male mice given ad libitum access to water (Ctrl) or 50% sucrose-water (HC). b Total calorie intake normalized to body weight by day. c Body weight at the indicated time in mice given ad libitum access to Ctrl or HC. d Total calorie intake by macronutrient normalized to body weight by day. The % of protein intake is indicated on top of each bar. e Relationship between sucrose intake and protein intake, and (f) fiber intake and protein intake in humans from the US National Health and Nutrition Examination Survey (NHANES). Box plots represent median with 25th and 75th percentile. Whiskers plots represent hinge ± 1.5 IQR. g Representative cross sections of PAS-stained kidneys with necrotic area digitally highlighted in red (left; x10 magnification; scale bar 100 µm) and quantification of necrotic tissue area (right) at day 2 post-renal IRI after one week of preconditioning with low protein diet (LP) combined with Ctrl or HC. The red line indicates the level of the control group (Ctrl). h Serum urea levels (AUC) post-renal IRI after one week of preconditioning with the indicated diet. The red line indicates the level of the control group (Ctrl). i Serum creatinine levels at day 3 post-renal IRI. The red line indicates the level of the control group (Ctrl). j Relative Krt20 mRNA levels in kidneys at day 2 post-renal IRI after one week of preconditioning with the indicated diet. The red line indicates the level of the control group (Ctrl). k Serum creatinine levels at day 1 post-renal IRI after one week of preconditioning with Ctrl, HC or HC with cysteine oral gavage (HC + cysteine). l. Serum urea levels (AUC) post-renal IRI after one week of preconditioning with the indicated diet. m. Representative cross sections of PAS-stained kidneys with necrotic area digitally highlighted in red (left; x10 magnification; scale bar 100 µm) and quantification of necrotic tissue area (right) at day 2 postrenal IRI after one week of preconditioning with the indicated diet. n Relative Krt20 mRNA levels in kidney at day 2 post-renal IRI after one week of preconditioning with the indicated diet. o Relationship between serum urea at day 2 post-renal IRI and dietary protein intake or carbohydrate or fat intake. In all surfaces, red indicates the highest value while blue indicates the lowest value, with the colors standardized across each slice. *p values for ac were calculated with two-way repeated measures (RM) ANOVA with Geisser-Greenhouse correction, kn with unpaired two-tailed T-test and o. with a generalized additive model (GAM; k = 6), *p < 0.05 **p < 0.01 ****p < 0.0001. p values for a are respectively <0.0001 and <0.0001, for b < 0.0001, for k = 0.0411, for l = 0.0283 and 0.0171, for m = 0.0474 and 0.0019, for n = 0.0174. In ad and go, experiments were carried out in 10-weeks old male mice. Sample sizes: (a–d), n = 8; (e-f), n = 11064 men, 12181 women (g-j), n = 8-9, n = 8 for low protein Ctrl, and n = 9 for HC; (k–n), n = 5 for all conditions; (o), n = 16 for all conditions. Data in all panels are shown as mean ± SD. See also Supplementary Data Figs. 2 and 3.
Fig. 3
Fig. 3. Carbohydrate loading induces FGF21 expression.
a Serum FGF21 levels after one week of preconditioning with control or low protein diet (LP) with control (Ctrl) or 50% sucrose-water (HC). b Relative liver Fgf21 mRNA levels after one week of preconditioning with the indicated diet. c Relative kidney Fgf21 mRNA levels after one week of preconditioning with the indicated diet. d Linear regression showing the relationship between serum FGF21 levels versus protein intake and (e) serum urea (AUC). R2 coefficient was calculated using Pearson’s method. f Serum FGF21 levels after one week of preconditioning with Ctrl, HC or HC with cysteine oral gavage (HC + Cysteine). g Volcano plot of liver differential expressed genes (DEG) with FDR < 0.05 and log2FC > 2 from FGF21 overexpressing male mice from GSE39313. h Fold change of top DEGs from GSE39313 in liver after one week of preconditioning with HC compared to Ctrl. *p values of a,b were calculated with two-way ANOVA followed by a Tukey’s post hoc analysis, d,e are linear regressions and r squared Pearson’s coefficient, f with one-way ANOVA and h with unpaired two-tailed T-test with Bonferroni correction, *p < 0.05 **p < 0.01 ***p < 0.001 ****p < 0.0001. p-values for a = 0.0001, for b = 0.0001, for d < 0.0001, for f < 0.0001, for h = 0.0003. In all panels, experiments were carried out in 10-weeks old male mice. Sample sizes: (a–c), n = 8; (d-e), n = 32; (f), n = 5 for all conditions; (h), n = 8 for all conditions. Data in all panels are shown as mean ± SD. See also Supplementary Data Figs. 4 and 5.
Fig. 4
Fig. 4. FGF21 is required for the protective effects of carbohydrate loading.
a Serum FGF21 levels after one week of preconditioning with standard (Ctrl) or 50% sucrose-water (HC). b Food (left) and water (right) intake (normalized by body weight) after one week of preconditioning with the indicated diet. c Serum urea (AUC) and (d) serum creatinine levels at day 2 post-renal IRI after one week of preconditioning with the indicated diet. e Representative cross sections of PAS-stained kidneys (left; x10 magnification; scale bar 100 µm) and histological score (right) at day 2 post-renal IRI after one week of preconditioning with the indicated diet. f Representative cross sections of PAS-stained kidneys with necrotic area digitally highlighted in red (left; x10 magnification; scale bar 100 µm) and quantification of necrotic tissue area (right) at day 2 post-renal IRI after one week of preconditioning with the indicated diet. g Relative Krt20 mRNA levels in the kidney at day 2 post-renal IRI after one week of preconditioning with the indicated diet. h Serum aspartate aminotransferase (AST) and alanine aminotransferase (ALT) enzyme levels at the indicated time post-hepatic IRI. i Representative cross sections of H&E-stained livers (x20 magnification; scale bar 30 µm) at day 1 post-hepatic IRI. Ischemic areas appearing in light pink. j Relative Hmgb1 mRNA levels in the liver at day 2 post-renal IRI after one week of preconditioning with the indicated diet. *p values for a,c-g,j were calculated with two-way ANOVA followed by a Tukey’s post hoc analysis, b with two-way RM ANOVA with Geisser-Greenhouse correction and h with two-way ANOVA followed by a Sidak’s post hoc analysis, *p < 0.05 **p < 0.01 ***p < 0.001 ****p < 0.0001 a p < 0.05 aaaa p < 0.0001 Fgf21WT HC vs. Fgf21WT Ctrl, bbbb p < 0.0001 Fgf21KO HC vs. Fgf21WT Ctrl. p values for a < 0.0001, <0.0001 and <0.0001, for b < 0.0001 and <0.0001, for c = 0.0269 and 0.0008, for d = 0.0453, for e = 0.0236 and 0.001, for f < 0.0001, <0.0001 and = 0.0074, for g = 0.0002 and 0.0031, for h = 0.0328 and 0.0351, for j = 0.007 and 0.022. In a-j, experiments were carried out in Fgf21WT and Fgf21KO10-weeks old male mice. Sample sizes: (a–g), n = 10–15, n = 15 for Fgf21WT Ctrl, n = 15 for Fgf21WT HC, n = 15 Fgf21KO Ctrl, n = 10 for Fgf21KO HC; (h–j), n = 6–13, n = 6 Fgf21WT Ctrl and HC, n = 10 for Fgf21KO Ctrl, n = 13 for Fgf21KO HC. Data in all panels are shown as mean ± SD. See also Supplementary Data Fig. 6.
Fig. 5
Fig. 5. FGF21 protects against kidney ischemia-reperfusion injury.
a Experimental setup. Ad-libitum fed 10-weeks-old male mice were given free access to a standard diet (Ctrl) and implanted with osmotic pumps containing either NaCl (Veh) or human recombinant FGF21 (FGF21; 1 mg/kg/day) for 7 days prior to renal IRI surgery. Created with BioRender.com. b Serum FGF21 levels (left) and AUC (right) post-renal IRI after one week of preconditioning with the indicated treatment. c Food (left) and water (right) intake (normalized by body weight) after one week of preconditioning with the indicated treatment. d Serum urea levels (left) and AUC (right) at the indicated time post-renal IRI. e Serum creatinine levels at day 2 post-renal IRI after one week of preconditioning with the indicated treatment. f Relative Krt20 mRNA levels at day 2 post-renal IRI after one week of preconditioning with the indicated treatment. g Representative cross sections of PAS-stained kidneys (left; x10 magnification; scale bar 100 µm) at day 2 post-renal IRI and histological score (right) after one week of preconditioning with the indicated treatment. h Representative cross sections of PAS-stained kidneys with necrotic area digitally highlighted in red and quantification (left; x10 magnification; scale bar 100 µm) and necrotic tissue area (right) at day 2 post-renal IRI after one week of preconditioning with the indicated treatment. *p values for b,c were calculated with two-way RM ANOVA with Geisser-Greenhouse correction, c with two-way ANOVA followed by a Sidak’s post hoc analysis, and b,d,e,f,g,h with unpaired two-tailed T-tests, *p < 0.05 **p < 0.01 ***p < 0.001 ****p < 0.0001. p values for b < 0.0001 and <0.0001, for c = 0.0120, 0.0002, 0.0028, 0.0121, 0.0129 and 0.0001, for d = 0.0667, for e = 0.0022, for f = 0.0129, for g = 0.0488, for h = 0.0471. Image1A was partially created with BioRender.com. In b-h, experiments were carried out in 10-week-old male mice. Sample sizes: (a–h), n = 6-8, n = 8 Ctrl and n = 6 FGF21 treated group. Data in all panels are shown as mean ± SD. See also Supplementary Data Fig. 6.
Fig. 6
Fig. 6. Identification of FGF21-associated gene modules in kidney and liver induced by protein dilution.
a Module-Trait relationships with serum FGF21 levels identified through Weighted Gene Co-expression Network Analysis (WGCNA) from kidneys of male mice given access to ad libitum Ctrl, HC, LP and LPHC diet for one week. Top line corresponds to Pearson R2 and bottom line to adjusted p value. Color scales represent positive correlation (red) and negative correlation (blue). b Module-Trait relationships with serum FGF21 levels identified through WGCNA from livers of mice after one week on diets with 18%, 14%, 10%, 6%, 2% and 0% protein content. Top line corresponds to Pearson R2 and bottom line to adjusted p value. c Common biological processes (GO terms) enriched in kidney and liver modules with significant positive and (d) negative Module-Trait relationships with serum FGF21 identified through WGCNA. The dot size corresponds to the number of genes in the pathway. The color of the dots indicates the degree of significance of the pathway enrichment, with darker shades indicating higher significance. e Heatmap of percentile-transformed expression levels of the top 15 genes from kidney and liver (f) modules with significant Module-Trait relationships with serum FGF21. Yellow indicating high expression and blue indicating low expression. The genes from each module with positive Module-Trait relationships with serum FGF21 were used in STRING and non-singleton were used for transcription factor analysis (TFA). The motifs picture shows the top NES motifs and their associated direct transcription factors. g Average mRNA expression levels of genes from kidney with slope > 10 and R2 > 0.70 for each diet group (Ctrl, HC, LP, and LP+HC). Top panel shows genes with positive slopes, while bottom panel shows negative slopes, reflecting protein dilution intake. h Heatmap of percentile-transformed expression levels of the top 20 genes from kidney with slope > 10 and R squared > 0.70 for each diet group (Ctrl, HC, LP, and LP+HC). Yellow indicates high expression and blue indicates low expression. Upregulated genes were used in STRING and nonsingleton were used for transcription factor analysis (TFA). The motifs picture shows the top NES motifs and their associated direct transcription factors. p values for a and b were calculated with Pearson correlation, and c and d with Benjamin-Hochberg (BH) test with FDR < 0.05. Sample sizes: (g), n = 3–6, n = 3 Ctrl, n = 3 HC, n = 6 LP, n = 5 LP + HC. See also Supplementary Data Fig. 7 and 8.

Similar articles

Cited by

References

    1. Dobson GP. Trauma of major surgery: A global problem that is not going away. Int. J. Surg. 2020;81:47–54. doi: 10.1016/j.ijsu.2020.07.017. - DOI - PMC - PubMed
    1. Jaeschke H. Molecular mechanisms of hepatic ischemia-reperfusion injury and preconditioning. Am. J. Physiol. Gastrointest. Liver Physiol. 2003;284:G15–G26. doi: 10.1152/ajpgi.00342.2002. - DOI - PubMed
    1. Chouchani ET, et al. Ischaemic accumulation of succinate controls reperfusion injury through mitochondrial ROS. Nature. 2014;515:431–435. doi: 10.1038/nature13909. - DOI - PMC - PubMed
    1. Gustafsson UO, et al. Guidelines for perioperative care in elective colonic surgery: Enhanced Recovery After Surgery (ERAS((R))) Society recommendations. World J. Surg. 2013;37:259–284. doi: 10.1007/s00268-012-1772-0. - DOI - PubMed
    1. Singh SM, et al. A U.S. survey of pre-operative carbohydrate-containing beverage use in colorectal enhanced recovery after surgery (ERAS) programs. Perioper. Med. (Lond) 2021;10:19. doi: 10.1186/s13741-021-00187-3. - DOI - PMC - PubMed