. 2024 Feb 5;15(1):897.
doi: 10.1038/s41467-024-45069-6.

Logical design of synthetic cis-regulatory DNA for genetic tracing of cell identities and state changes

Affiliations

Logical design of synthetic cis-regulatory DNA for genetic tracing of cell identities and state changes

Carlos Company et al. Nat Commun. .

Abstract

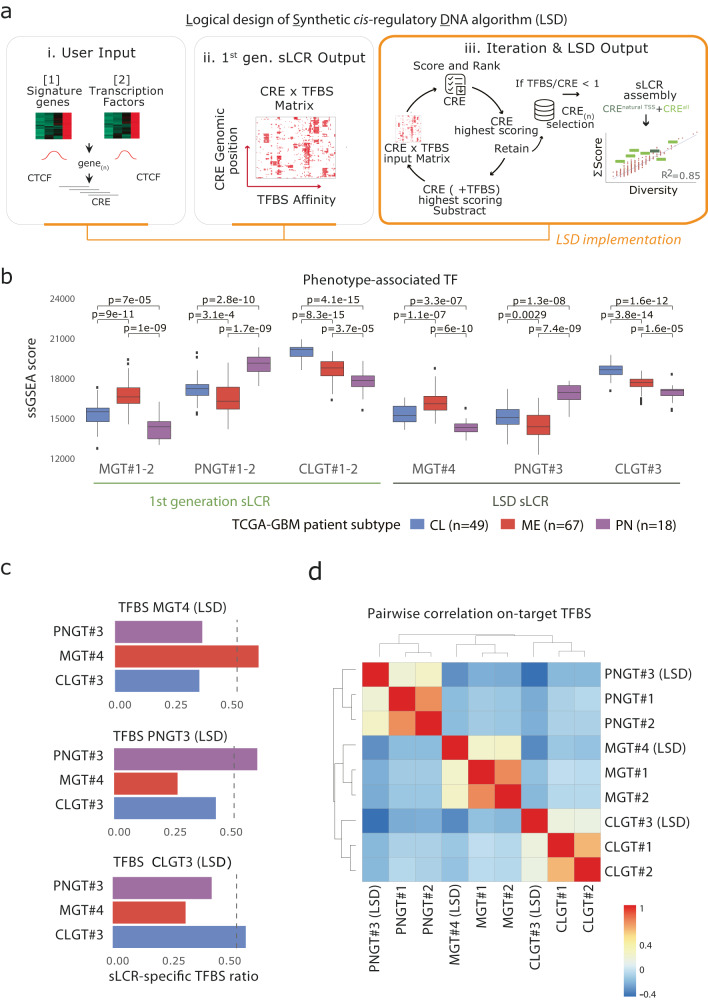
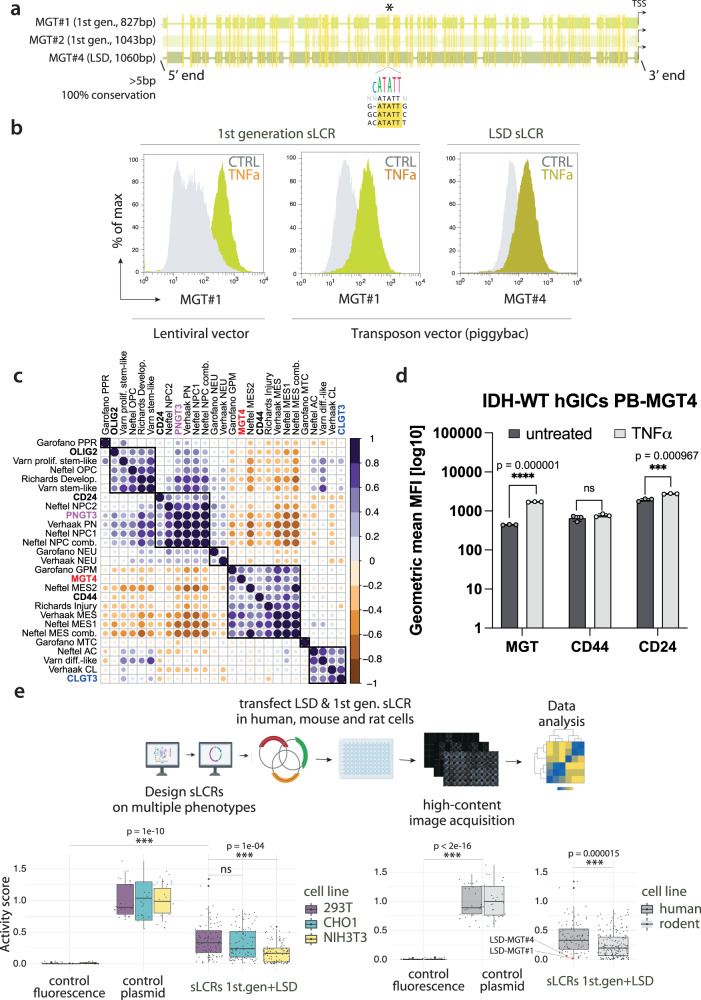
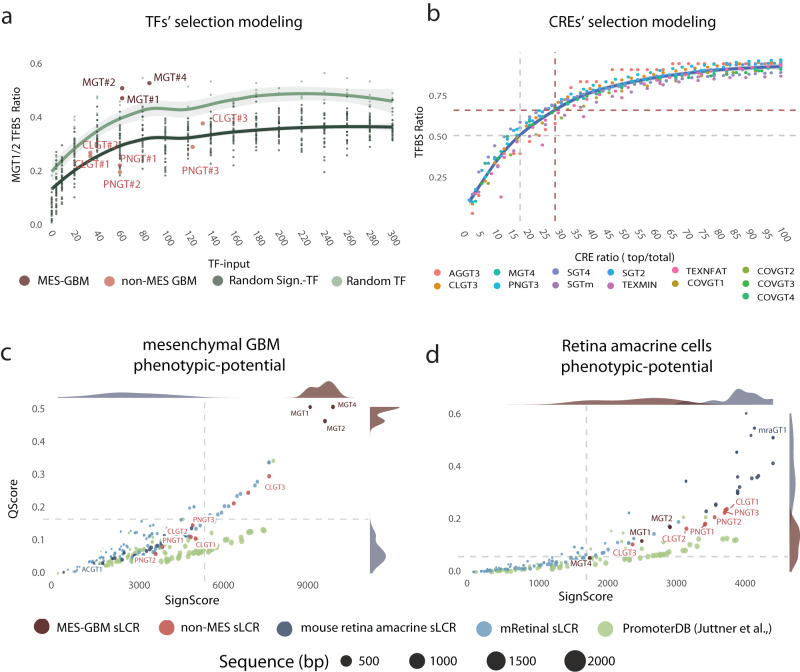
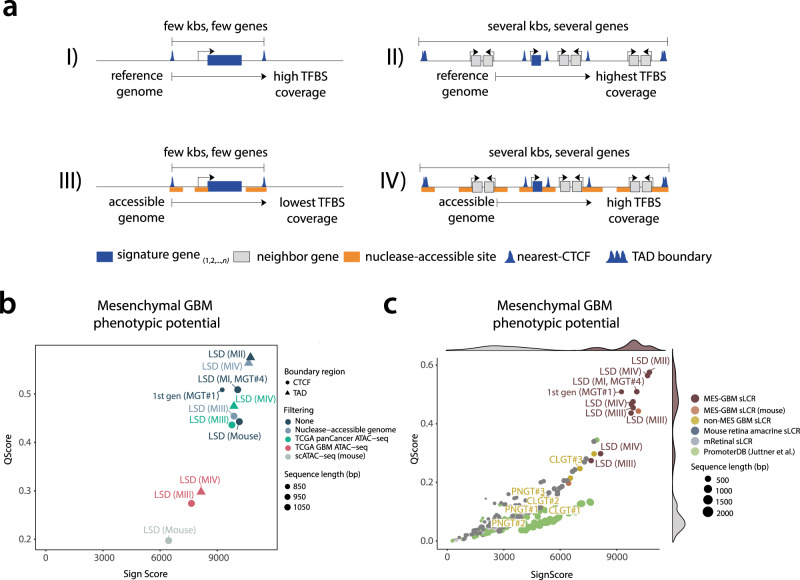
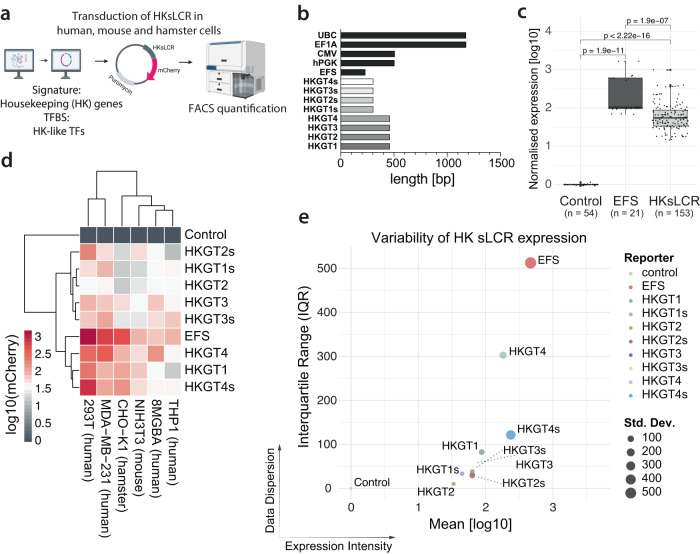
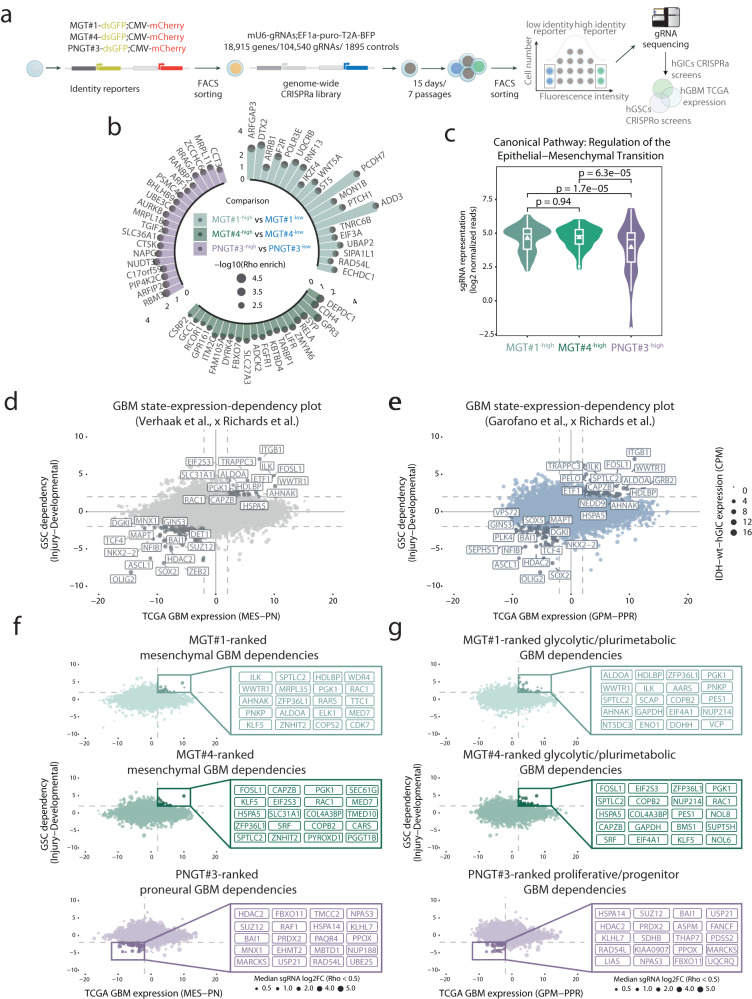
Descriptive data are rapidly expanding in biomedical research. Instead, functional validation methods with sufficient complexity remain underdeveloped. Transcriptional reporters allow experimental characterization and manipulation of developmental and disease cell states, but their design lacks flexibility. Here, we report logical design of synthetic cis-regulatory DNA (LSD), a computational framework leveraging phenotypic biomarkers and trans-regulatory networks as input to design reporters marking the activity of selected cellular states and pathways. LSD uses bulk or single-cell biomarkers and a reference genome or custom cis-regulatory DNA datasets with user-defined boundary regions. By benchmarking validated reporters, we integrate LSD with a computational ranking of phenotypic specificity of putative cis-regulatory DNA. Experimentally, LSD-designed reporters targeting a wide range of cell states are functional without minimal promoters. Applied to broadly expressed genes from human and mouse tissues, LSD generates functional housekeeper-like sLCRs compatible with size constraints of AAV vectors for gene therapy applications. A mesenchymal glioblastoma reporter designed by LSD outperforms previously validated ones and canonical cell surface markers. In genome-scale CRISPRa screens, LSD facilitates the discovery of known and novel bona fide cell-state drivers. Thus, LSD captures core principles of cis-regulation and is broadly applicable to studying complex cell states and mechanisms of transcriptional regulation.


Conflict of interest statement

G.G. reports a patent application EP18192715 by the Max-Delbrück-Center for Molecular Medicine (MDC), Robert-Rössle-Str. 10, 13092 Berlin, Germany. No disclosures are to be reported by the other authors.

Figures

Fig. 1
Fig. 1. LSD streamlines the design of sLCRs from defined inputs.
a Schematic depiction of the LSD pipeline: from input signature genes and TFBS lists (i) it generates a CRE × TFBS matrix (ii; see Methods) and performs iterative selection of the top-ranked CREs (iii). Each iteration removes the highest scoring CRE and TFBS from the CRE × TFBS matrix until the CRE × TFBS contained no TFBS or CRE. The output of LSD is a ranked list of n CREs. The CRE closest to a natural TSS is prioritized. The example to the right illustrates a linear relationship between TFBS affinity and TFBS diversity for all CREs in the CRE × TBFS matrix (red circles; R2 = 0.86). In light green boxes, LSD ranked n=7 CREs (1050bp) covering >60% of the TFBS diversity. The TSS-containing CRE is in dark green. b Boxplot showing ssGSEA scores of The Cancer Genome Atlas Glioblastoma (TCGA-GBM) patient cohort for subtype-specific TF input lists. Each annotated GBM transcriptional subtype (CL – Classical, blue, n = 49; MES – Mesenchymal, red, n = 67; PN – Proneural, purple, n = 18) features statistical comparisons by two-sided pairwise t-test. Data distribution is shown, with box indicating the interquartile range and inner line indicating the median. Whiskers extend to represent the data range, including outliers. c Barplot showing the coverage of sLCR-specific TFBS lists (color) relative to the indicated TFBS input list (above). The dashed line denotes a threshold of 50%. d Heatmap showing the Pearson correlation between the TFBS score/diversity for each sLCRs-input TF list. sLCR synthetic locus control region, LSD logical synthetic cis-regulatory DNA, TF Transcription Factor, TFBS Transcription Factor binding site, CTCF CCCTC-binding factor, CRE cis-regulatory element, TSS Transcription Start Site, ssGSEA single sample gene set enrichment analysis. Source data are provided in the Source Data file.
Fig. 2
Fig. 2. LSD allows the design of functional and specific sLCRs.
a Multiple sequence alignment (see Methods) of the 1st generation MGT1 and MGT2 and the LSD MGT4 reporters. The conserved positional overlap is denoted by the asterisk and graphically represented by the sequence logo. b FACS analysis of MGT1 (left & center) and MGT4 (right) sLCRs expression in human glioblastoma-initiating cells with (lime) or without (gray) TNFa stimulation. Note the similar induction between lentiviral- and transposon-engineered cells for 1st generation MGT1 sLCR, and between MGT1 and LSD-designed MGT4. c Correlation plot between patient-derived glioblastoma cellular state signatures and module scores of sLCR signature genes for pan-GBM data from Ruiz-Moreno et al.. Purple denotes positive, whereas orange indicates negative correlation and dot size represents associated p-value. d Bar-plot quantification of FACS data showing mean MGT4 expression and CD44/CD24 staining intensity with (gray) or without (black) 48h Tumor Necrosis-factor alpha (TNFa) treatment (10ng/ml) in IDH-wildtype human glioma-initiating cell (hGICs). Data are presented as mean +/− standard deviation. Statistical significance values were calculated by two-sided unpaired t-test. Error bars denote standard deviation (n = 3 biologically independent samples). e Above, schematic depiction of the systematic screening of sLCRs designed on diverse phenotypic signatures in three different species (partially assembled using BioRender.com). Lower left, box plot of indicated sLCRs (n = 28) transfected in human epithelioid 293T (purple), hamster epithelioid CHO-K1 (teal) and mouse fibroblastoid NIH3T3 (yellow) cell lines. The X-axis shows fluorescence normalized by controls and transfection efficiency per cell line. Each sLCR measurement was assessed in technical replica (n = 3). Left, positive (n = 5) and negative controls (n = 3) denote CFP, GFP, mCherry and iRFP670 expression driven by non-sLCR promoters and fluorescence background in each channel, respectively. Lower right, box plot shows relative activity of human sLCR transfected in human (293T;dark gray) or non-human (CHO-K1, NIH3T3; light gray) cells. Data distribution is shown, with box indicating the interquartile range and inner line indicating the median. Whiskers extend to represent the data range, including outliers. Statistics: 2-way ANOVA, followed by Dunnet post-hoc test. Source data are provided in the Source Data file.
Fig. 3
Fig. 3. Towards defining endogenous and synthetic reporters’ phenotypic potential via TFBS enrichment ranking.
a Scatter plot showing the mesenchymal sLCRs TFBS affinity ratio for on-target, off-target and scrambled sLCRs. The Y-axis indicates the observed/expected ratio (i.e., MGT1-2 observed/input TFBS). The X-axis denotes the number of input TF. First-generation and LSD-sLCR are indicated. Scrambled sLCR were designed using LSD and input from random sampling of TFs from the general pool of annotated human TFs (random TF) or random selection of genes from the human genome (random Sign-TF). Fitted lines indicate LOESS regression with 95% confidence interval. b Scatter plot showing the TFBS affinity ratio as a function of increasing numbers of CREs. Values are calculated for each functional sLCR assessed experimentally (Fig. 2). Logarithmic regression was used to fit the curve. The gray dashed line indicates that the CRE ratio is >50% of TFBS with R2 = 0.96 and the blue solid line marks MGT4. c Scatter plot showing the signature score (x-axis) and affinity score (y-axis; see Methods) of the indicated reporters for the mesenchymal phenotype. Note the antagonistic phenotypic scoring of glioblastoma (reds) and neural retina amacrine cell reporters (blues). d Phenotypic scoring of the same reporters in c for a retina amacrine cell phenotype. sLCR synthetic locus control region, LSD logical synthetic cis-regulatory DNA, TF Transcription Factor, TFBS Transcription Factor binding site, CRE cis-regulatory element. Source data are provided in the Source Data file.
Fig. 4
Fig. 4. Integrating chromatin accessibility and 3D contact maps as input for LSD.
a Schematic representation of alternative LSD input combination models. b Scatter plot showing the signature score (x-axis) and affinity score (y-axis; see Methods) of the indicated reporters for the mesenchymal phenotype. Different filtering methods are denoted by color codes and dot-size indicates sequence length in basepairs. Note the improved on-target score for a mesenchymal sLCR designed by LSD using model II (i.e. MGT5). c Scatter and density plots of mesenchymal reporters designed in b (dark red, light red, orange) with the addition of non-specific phenotypic reporters (blue, green, gray). Note that the mesenchymal phenotypic space is occupied by most mesenchymal reporters and that the including of accessibility and 3D contact data marginally increased or decreased sLCR scoring. sLCR synthetic locus control region, LSD logical synthetic cis-regulatory DNA, TFBS Transcription Factor binding site, TAD Topologically Associating Domain. Source data are provided in the Source Data file.
Fig. 5
Fig. 5. Design and validation of housekeeping-like sLCRs for gene therapy compatible with AAV-vectors size constraints.
a Schematic generation and validation of sLCRs based on broadly expressed genes and transcription factors in humans and rodents (partially assembled using BioRender.com). b Bar plot of the sequence lengths of housekeeping-like sLCRs (HKGTs) and well-known broadly expressed promoters. Note all HKGTs (housekeeping genetic tracing sLCRs) to be shorter than well established UBC, EF1A, CMV and hPGK promoters. c Box plot of normalized mCherry fluorescence intensities for EFS or HK sLCRs transduced stably in human, mouse, and hamster cell lines. Data distribution is shown, with box indicating the interquartile range and inner line indicating the median. Whiskers extend to represent the data range, including outliers. Small dots denote individual datapoints for triplicate measurements of cell lines of human, mouse, and hamster origin (n = 6), genetically engineered with each of the nine constructs. Statistical significance values were calculated by two-sided unpaired t-test. d Heatmap of the normalized mCherry fluorescence intensities of EFS or HK sLCRs transduced stably into human, mouse, and hamster cell lines. e Scatter plot with varying dot size indicating mean log10-transformed intensities and interquartile range of HKs LCR-driven and EFS-driven mCherry. Dot size represents standard deviation, color-coded for corresponding identities. Note that EFS is the strongest promoter, and HKGT4 is the strongest promoter with lowest variability across all the lines tested. Source data are provided in the Source Data file.
Fig. 6
Fig. 6. Convergence of LSD, genome-wide CRISPR activation and patients' datasets towards the discovery of cell-state-specific drivers.
a Schematic representation of the genome-scale CRISPR activation (CRISPRa) screens (partially assembled using BioRender.com). b Circular barplot depiction of the top single-guide RNAs (sgRNA) targets with a positive enrichment (median sgRNAs log2-fold-change (log2FC) >0.5, Rho Enrichment score <0.05 and gene expression in target cells CPM >5) in the indicated high-reporter expressing cells compared to the respective controls (color legend, n = 3 technical replica). Median sgRNA log2FC and Rho enrichment scores are represented by bars and dot size, respectively. c) Violin plot of the read-count distribution of sgRNA targets defined as connected to EMT terms by Ingenuity Pathway Analysis (n = 70). Data distribution is shown, with box indicating the interquartile range and inner line indicating the median. Whiskers extend to represent the data range, including outliers. P-values denote the significance of statistical comparisons by two-sided pairwise t-test. Scatter plot depicting The Cancer Genome Atlas (TCGA) GBM subtype-specific expression according to Verhaak et al. (d) or Garofano et al. (e) classifications (X-axis) and GBM stem cells dependencies (Y-axis). Dot size represents gene expression values in naive IDH-wildtype hGICs. f, g Convergence of the indicated LSD-CRISPRa-screens data onto the GBM-state-expression dependencies plots in d and e. Dot size represents the median log2FC of the respective sgRNA targets. Note that top right/bottom left data highlight candidate GBM subtype-specific dependencies, with the top context-specific factors listed in the magnification. LSD logical synthetic cis-regulatory DNA, hGICs human glioma-initiating cells, EMT Epithelial-Mesenchymal-Transition. Source data are provided in the Source Data file.

Similar articles

Cited by

References

    1. Chen J, et al. A restricted cell population propagates glioblastoma growth after chemotherapy. Nature. 2012;488:522–5226. doi: 10.1038/nature11287. - DOI - PMC - PubMed
    1. Lu CP, et al. Identification of stem cell populations in sweat glands and ducts reveals roles in homeostasis and wound repair. Cell. 2012;150:136–150. doi: 10.1016/j.cell.2012.04.045. - DOI - PMC - PubMed
    1. Schepers, A. G. et al. Lineage tracing reveals Lgr5+ stem cell activity in mouse intestinal adenomas. Science337, 730–735 (2012). - PubMed
    1. Elde NC, Malik HS. The evolutionary conundrum of pathogen mimicry. Nat. Rev. Microbiol. 2009;7:787–797. doi: 10.1038/nrmicro2222. - DOI - PubMed
    1. Kretzschmar K, Watt FM. Lineage tracing. Cell. 2012;148:33–45. doi: 10.1016/j.cell.2012.01.002. - DOI - PubMed