. 2024 Feb 5;15(1):1086.
doi: 10.1038/s41467-024-45476-9.

Anticipating regime shifts by mixing early warning signals from different nodes

Affiliations

Anticipating regime shifts by mixing early warning signals from different nodes

Naoki Masuda et al. Nat Commun. .

Abstract

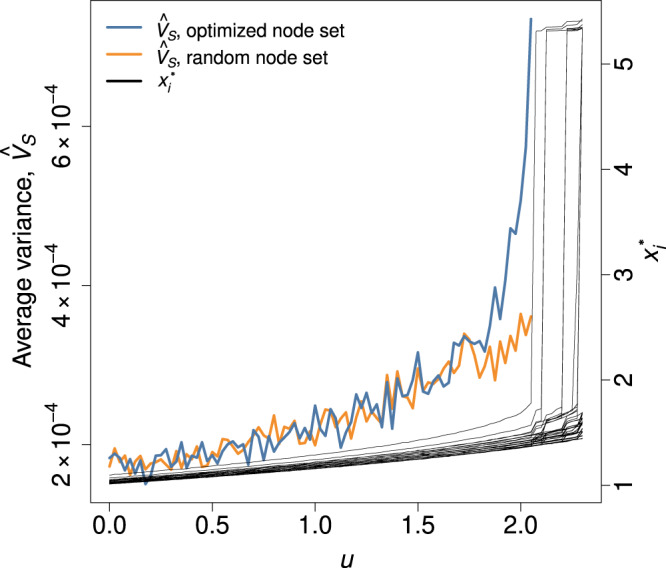
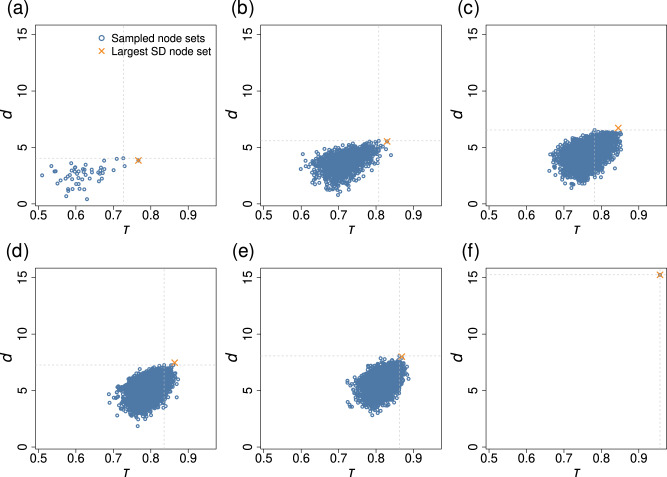
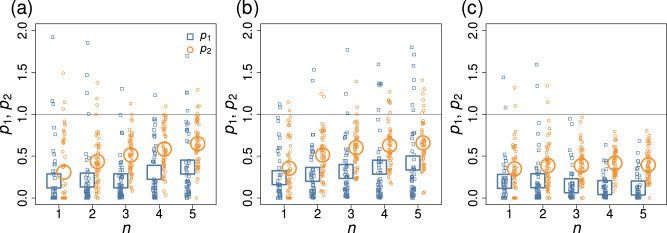
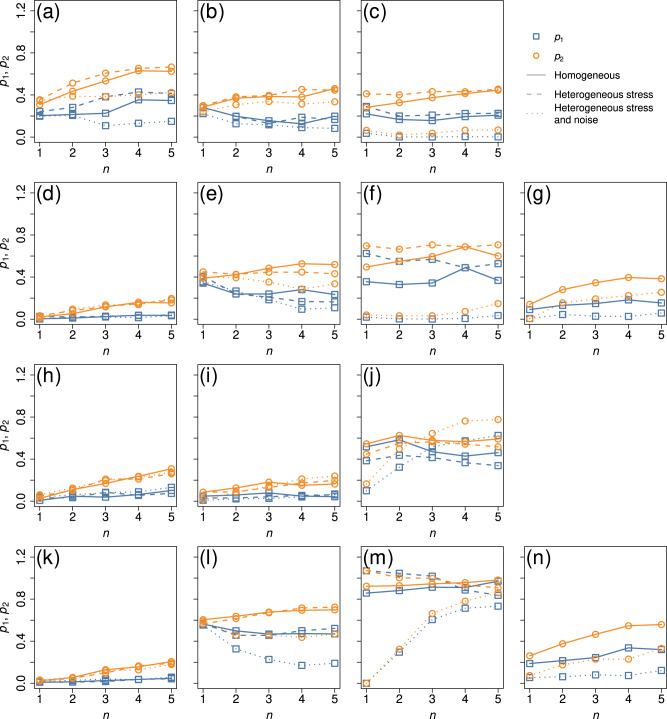
Real systems showing regime shifts, such as ecosystems, are often composed of many dynamical elements interacting on a network. Various early warning signals have been proposed for anticipating regime shifts from observed data. However, it is unclear how one should combine early warning signals from different nodes for better performance. Based on theory of stochastic differential equations, we propose a method to optimize the node set from which to construct an early warning signal. The proposed method takes into account that uncertainty as well as the magnitude of the signal affects its predictive performance, that a large magnitude or small uncertainty of the signal in one situation does not imply the signal's high performance, and that combining early warning signals from different nodes is often but not always beneficial. The method performs well particularly when different nodes are subjected to different amounts of dynamical noise and stress.


Conflict of interest statement

The authors declare no competing interests.

Figures

Fig. 1
Fig. 1. Schematic of two networks.
a A network with N = 2 nodes connected by a directed edge. b A symmetric chain network with N = 3 nodes. The coupling strength is denoted by w. The stress given to each node is either r or r − Δr.
Fig. 2
Fig. 2. An example bifurcation diagram of single-node dynamics given by Eq. (8) without dynamical noise.
The solid and dashed lines represent stable and unstable equilibria, respectively.
Fig. 3
Fig. 3. Early warning signals with different node sets in a network with N = 2 nodes connected by a directed edge.
The solid lines represent the mean. The shaded regions represent the standard deviation. We set w = 0.5, σ1 = 0.1, and L = 100. a (σ2, Δr) = (0.1, 1). b (σ2, Δr) = (0.1, 0.5). c (σ2, Δr) = (0.2, 1).
Fig. 4
Fig. 4. Early warning signals with different node sets in the undirected chain network with N = 3 nodes.
We set w = 0.05, σ2 = 0.1, and L = 100. a σ1 = 0.1. b σ1 = 0.7. c σ1 = 0.015.
Fig. 5
Fig. 5. Early warning signal, V^S, for the maximizer of d (blue line) and a set of nodes selected uniformly at random (orange line).
Both sentinel node sets are composed of n = 5 nodes. We also show xi* for each node at each value of u. We used the coupled double-well dynamics on a BA network with N = 50 nodes and gradually increased u.
Fig. 6
Fig. 6. Relationships between the Kendall’s τ and d before the first major transition in the coupled double-well dynamics on a BA network with N = 50 nodes.
We gradually increased u. We considered node sets S with n ∈ {1, 2, 3, 4, 5, N} nodes. a n = 1. b n = 2. c n = 3. d n = 4. e n = 5. f n = N. The τ and d values for the node set maximizing d for each n value are highlighted by the dashed lines. The cross represents “Large SD'', i.e., the node set comprised of the n nodes with the largest sample standard deviation of xi(t).
Fig. 7
Fig. 7. Performance of the optimized node set in anticipating the tipping point in the double-well dynamics on the BA model network with N = 50 nodes.
a Homogeneous stress and homogeneous noise. b Heterogeneous stress and homogeneous noise. c Heterogeneous stress and heterogeneous noise. The smaller symbols show the p1 and p2 values for the individual series of simulations. The larger symbols show the average over 50 series of simulations.
Fig. 8
Fig. 8. Performance of the node set maximizing d on the BA and Chesapeake Bay networks.
The squares and circles represent p1 and p2, respectively, for the given n, dynamics, network, and condition (i.e., whether ui or σi is homogeneously or heterogeneously distributed) averaged over 50 series of simulations. ag BA network. hn Chesapeake Bay carbon flow network. The panels on the leftmost column correspond to the double-well dynamics, and the second to the fourth columns to the mutualistic interaction, gene regulatory, and SIS dynamics, respectively. The combination of the dynamics model and bifurcation parameter is as follows. (a, h): double-well, u. (b, i): mutualistic interaction, u. (c, j): gene regulatory, u. (d, k): double-well, D. (e, l): mutualistic interaction, D. (f, m): gene regulatory, D. (g, n): SIS, λ.
Fig. 9
Fig. 9. Relationships between the Kendall’s τ and d in the coupled double-well dynamics on the BA network with N = 50 nodes under heterogeneous node stress and heterogeneous dynamical noise.
The network is the same as the one used in Fig. 6. We considered node sets S with n ∈ {1, 2, 3, 4, 5, N} nodes. a n = 1. b n = 2. c n = 3. d n = 4. e n = 5. f n = N. The τ and d values for the node set maximizing d are highlighted by the dashed lines. The cross represents “Large SD'', i.e., the node set comprised of the n nodes with the largest sample standard deviation of xi(t).

Similar articles

Cited by

References

    1. Scheffer M, et al. Early-warning signals for critical transitions. Nature. 2009;461:53–59. doi: 10.1038/nature08227. - DOI - PubMed
    1. Scheffer M, Carpenter SR, Dakos V, Van Nes EH. Generic indicators of ecological resilience: Inferring the chance of a critical transition. Annu. Rev. Ecol. Evol. Syst. 2015;46:145–167. doi: 10.1146/annurev-ecolsys-112414-054242. - DOI
    1. Liu Y, Kumar M, Katul GG, Porporato A. Reduced resilience as an early warning signal of forest mortality. Nat. Clim. Change. 2019;9:880–885. doi: 10.1038/s41558-019-0583-9. - DOI
    1. Wunderling N, et al. Recurrent droughts increase risk of cascading tipping events by outpacing adaptive capacities in the Amazon rainforest. Proc. Natl. Acad. Sci. USA. 2022;119:e2120777119. doi: 10.1073/pnas.2120777119. - DOI - PMC - PubMed
    1. Southall E, Brett TS, Tildesley MJ, Dyson L. Early warning signals of infectious disease transitions: A review. J. R. Soc. Interface. 2021;18:20210555. doi: 10.1098/rsif.2021.0555. - DOI - PMC - PubMed