. 2024 Feb 5;14(1):2978.
doi: 10.1038/s41598-024-52591-6.

Population genetic structure of Aedes aegypti subspecies in selected geographical locations in Sudan

Affiliations

Population genetic structure of Aedes aegypti subspecies in selected geographical locations in Sudan

Sara A Abuelmaali et al. Sci Rep. .

Abstract

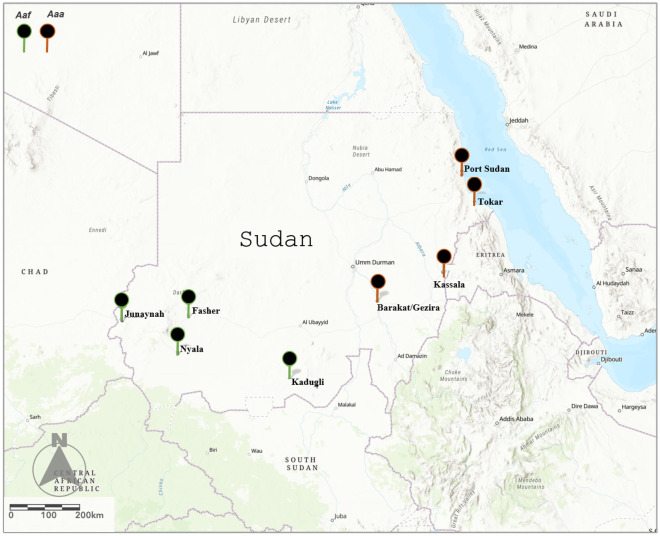
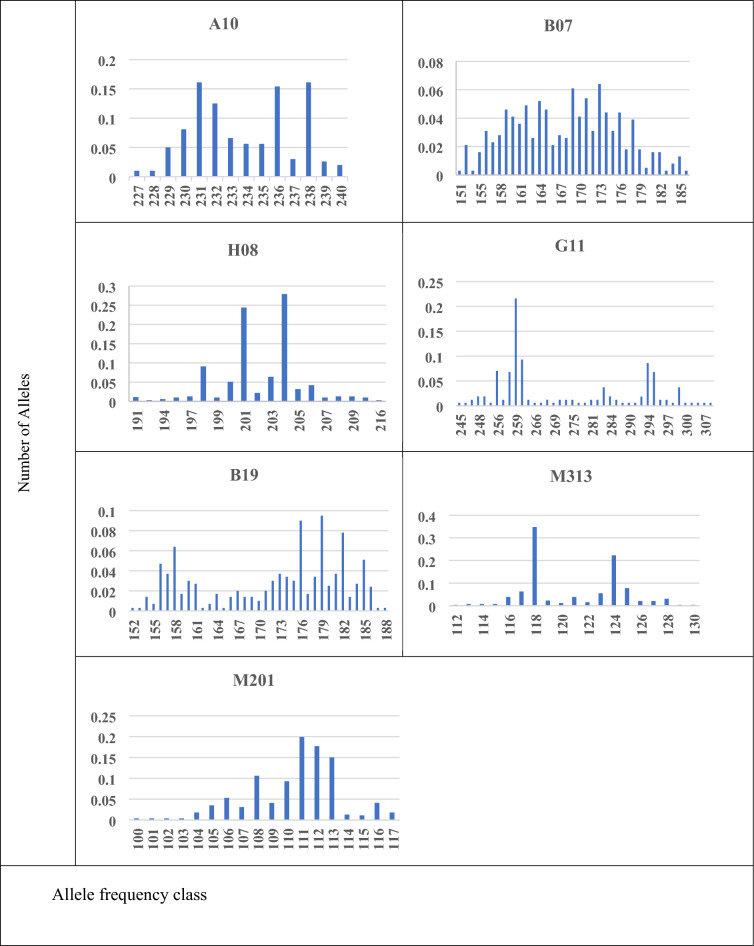
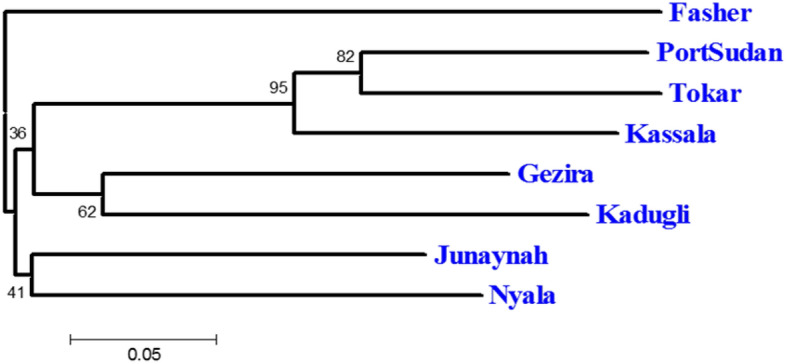
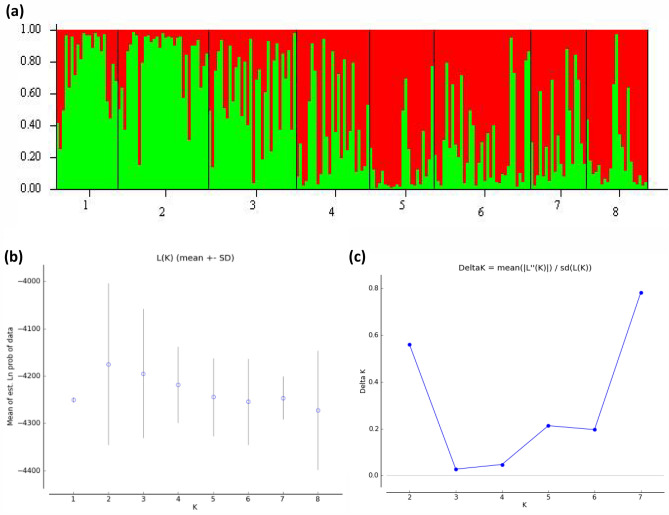
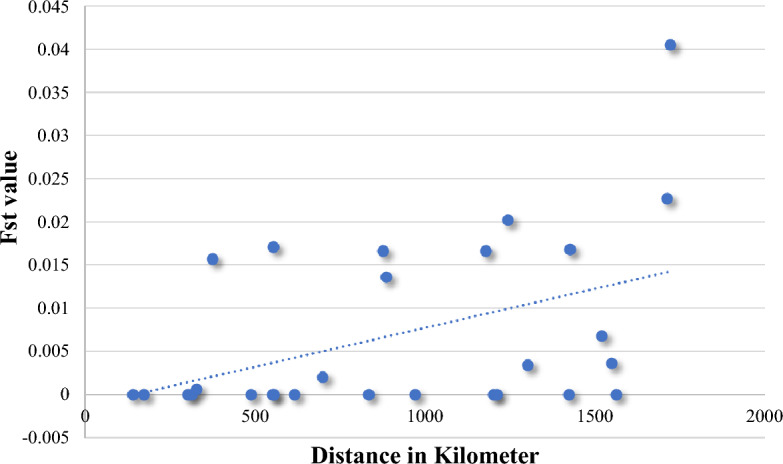
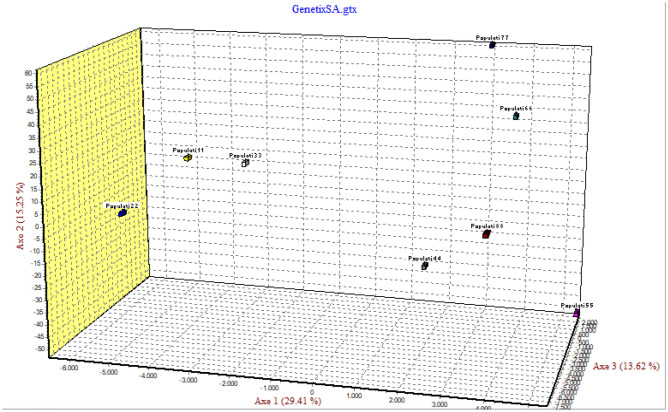
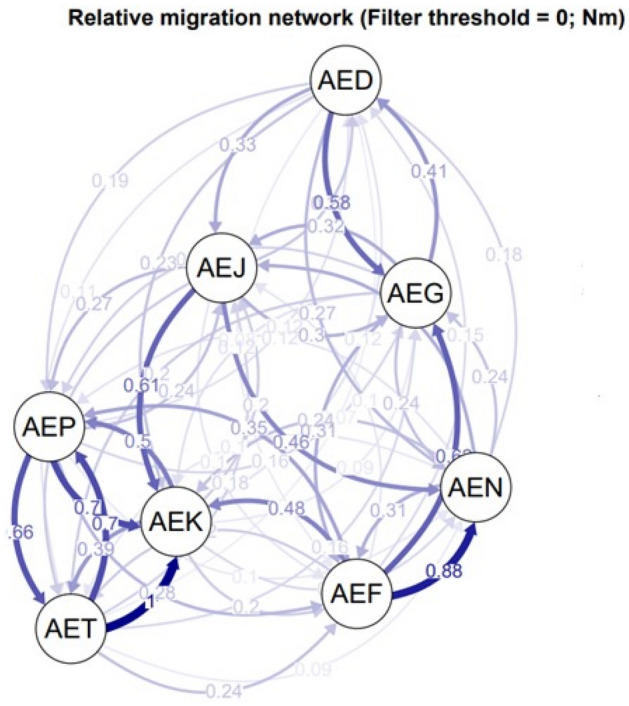
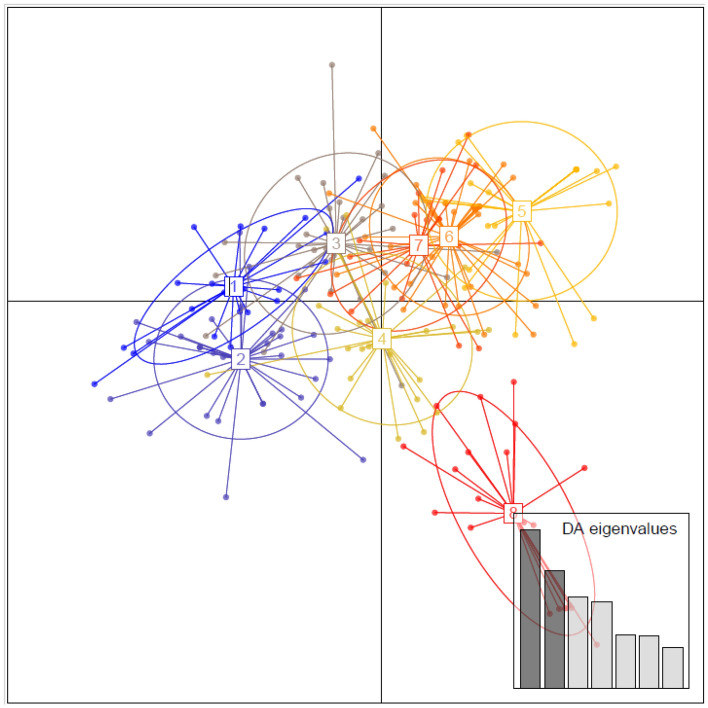
Although knowledge of the composition and genetic diversity of disease vectors is important for their management, this is limiting in many instances. In this study, the population structure and phylogenetic relationship of the two Aedes aegypti subspecies namely Aedes aegypti aegypti (Aaa) and Aedes aegypti formosus (Aaf) in eight geographical areas in Sudan were analyzed using seven microsatellite markers. Hardy-Weinberg Equilibrium (HWE) for the two subspecies revealed that Aaa deviated from HWE among the seven microsatellite loci, while Aaf exhibited departure in five loci and no departure in two loci (A10 and M201). The Factorial Correspondence Analysis (FCA) plots revealed that the Aaa populations from Port Sudan, Tokar, and Kassala clustered together (which is consistent with the unrooted phylogenetic tree), Aaf from Fasher and Nyala populations clustered together, and Gezira, Kadugli, and Junaynah populations also clustered together. The Bayesian cluster analysis structured the populations into two groups suggesting two genetically distinct groups (subspecies). Isolation by distance test revealed a moderate to strong significant correlation between geographical distance and genetic variations (p = 0.003, r = 0.391). The migration network created using divMigrate demonstrated that migration and gene exchange between subspecies populations appear to occur based on their geographical proximity. The genetic structure of the Ae. aegypti subspecies population and the gene flow among them, which may be interpreted as the mosquito vector's capacity for dispersal, were revealed in this study. These findings will help in the improvement of dengue epidemiology research including information on the identity of the target vector/subspecies and the arboviruses vector surveillance program.


Conflict of interest statement

The authors declare no competing interests.

Figures

Figure 1
Figure 1
Map showing the eight study sites of Aedes aegypti subspecies in Sudan. Aaa, Aedes aegypti aegypti. Aaf, Aedes aegypti Formosus.
Figure 2
Figure 2
Allele frequency distribution for eight populations of Ae. aegypti across seven microsatellite loci.
Figure 3
Figure 3
Unrooted neighbour-joining tree based on DA genetic distance at seven nuclear microsatellites of Ae. aegypti from eight sites in Sudan, numbers at the nodes are percentage bootstrap support from 1000 replicates. The scale bar represents 5% sequence divergence.
Figure 4
Figure 4
Bayesian clustering analysis generated through STRUCTURE and STRUCTURE HARVESTER based on eight microsatellite loci of eight Ae. aegypti populations (reduce analysis of ‘pure’ Group 1) to determine the exact value of K. (a) Results of assignment tests for numbers of clusters K = 2 indicated along the x-axis. (b) Mean (± SD) log posterior probabilities (c) estimate of ΔK for each value of K (putative number of populations. Each vertical line represents one individual, and y coordinates denote each individual's percentage assignment to each of the genetic clusters, represented by a different colour. Numbers from 1–8 are the study sites, 1 Port Sudan, 2 Tokar, 3 Kassala, 4 Barakat/Gezira, 5 Kadugli, 6 Nyala, 7 Fasher and 8 Junaynah.
Figure 5
Figure 5
Relationship between pairwise estimates of genetic distance (FST) and geographical distance (km) for Ae. aegypti microsatellite data. Trendline shows the general pattern of increasing genetic distance with greater geographic distance (IBD).
Figure 6
Figure 6
Three-dimensional factorial correspondence analysis (FCA) showing multivariate relationships among eight Ae. aegypti populations based on seven microsatellite loci variation. Population 1 Port Sudan, 2 Tokar, 3 Kassala, 4 Barakat/Gezira, 5 Kadugli, 6 Nyala, 7 Fasher, 8 Junaynah.
Figure 7
Figure 7
Migration network using divMigrate and based on Nm estimates. Each node represents a population. More gene flow between populations is indicated by the nodes' closeness, and the relative migration values are indicated by the arrows' strong colours. Code for the population names: AED: population from Kadugli, AEJ: population from Junaynah. AEG: population from Barakat/Gezira, AEN: population from Nyala, AEF: population from Fasher, AEP: population from Port Sudan, AEK: population from Kassala, AET: population from Tokar.
Figure 8
Figure 8
Discriminant Analysis of Principal Components (DAPC) for eight Aedes aegypti populations from Sudan using a microsatellite dataset. The graph depicts individuals as dots and groups as inertia ellipses. In the inset, a bar plot of discriminant analysis eigenvalues (DA eigenvalues) is shown. The number of bars represents the number of discriminant functions preserved in the analysis, and the eigenvalues represent the ratio of variance between groups to variation within groups for each discriminant function. 1: Port Sudan; 2: Tokar; 3: Kassala; 4: Barakat/Gezira; 5: Kadugli, 6: Nyala; 7: Fasher; 8: Junaynah.

Similar articles

Cited by

References

    1. Abuelmaali SA, et al. Distribution and genetic diversity of Aedes aegypti subspecies across the Sahelian belt in Sudan. Pathogens. 2021;10:78. doi: 10.3390/pathogens10010078. - DOI - PMC - PubMed
    1. Ahmed A, et al. Risks and challenges of arboviral diseases in Sudan: The urgent need for actions. Viruses. 2020;12:81. doi: 10.3390/v12010081. - DOI - PMC - PubMed
    1. Elnour M-AB, et al. Population genetic analysis of Aedes aegypti mosquitoes from Sudan revealed recent independent colonization events by the two subspecies. Front. Genet. 2022;13:825652. doi: 10.3389/fgene.2022.825652. - DOI - PMC - PubMed
    1. Lewis DJ. The Aëdes mosquitoes of the Sudan. Ann. Trop. Med. Parasitol. 1955;49:164–173. doi: 10.1080/00034983.1955.11685663. - DOI - PubMed
    1. Seidahmed OME, et al. Spatial and temporal patterns of dengue transmission along a red sea coastline: A longitudinal entomological and serological survey in Port Sudan City. PLoS Negl. Trop. Dis. 2012;6:e1821. doi: 10.1371/journal.pntd.0001821. - DOI - PMC - PubMed