. 2024 Feb 5;7(1):152.
doi: 10.1038/s42003-024-05780-y.

Comparative analyses of Netherton syndrome patients and Spink5 conditional knock-out mice uncover disease-relevant pathways

Affiliations

Comparative analyses of Netherton syndrome patients and Spink5 conditional knock-out mice uncover disease-relevant pathways

Evgeniya Petrova et al. Commun Biol. .

Abstract

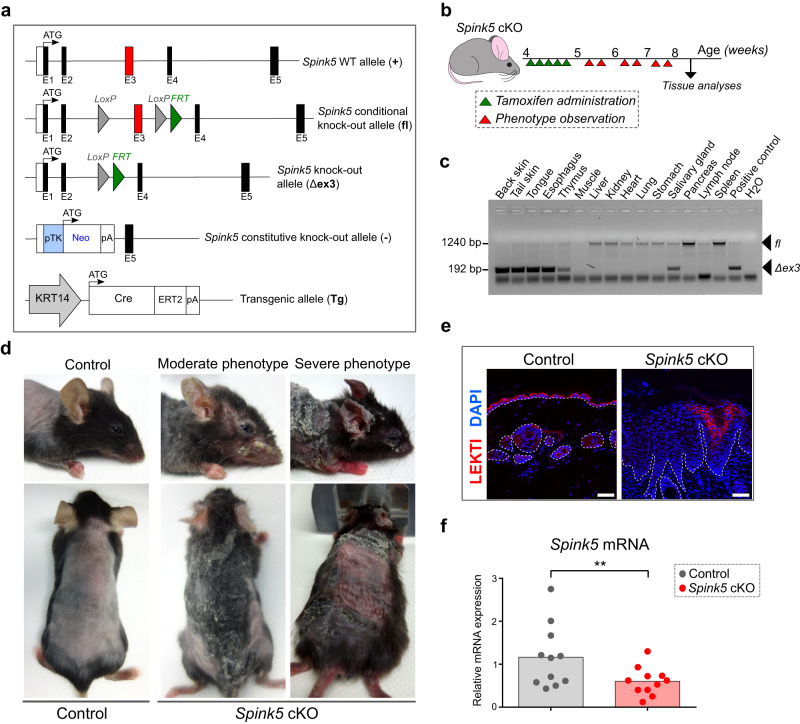
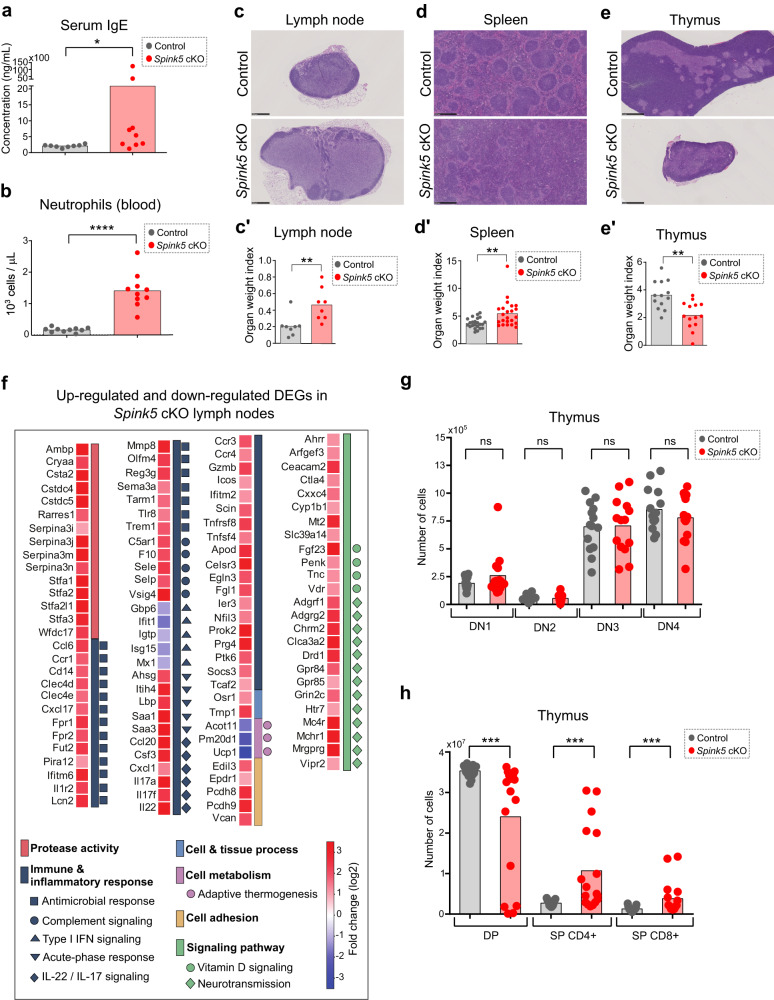
Netherton syndrome (NS) is a rare skin disease caused by loss-of-function mutations in the serine peptidase inhibitor Kazal type 5 (SPINK5) gene. Disease severity and the lack of efficacious treatments call for a better understanding of NS mechanisms. Here we describe a novel and viable, Spink5 conditional knock-out (cKO) mouse model, allowing to study NS progression. By combining transcriptomics and proteomics, we determine a disease molecular profile common to mouse models and NS patients. Spink5 cKO mice and NS patients share skin barrier and inflammation signatures defined by up-regulation and increased activity of proteases, IL-17, IL-36, and IL-20 family cytokine signaling. Systemic inflammation in Spink5 cKO mice correlates with disease severity and is associated with thymic atrophy and enlargement of lymph nodes and spleen. This systemic inflammation phenotype is marked by neutrophils and IL-17/IL-22 signaling, does not involve primary T cell immunodeficiency and is independent of bacterial infection. By comparing skin transcriptomes and proteomes, we uncover several putative substrates of tissue kallikrein-related proteases (KLKs), demonstrating that KLKs can proteolytically regulate IL-36 pro-inflammatory cytokines. Our study thus provides a conserved molecular framework for NS and reveals a KLK/IL-36 signaling axis, adding new insights into the disease mechanisms and therapeutic targets.


Conflict of interest statement

The authors declare the following competing interest(s): E.P., C.B. and A.H. are inventors of a patent. The rest of the authors declare no competing interests.

Figures

Fig. 1
Fig. 1. Conditional deletion of Spink5 using KRT14-CreERT2 results in viable mice that develop skin lesions resembling Netherton syndrome.
a Schematic of the Spink5 gene-targeted locus and alleles present in Spink5 conditional knock-out mice. The first 5 exons of the Spink5 WT allele are shown (boxes) with targeted exon 3 marked in red. The Spink5 conditional knock-out (floxed) allele and the knock-out (excised / Δex3) allele resulting from Cre-mediated excision of the loxP-flanked exon 3 are shown. The Spink5 constitutive knock-out allele (-) and the transgenic allele (Tg) expressing Cre-ERT2 under the human Keratin 14 (KRT14) promoter are shown. b Schematic of the protocol used for tamoxifen-inducible CreERT2-mediated Spink5 deletion in Spink5 cKO mice. c Image of agarose gel electrophoresis analysis of PCR done on genomic DNA to detect CreERT2-mediated excision of exon 3 in different tissue samples collected from an individual Spink5 conditional knock-out mouse. Arrows indicate bands corresponding to conditional (fl) and knock-out (Δex3) alleles. d Images of control and Spink5 conditional knock-out (cKO) mice with moderate and severe back skin and face skin phenotypes of at the age of 8 weeks. The back skin was shaved before imaging. e Confocal microscopy images of LEKTI immunofluorescence staining (red) in back skin paraffin sections of control and Spink5 cKO mice. Nuclei are counterstained with DAPI (blue). The dermal-epidermal junction is outlined with a white dashed line. Scale bars: 50 μm. f Spink5 mRNA expression levels measured in back skin samples of control and Spink5 cKO mice using RT-qPCR. Data in c is representative of three independent experiments. Data in d and e are representative of at least 10 and 5 independent experiments, respectively. The graph in f show means (bars) and scatter plot, where dots correspond to individual mice (n = 11 per group). Statistical significance was determined using two-tailed non-parametric Wilcoxon matched-pairs signed rank test: **p < 0.01. Control mice are Spink5fl/fl and/or Spink5fl/-; Spink5 cKO mice are KRT14-CreERT2(Tg/0)/Spink5fl/fl and/or KRT14-CreERT2(Tg/0)/Spink5fl/-. See also Supplementary Figs. 1 and 2.
Fig. 2
Fig. 2. The skin of Spink5 conditional KO mice displays increased serine protease activity, skin barrier defect and abnormal epidermal differentiation.
a Measurements of trypsin-like serine protease activity in protein extracts from back skin of control (gray) and Spink5 cKO (red) mice using the broad-spectrum fluorogenic substrate for trypsin-like serine proteases Boc-VPR-amc (left panel) and the KLK14-preferred fluorogenic peptide substrate Ac-WAVR-amc (right panel). b Measurements of chymotrypsin-like serine protease activity in protein extracts from back skin of control mice (gray) and Spink5 cKO mice (red) using the KLK7-preferred fluorogenic peptide substrate KHLY-amc. In a and b, activity is expressed as a ratio of the fluorescence intensity value measured in each skin sample to the mean of the fluorescence intensity values measured in skin extracts from control mice. The addition of the KLK5-specific inhibitor GSK951A or the KLK7-specific inhibitor pepPG278 serves as control to estimate the percent of trypsin-like or chymotrypsin-like protease activities due to KLK5 or KLK7 activation, respectively. As negative controls for protease activity inhibition, DMSO or the non-specific inhibitor pepPG303 were added. c Transepidermal water loss (TEWL) measurements performed on the back skin of control mice (gray) and lesional back skin of Spink5 cKO mice (red). d Hematoxylin and eosin staining of back skin paraffin sections from control mice (left panel) and Spink5 cKO littermate mice (right panel) with severe phenotype. Scale bars: 250 μm. e Quantification of epidermal thickness performed on images of hematoxylin- and eosin-stained back skin paraffin sections from control (gray) and Spink5 cKO (red) littermate mice. fo Immunofluorescence staining (red) of Loricrin (LOR, f), Involucrin (IVL, g), Filaggrin (FLG, h), Desmoglein1 (DSG1, i), Desmoplakin (DSP, j), E-cadherin (CDH1, k), Keratin10 (KRT10, l), Keratin 6A (KRT6A, m), Keratin 14 (KRT14, n) and the marker of proliferation Ki-67 (o) in back skin sections from control (upper panel) and Spink5 cKO (lower panel) littermate mice. Nuclei are counterstained with DAPI (blue). Scale bars: 50 μm. The dermal-epidermal junction is outlined with a white dashed line. Images are representative of immunofluorescence staining performed on samples from at least five different mice. The graphs in ac and e show means (bars) and scatter plots, where data points correspond to individual mice (n ≥ 8 per group). Each dot represents the mean of all measurements for an individual mouse. Statistical significance was determined using a two-tailed non-parametric Mann-Whitney test: ****p < 0.0001. Control mice are Spink5fl/fl and/or Spink5fl/; Spink5 cKO mice are KRT14-CreERT2(Tg/0)/Spink5fl/fl and/or KRT14-CreERT2(Tg/0)/Spink5fl/-. See also Supplementary Figs. 3 and 4.
Fig. 3
Fig. 3. Transcriptome profiling of Spink5 cKO skin and comparison to the lesional skin transcriptomes of NS patients and previous mouse models of NS.
a-c Scatter plots of correlation between gene expression changes in lesional skin of NS patients and lesional skin of Spink5 cKO mice (a), Tg.hKLK5 mice (b) and Spink5-/- mice (c). Each dot corresponds to a gene pair. d Venn diagrams of differentially up-regulated genes (adjusted P-value < 0.05; log2 fold change > 1) and down-regulated genes (adjusted P-value < 0.05; log2 fold change < −1) in Spink5 cKO mice skin (green) and NS patients’ lesional skin (red). e Lollipop plot of the 20 most significantly enriched biological process GO terms within the differentially up-regulated and down-regulated genes shared between Spink5 cKO skin and NS patients’ lesional skin. The size of each circle is proportional to the GO P-value. The red or blue arrows next to each GO id number indicate enrichment in the up-regulated or down-regulated DEGs, respectively. f Heatmap of log2 fold change values (color bar) of selected differentially expressed genes within the GOs ‘keratinization’, ‘cell population proliferation’, ‘proteolysis’ and ‘negative regulation of peptidase activity’ enriched in the differentially expressed genes (DEGs) overlapping between Spink5 cKO and NS patient skin transcriptomes. g Scatter plot of correlation between gene expression changes in lesional skin of Spink5 cKO and Tg.hKLK5 mice. h, i 2-D density plot of correlation between Spink5 cKO and NS patients’ lesional skin transcriptomes (h) and Tg.hKLK5 and NS patients’ skin transcriptomes (i) calculated only with the subset of genes annotated to the enriched GO terms related to protease activity (‘proteolysis’ and ‘negative regulation of peptidase activity’). Several genes of interest are indicated with the corresponding human gene symbol. j Heatmap of log2 fold change values (color bar) of selected differentially expressed genes within the GO category “Immune and Inflammatory response” common to Spink5 cKO and NS patients’ lesional skin. Human gene symbols were used for annotation. k 2-D density plot of correlation between Spink5 cKO and NS patients lesional skin transcriptomes calculated only with the subset of genes annotated to the GO terms within the “Immune and Inflammatory response” category. In (ac), (gi), and (k), Pearson correlation coefficient r, P-value and the total number of data points are indicated in the upper left corner of each plot. See also Supplementary Figs. 5–7 and Supplementary Data 1 and 2.
Fig. 4
Fig. 4. Proteome profiling of Spink5 cKO skin and comparison with skin proteome of NS patients and previous mouse models of NS.
a-c Scatter plots of correlation between proteins expressed in NS patient lesional skin and lesional skin of Spink5 cKO mice (a), Tg.hKLK5 mice (b), and Spink5-/- mice (c). Each dot corresponds to a protein pair. d Venn diagrams of differentially up-regulated proteins (adj. P-value < 0.05 and log2 fold change > 1 for NS patients’ skin samples; adj. P-value < 0.05 and log2 fold change > 0.33 for Spink5 cKO skin samples) and down-regulated proteins (adj. P-value < 0.05 and log2 fold change <−1 for NS patients’ skin samples; adj. P-value < 0.05 and log2 fold change <−0.33 for Spink5 cKO skin samples) in Spink5 cKO mice skin (green) and NS patients’ lesional skin (red). e Heatmap of log2 fold change values (color bar) of differentially expressed proteins (DEPs) within the biological process GO terms that were significantly enriched in the set of DEPs shared between Spink5 cKO mice and NS patient lesional skin. The color legend denotes the GO groups according to the similarity of the biological process of GO terms. f Masson’s trichrome staining of back skin paraffin sections from control and Spink5 cKO mice to visualize the density of collagen fibers (blue). Images are representative of analyses performed on samples from 6 different mice per group. Scale bar: 100 µm. g Confocal fluorescence microscopy images of CD34 (red) and Vimentin (VIM, green) double immunofluorescence staining in back skin paraffin sections of control and Spink5 cKO mice. Nuclei are counterstained with DAPI (blue). The dermal-epidermal junction is outlined with a white dashed line. Scale bars: 50 μm. hj Quantification of VIM+ and VIM+CD34+ cells in double immunofluorescence staining images of control and Spink5 cKO skin. The number of VIM+ cells (h) and VIM+CD34+ cells (i) and the percentage of VIM+CD34+ cells from the total number of VIM+ cells (j) are shown. Each data point represents the average from the quantification of at least 3 images per skin sample from a different mouse with n = 6 mice per group. In ac, Pearson correlation coefficient r, P-value and the total number of data points are indicated in the lower right corner of each plot. See also Supplementary Fig. 8 and Supplementary Data 3.
Fig. 5
Fig. 5. Comparative transcriptome and proteome analyses of Spink5 cKO and NS patient lesional skin identify putative endogenous substrates of skin proteases.
a, b Scatter plot of correlation between mRNA and protein fold changes in NS patient (a) and Spink5 cKO (b) lesional skin. Standardized residual values are superimposed on the scatter plots as a color gradient (color bar) and indicate the difference (standardized residual) between the observed protein fold change of each mRNA-protein pair and the expected protein fold change given by the correlation between mRNA-protein pairs. The regression line is represented as a black dashed line. Gray dashed lines mark the threshold values +1 and −1 of standardized residuals used as filter criteria for subsequent analyses. Black dots indicate the position of the selected mRNA-protein pairs common to NS patient and Spink5 cKO transcriptome-proteome datasets, that belong to any significantly enriched GO term and whose standardized residual value is >1 or < −1 in both NS patient and Spink5 cKO datasets. Pearson correlation coefficient r, P-value and the total number of data points are indicated on each plot. c, d Heatmap of log2 fold change expression values of mRNA-protein pairs, whose protein levels are significantly shifted from the corresponding transcript expression levels in both NS patient and Spink5 cKO mouse skin (c), or in both Spink5 cKO and Tg.hKLK5 skin (d). e Silver stain SDS-PAGE gel analyses of protein fragments obtained by in vitro digestion of recombinant human full-length AHSG protein with recombinant human KLK14 enzyme at different enzyme to substrate molar ratios after incubation for 2 h and 24 h at 37 °C. Black arrows indicate the cleavage products. f Silver stain SDS-PAGE gel analyses of protein fragments obtained by in vitro digestion of recombinant human full-length IL-36A by recombinant human KLK5, KLK6, KLK7, KLK8, KLK13, or KLK14 at enzyme to substrate molar ratio of 1:100 after 2-h (upper panel) and overnight (lower panel) incubation at 37 °C. See also Supplementary Figs. 9–12.
Fig. 6
Fig. 6. Spink5 cKO mice display a multifaceted skin inflammation phenotype predominated by IL-36/IL-17 signaling.
a Detection of mast cells by toluidine blue staining (dark violet) of back skin paraffin sections from control (upper panel) and Spink5 cKO (lower panel) mice. The zoomed area in the inset is outlined with a red dashed-line rectangle. Scale bars: 250 μm. a′ Quantification of mast cell dermal infiltrates in control and Spink5 cKO mice. be Immunofluorescence staining (red) of Ly-6G/C (b), CD3 (c), CD19 (d), and IL-17A (e) in back skin of control (upper panel) and Spink5 cKO (lower panel) mice and quantification of neutrophils (Ly-6G/C+ cells, b), T cells (CD3+ cells, c′), B cells (CD19+ cells, d′) and IL-17A+ cells (e′) in immunostained skin sections. Scale bars: 50 μm. fk Immunofluorescence staining (red) of FOXP3 (f), IL-36A (g), IL-24 (h), CXCL3 (i), pSTAT3 (j), and S100A9 (k) in back skin sections of control (upper panels) and Spink5 cKO (lower panels) mice. Scale bars: 50 μm. f′ Number of cytoplasmic FOXP3+ cells (activated conventional T cells) and nuclear FOXP3 + cells (Treg cells) quantified in immunostained skin sections from control (gray) and Spink5 cKO (red) mice. g′k′ Quantification of IL-36 (g), IL-24 (h′), and S100A9 (k′) immunostaining signal in epidermis, number of CXCL3+ cells in dermis (i) and number of pSTAT3+ cells (j′) in dermis and epidermis of immunostained skin sections from control (gray) and Spink5 cKO (red) mice. In (be) and (fk), the dermal-epidermal junction is outlined with a white dashed line and nuclei are counterstained with DAPI (blue). Images are representative of immunofluorescence staining performed on skin samples of at least 5 different mice per group. Data in a′e′ and f′k′ are means (bars) and scatter plots, where dots correspond to values measured for individual mice (n ≥ 5 per group). Statistical significance was determined using two-tailed unpaired non-parametric Mann–Whitney test: *p < 0.05 **p < 0.01, ***p < 0.001, ns (not significant). Control mice are Spink5fl/fl and/or Spink5fl/-; Spink5 cKO mice are KRT14-CreERT2(Tg/0)/Spink5fl/fl and/or KRT14-CreERT2(Tg/0)/Spink5fl/-. See also Supplementary Fig. 13.
Fig. 7
Fig. 7. Systemic inflammation phenotype of Spink5 cKO mice.
a Serum IgE levels measured by ELISA in control (gray) and Spink5 cKO (red) mice. b Neutrophil counts measured in whole blood of control (gray) and Spink5 cKO (red) mice. ce Images of hematoxylin- and eosin-stained paraffin sections of inguinal lymph node (c), spleen (d), and thymus (e) from control (upper panels) and Spink5 cKO (lower panels) littermate mice at an average age of 4.5 weeks. Scale bars: 500 µm (lymph node), 1 mm (spleen and thymus). c’-e′ Quantification of the organ weight index (organ weight in milligrams divided by total body weight in grams) of control (gray) and Spink5 cKO (red) mice. f Heatmap of log2 fold change values of differentially expressed genes in lymph nodes of Spink5 cKO mice. This set of genes was annotated in the significantly enriched biological process GO terms (shown in Supplementary Fig. 16b) determined by analyzing the up-regulated (log2FC > 1 and adj. P-value < 0.05) and down-regulated (log2FC < −1 and adj. P-value < 0.05) genes in Spink5 cKO lymph nodes. The color legend denotes the GO groups according to the similarity of the biological process of each GO term. Additional sub-groups of genes depending on their function are indicated by symbols. g Number of DN1 (CD25-CD44+), DN2 (CD25+CD44+), DN3 (CD25+CD44-) and DN4 (CD25-CD44-) thymocytes in the thymus of control (gray) and Spink5 cKO (red) littermate mice determined by flow cytometry. h Number of DP (CD8+CD4+), SP CD4+ (single-positive CD4+CD8-) and SP CD8+ (single-positive CD4-CD8+) thymocytes in the thymus of control (gray) and Spink5 cKO (red) littermate mice determined by flow cytometry. Data in (a, b), (c′e′), and (g, h) are means (bars) and scatter plots, where data points correspond to the mean values measured for individual mice (n ≥ 8 per group). Statistical significance was determined using two-tailed non-parametric Wilcoxon matched-pairs signed rank (g, h) or two-tailed unpaired non-parametric Mann-Whitney tests (a, b) and (c′e′): *p < 0.05, **p < 0.01, ***p < 0.001, ****p < 0.0001, ns (not significant). Control mice are Spink5fl/fl and/or Spink5fl/-; Spink5 cKO mice are KRT14-CreERT2(Tg/0)/Spink5fl/fl and/or KRT14-CreERT2(Tg/0)/Spink5fl/-. See also Supplementary Figs. 14–17.
Fig. 8
Fig. 8. Expression and activity of kallikrein-related peptidases in Spink5 cKO thymus.
ac Double immunofluorescence staining of (a) KLK5 (red) and the marker of medullary thymic epithelial cells Keratin 5 (KRT5, green), (b) KLK7 and KRT5, and (c) KLK14 and KRT5 in paraffin sections of thymus from control and Spink5 cKO mice. Thymic medulla is outlined by a white dashed line. The region marked with white dashed-line rectangles in the upper panels is the magnified image shown in the lowermost panels. Scale bars: 50 μm, magnified image: 25 µm. a′-c′ Quantification of the number of KLK5+ cells (a′), KLK7+ cells (b′), and KLK14+ cells (c′) in immunofluorescence staining images of the thymic medulla region in control and Spink5 cKO mice. Images are representative of immunofluorescence staining performed on thymus samples of at least 4 different mice per group. d Measurements of trypsin-like serine protease activity in protein extracts from thymus of control (gray) and Spink5 cKO (red) mice using the broad-spectrum fluorogenic substrate for trypsin-like serine proteases Boc-VPR-amc (left panel) and the KLK14-preferred fluorogenic peptide substrate Ac-WAVR-amc (right panel). e Measurements of chymotrypsin-like serine protease activity in protein extracts from thymus of control mice (gray) and Spink5 cKO mice (red) using the KLK7-preferred fluorogenic peptide substrate KHLY-amc. In d and e, activity is expressed as a ratio of the fluorescence intensity value measured in each thymus sample to the mean of the fluorescence intensity values measured in thymus extracts from control mice. The addition of the KLK5-specific inhibitor GSK951A or the KLK7-specific inhibitor pepPG278 serves as control to estimate the percent of trypsin-like or chymotrypsin-like protease activities due to KLK5 or KLK7 activation, respectively. Data in (a′c) and (d, e) are means (bars) and scatter plots, where dots correspond to values measured for individual mice (n ≥ 4 per group). Statistical significance was determined using two-tailed unpaired non-parametric Mann–Whitney test: *p < 0.05 **p < 0.01, ***p < 0.001, ns (not significant). Control mice are Spink5fl/fl and/or Spink5fl/-; Spink5 cKO mice are KRT14-CreERT2(Tg/0)/Spink5fl/fl and/or KRT14-CreERT2(Tg/0)/Spink5fl/-. See also Supplementary Fig. 19.

References

    1. Chavanas S, et al. Mutations in SPINK5, encoding a serine protease inhibitor, cause Netherton syndrome. Nat. Genet. 2000;25:141–142. doi: 10.1038/75977. - DOI - PubMed
    1. Williams MR, et al. Interplay of Staphylococcal and host proteases promotes skin barrier disruption in netherton syndrome. Cell Rep. 2020;30:2923–2933.e7. doi: 10.1016/j.celrep.2020.02.021. - DOI - PMC - PubMed
    1. Barbieux C, et al. Netherton syndrome subtypes share IL-17/IL-36 signature with distinct IFN-α and allergic responses. J. Allergy Clin. Immunol. 2022;149:1358–1372. doi: 10.1016/j.jaci.2021.08.024. - DOI - PubMed
    1. Petrova E, Hovnanian A. Advances in understanding of Netherton syndrome and therapeutic implications. Expert Opin. Orphan Drugs. 2020;8:455–487. doi: 10.1080/21678707.2020.1857724. - DOI
    1. Bitoun E, et al. LEKTI proteolytic processing in human primary keratinocytes, tissue distribution and defective expression in Netherton syndrome. Hum. Mol. Genet. 2003;12:2417–2430. doi: 10.1093/hmg/ddg247. - DOI - PubMed

Publication types