. 2024 Feb;9(2):359-376.
doi: 10.1038/s41564-023-01564-y. Epub 2024 Feb 5.

The gut virome is associated with stress-induced changes in behaviour and immune responses in mice

Affiliations

The gut virome is associated with stress-induced changes in behaviour and immune responses in mice

Nathaniel L Ritz et al. Nat Microbiol. 2024 Feb.

Abstract

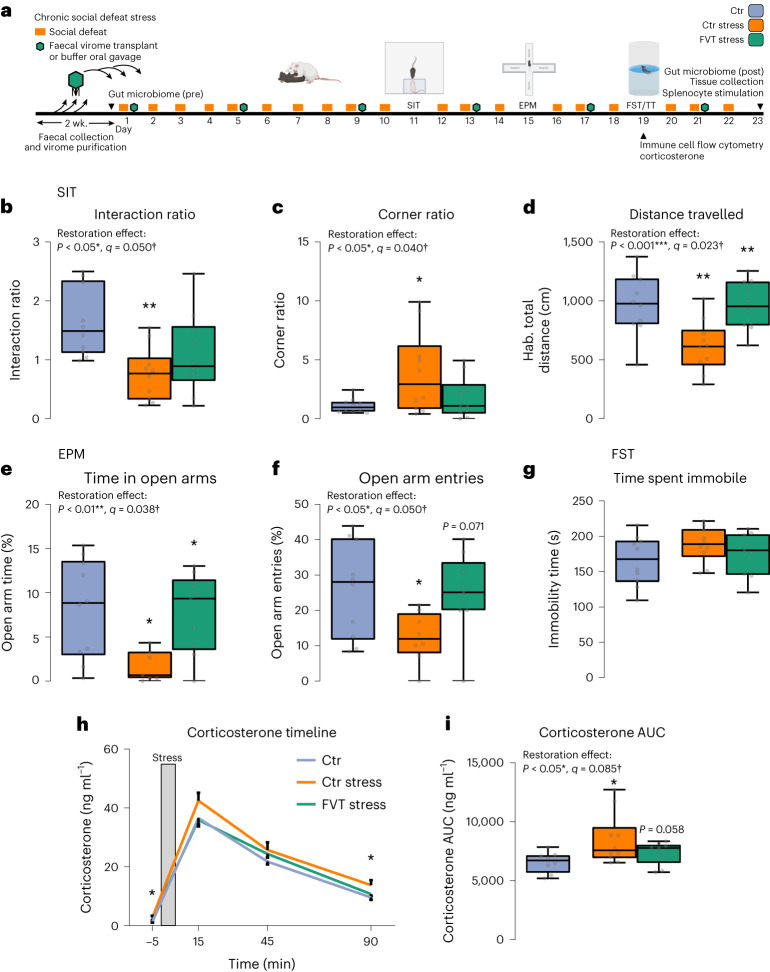
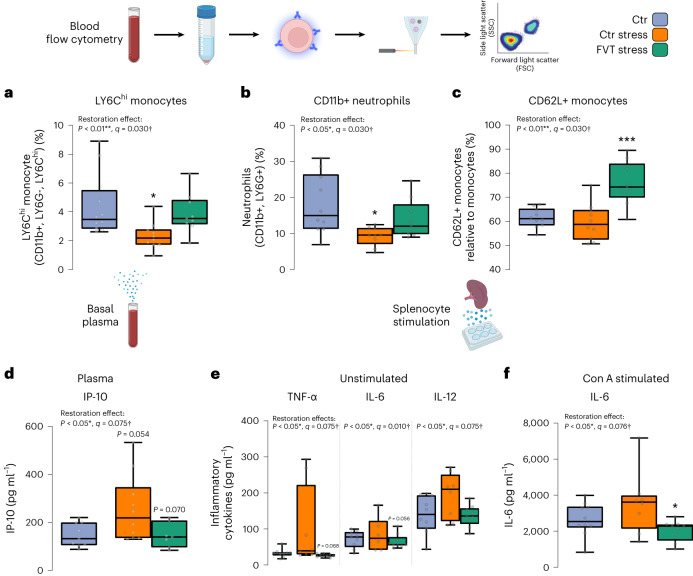
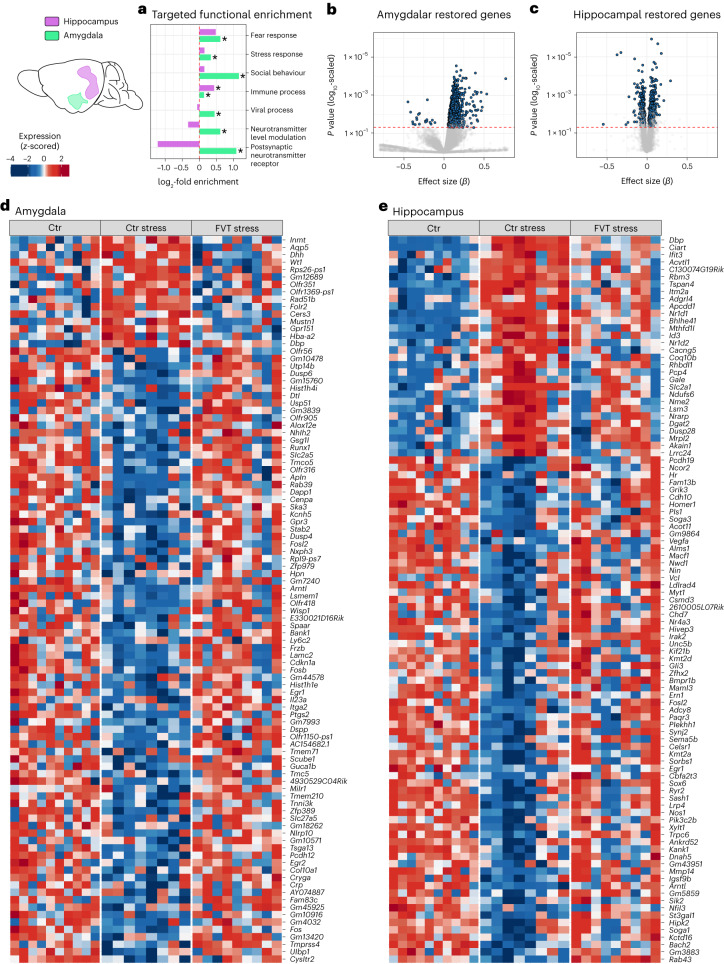
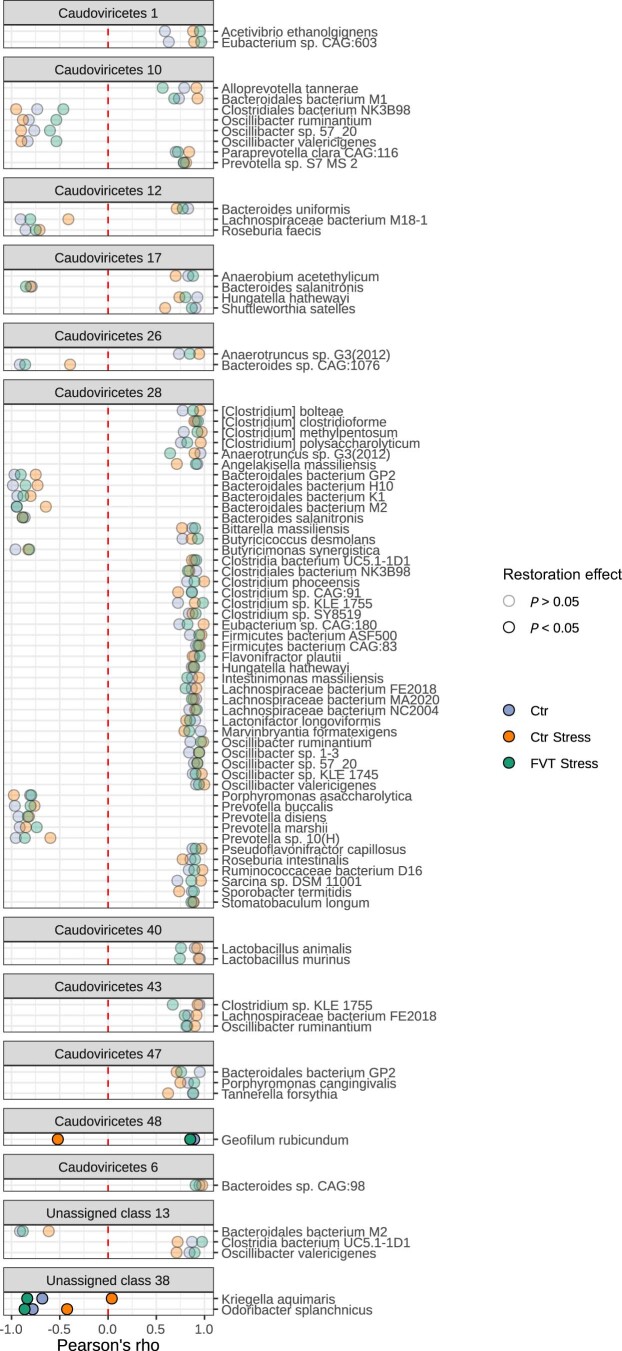
The microbiota-gut-brain axis has been shown to play an important role in the stress response, but previous work has focused primarily on the role of the bacteriome. The gut virome constitutes a major portion of the microbiome, with bacteriophages having the potential to remodel bacteriome structure and activity. Here we use a mouse model of chronic social stress, and employ 16S rRNA and whole metagenomic sequencing on faecal pellets to determine how the virome is modulated by and contributes to the effects of stress. We found that chronic stress led to behavioural, immune and bacteriome alterations in mice that were associated with changes in the bacteriophage class Caudoviricetes and unassigned viral taxa. To determine whether these changes were causally related to stress-associated behavioural or physiological outcomes, we conducted a faecal virome transplant from mice before stress and autochthonously transferred it to mice undergoing chronic social stress. The transfer of the faecal virome protected against stress-associated behaviour sequelae and restored stress-induced changes in select circulating immune cell populations, cytokine release, bacteriome alterations and gene expression in the amygdala. These data provide evidence that the virome plays a role in the modulation of the microbiota-gut-brain axis during stress, indicating that these viral populations should be considered when designing future microbiome-directed therapies.


Conflict of interest statement

The authors declare no competing interests.

Figures

Fig. 1
Fig. 1. Chronic psychosocial stress leads to microbiome, behavioural, physiological and immune alterations.
a, Chronic psychosocial stress experimental timeline. b, Faecal bacteriome Aitchison beta-diversity was significantly different between stress (Stress) and control (Ctr) groups as assessed by PERMANOVA (R2 = 0.1693, P < 0.01; Ctr n = 10, Stress n = 9). c, There was a trend of a difference in pooled faecal virome Aitchison beta-diversity between stress and control groups as assessed by PERMANOVA (R2 = 0.3011, P = 0.1; Ctr n = 10 pooled in 3 samples, Stress n = 10 pooled in 3 samples). d,e, No differences were found in bacteriome (d) (Ctr n = 9, Stress n = 9) or virome (e) alpha-diversity metrics (Ctr n = 10 pooled in 3 samples, Stress n = 10 pooled in 3 samples). f, Differentially abundant phages of the stress group compared to the control group identified at the class taxonomic level; data are presented as mean ± 95% confidence intervals of β-estimate (Ctr n = 10 pooled in 3 samples, Stress n = 10 pooled in 3 samples). g, In the social interaction test (SIT), stress significantly reduced social interaction as measured by percentage of time in the interaction zone with CD1 mice divided by the time spent in the interaction zone without CD1 mice (t(18) = 3.317, P < 0.01; Ctr n = 10, Stress n = 10). h, In the FST test, stress-coping behaviour measured by time spent immobile was significantly increased by stress (t(18) = −4.946, P < 0.001; Ctr n = 10, Stress n = 10). i, Stress caused a significant increase in basal plasma corticosterone collected by tail tipping (TT) before FST (t(15.68) = −2.224, P < 0.05; Ctr n = 10, Stress n = 10). j, There was a trend for corticosterone measured at 45 min post FST to be increased in the stress group (t(18) = −2.077, P = 0.052; Ctr n = 10, Stress n = 10). k,l, Analysis of inflammatory cytokines collected from supernatant after 24 h ex vitro ConA splenocyte stimulations of IL-6 (k) and IL-10 (l) revealed significant increases in the stress group compared with the control (t(18) = −2.316, P < 0.05; t(18) = −2.257, P < 0.05, respectively; Ctr n = 10, Stress n = 10). Data in dl were compared using independent-samples two-sided t-test (*P < 0.05, **P < 0.01, ***P < 0.001). Data presented as boxplots display the minimum, first quartile, median, third quartile and maximum.
Fig. 2
Fig. 2. Faecal virome transplant attenuates stress-related behaviours.
a, Experimental timeline. b, In the SIT test, stress significantly reduced the social interaction ratio in the Ctr Stress group (P < 0.05, q = 0.050, t(27) = 9.395, P < 0.01, P = 0.427, respectively; n = 10 per group). c, The corner ratio was significantly increased by stress (P < 0.05, q = 0.040, t(27) = 6.067, P < 0.05, P = 0.111; n = 10 per group). d, The distance travelled during the habituation phase of the test was significantly reduced by stress and restored in the FVT group (P < 0.001, q = 0.023, t(27) = 17.761, P < 0.01, P < 0.01; n = 10 per group). e, In the EPM test, stress significantly increased the percentage of time spent in the open arms and the FVT restored this effect (P < 0.01, q = 0.038, t(23) = 4.818, P < 0.05, P < 0.05; Ctr n = 10, Ctr Stress n = 7, FVT Stress n = 9). f, Entries into the EPM open arms were reduced in the stress group followed by a trend of restoration by FVT (P < 0.05, q = 0.050, t(23) = 7.254, P < 0.05, P = 0.071; Ctr n = 10, Ctr Stress n = 7, FVT Stress n = 9). g, In the FST, there were no effects recorded. h, Plasma corticosterone collected by TT was measured at −5 min (basal), +15 min, +45 min and +90 min from FST initiation; data are presented as mean ± s.e.m. There was increased corticosterone in the Ctr Stress group compared with the Ctr at the basal and 90 min post-FST timepoints as assessed by orthogonal contrast followed by Tukey’s two-sided pairwise post hoc test (P < 0.05, t(16) = 2.673, P < 0.05, t(16) = 2.386, P < 0.05, respectively; Ctr n = 8, Ctr Stress n = 10, FVT Stress n = 9). i, Area-under-curve (AUC) of corticosterone was increased in the stress group followed by a trend of reduction by FVT (P < 0.05, q = 0.085, t(26) = 26.703, P < 0.05, P = 0.058; Ctr n = 8, Ctr Stress n = 10, FVT Stress n = 9). In bg and i, the restoration effect was measured using planned orthogonal contrast followed by Tukey’s post hoc test (two-sided pairwise comparisons of Ctr–Ctr Stress and Ctr Stress–FVT Stress) and BH-FDR adjustment. Data are presented in the following order: P = restoration effect measured by orthogonal contrast; q = BH-FDR-adjusted P value; P = Tukey’s post hoc test. Tukey’s pairwise post hoc P values were calculated for Ctr–Ctr Stress and Ctr Stress–FVT Stress. Significant effects are denoted by: *P < 0.05, **P < 0.01, ***P < 0.001, †q < 0.2. Data presented as boxplots display the minimum, first quartile, median, third quartile and maximum.
Fig. 3
Fig. 3. Viral characterization of the faecal virome transplant and the effect on recipient microbiome.
a, Representative epifluorescence microscopy image of virus-like particles from an FVT inoculum stained with SYBR Gold at ×100 magnification. No other microbes were observed using this method and viral counts were assessed for each FVT inoculum (FVT Stress n = 9). For quantification, 4 representative images per sample were taken at predefined quadrant fields of view of the slide and the mean count was used to calculate total number of virus-like particles per sample. b, Absolute counts of virus-like particles calculated using epifluorescence microscopy (black) and sequencing reads (grey) using a Q33 Lactococcal phage spike (FVT Stress n = 9). c, Autochthonous FVT inocula relative abundance of viral taxa for each individual FVT treatment (FVT Stress n = 9). d, Longitudinal measure of differential bacterial species affected by stress and restored by FVT study as assessed by linear mixed effect models (Ctr n = 10, Ctr Stress n = 8, FVT Stress n = 9). e, Predicted phage–host pairs present in FVT inocula and faecal bacteriome phyla of the FVT Stress group analysed at the end of study (FVT Stress n = 9).
Fig. 4
Fig. 4. Effects of FVT on immune activation and inflammation.
Blood immune cell populations were assessed by flow cytometry after 16 d of chronic social defeat. a, There was a restoration effect of relative LY6Chi monocytes that were reduced by stress and recovered by FVT (restoration effect P < 0.01, BH-FDR-adjusted P value q = 0.030, t(26) = −2.867, Tukey’s pairwise comparisons P < 0.05, P = 0.106, respectively; Ctr n = 10, Ctr Stress n = 10, FVT Stress n = 9). b, There was a restoration effect of relative neutrophils that were reduced by stress and improved by FVT (P < 0.01, q = 0.030, t(25) = −2.788, P < 0.05, P = 0.231; Ctr n = 10, Ctr Stress n = 9, FVT Stress n = 9). c, There was a restoration effect of LY6Chi monocytes carrying CD62-ligand that were not affected by stress but were strongly increased by FVT (P < 0.05, q = 0.030, t(26) = −3.18, P = 0.845, P < 0.001; Ctr n = 10, Ctr Stress n = 10, FVT Stress n = 9). d, Inflammatory cytokines were measured in plasma where there was a restoration effect for plasma IP-10 increased by stress and reduced by FVT (P < 0.05, q = 0.075, t(23) = 2.828, P = 0.054, P = 0.070; Ctr n = 9, Ctr Stress n = 10, FVT Stress n = 7). Inflammatory cytokines were also measured in unstimulated splenocyte culture supernatants and cultures that were stimulated with ConA or LPS. e,f, There were restoration effects for unstimulated splenocyte culture inflammatory cytokines of TNF-α (P < 0.05, q = 0.075, t(23) = 2.68, P = 0.086, P = 0.056; Ctr n = 9, Ctr Stress n = 8, FVT Stress n = 9), IL-12/IL-23p40 (P < 0.05, q = 0.075, t(24) = 2.634, P = 0.079, P = 0.068; Ctr n = 10, Ctr Stress n = 8, FVT Stress n = 9) and IL-6 (P < 0.05, q = 0.010, t(22) = 2.328, P = 0.162, P = 0.091; Ctr n = 9, Ctr Stress n = 6, FVT Stress n = 9) (e); and for IL-6 ConA stimulation of splenocytes (f) (P < 0.05, q = 0.076, t(24) = 2.517, P = 0.24, P < 0.05; Ctr n = 10, Ctr Stress n = 8, FVT Stress n = 9). In af, the restoration effect was measured using planned orthogonal contrast followed by Tukey’s post hoc test (two-sided pairwise comparisons of Ctr–Ctr Stress and Ctr Stress–FVT Stress) and BH-FDR adjustment. Data are presented in the following order: P = restoration effect measured by orthogonal contrast; q = BH-FDR-adjusted P value; P = Tukey’s post hoc test. Tukey’s pairwise post hoc P values were calculated for Ctr–Ctr Stress and Ctr Stress–FVT Stress. Data presented as boxplots display the minimum, first quartile, median, third quartile and maximum. Significant effects are denoted by: *P < 0.05, **P < 0.01, ***P < 0.001, †q < 0.2.
Fig. 5
Fig. 5. Amygdalar and hippocampal transcriptomic targeted gene ontology.
Amygdala and hippocampus brain regions were selected for deep transcriptomic analysis for genes altered by stress and restored by FVT (restoration effect). a, Stress, social behaviour and microbiota–gut–brain axis targeted gene ontology of functional enrichment in genes restored in the hippocampus (purple) and the amygdala (green) (Ctr n = 10, Ctr Stress n = 8, FVT Stress n = 9; significant effects are denoted by *P < 0.001). b,c, Volcano plots showing the genes most significantly affected by stress and restored by FVT in the amygdala (b) (4,852 genes; 4,833 upregulated, 19 downregulated) and the hippocampus (c) (441 genes; 223 upregulated, 208 downregulated) (Ctr n = 10, Ctr Stress n = 8, FVT Stress n = 9). Genes (blue dots) to the right of ‘0’ are upregulated, while genes to the left of ‘0’ are downregulated following stress and FVT treatment. d,e, Heat plots showing the most significantly restored genes in the amygdala (d) and hippocampus (e). Differentially expressed gene ontology clusters and individual genes were assessed by linear models followed by Storey’s FDR.
Extended Data Fig. 1
Extended Data Fig. 1. Study workflow summary.
(a) First, to answer whether the gut virome is affected by stress we assessed behaviour, physiology, and microbiome alterations following chronic psychosocial stress. (b) Then, to determine if the virome can be harnessed to prevent stress, we administered an autochthonous faecal virome transplant (FVT) treatment to mice as they underwent stress and found that the FVT attenuated stress effects on behaviour, physiology, microbiome, and brain transcriptomics.
Extended Data Fig. 2
Extended Data Fig. 2. Before and after chronic psychosocial stress microbiome comparisons.
(a) Bacteriome Aitchison beta diversity measures before (Pre) and after (Post) chronic psychosocial stress, no differences were found in Pre, however there was a significant alteration found in Post assessed by PERMANOVA (R2 = 0.1693, p < 0.01) (n = 10 Ctr, pooled in 3 in Pre timepoint; n = 9 Stress). (b) Virome Aitchison beta diversity measures before (pre) and after (post) chronic psychosocial stress, no differences were found in Pre, however there was a trend for alteration found in Post assessed by PERMANOVA (R2 = 0.3011, p = 0.1) (n = 10 Ctr pooled in 3; n = 10 Stress pooled in 3). (c) Bacteriome alpha diversity measures (Chao1, Shannon Entropy, and Simpson Index), no significant differences were found Pre or Post assessed by independent-samples two-sided T test (n = 10 Ctr, pooled in 3 in Pre timepoint; n = 9 Stress). (d) Virome alpha diversity measures (Chao1, Shannon Entropy, and Simpson Index), no significant differences were found Pre or Post assessed by independent-samples two-sided T test (n = 10 Ctr pooled in 3; n = 10 Stress pooled in 3). Data presented as box plots display the minimum, first quartile, median, third quartile, and maximum.
Extended Data Fig. 3
Extended Data Fig. 3. Bacterial species altered by stress and restored by FVT and predicted host taxa of FVT inocula.
(a) Differentially abundant bacterial species affected by stress and restored by FVT before (Pre) and after (Post) study compared by a linear mixed effects model followed by. Storey’s FDR testing (Ctr n = 10, Ctr Stress n = 8, FVT Stress n = 9). (b–d) Predicted phage hosts of FVT inocula at phyla (b), order (c), and family levels (d) (FVT Stress n = 9). Data presented as box plots display the minimum, first quartile, median, third quartile, and maximum.
Extended Data Fig. 4
Extended Data Fig. 4. Diversity and community microbiome measures following chronic stress and FVT.
(a, b) Aitchison beta diversity distance, Shannon entropy, and Simpson index of bacteriome (a) and virome (b) (Ctr n = 10, Ctr Stress n = 8, FVT Stress n = 9). (c, d) Faecal bacteriome (c) and FVT inocula and faecal virome (d) community profiles (Ctr n = 10, Ctr Stress n = 8, FVT Stress n = 9). Data presented as box plots display the minimum, first quartile, median, third quartile, and maximum.
Extended Data Fig. 5
Extended Data Fig. 5. Phage-host network.
Bacteriophage and bacterial abundance significant associations (q < 0.1). Phage-host pair associations that have a significant restoration effect are fully opaque (P < 0.05). Data was compared using two-sided linear models followed by Benjamini & Hochberg’s procedure for FDR and Pearson′s correlation coefficient to plot the phage-host pairs.
Extended Data Fig. 6
Extended Data Fig. 6. FVT inocula gut-brain and gut-metabolic modules.
Faecal virome transplant (FVT) inocula were assessed for gut- brain module (GBM) and gut-metabolic module (GMM) functional carriage. (a) The GBMs found in the FVT inocula were dopamine synthesis, quinolinic acid degradation, and S- adenosylmethionine (SAM) synthesis. (b) The GMMs found in the FVT inocula were arabinoxylan degradation, homoacetogenesis, methionine degradation I, mucin degradation, pectin degradation I, starch degradation, and sulfate reduction (dissimilatory).
Extended Data Fig. 7
Extended Data Fig. 7. Immune cell flow cytometry gating strategy.
A panel of whole blood markers was used to assess circulating immune cell populations on the FACSCelesta. This approach enabled initial gating for singlets, followed by the selection of the peripheral blood mononuclear cells, and live cells (using FVS780). Neutrophils were selected based on LY6G+ (PerCP- Vio700-conjugated) and CD11b+ (FITC-conjugated). Monocytes were selected as being Ly6G−, CD11b+ and LY6Chi (APC-conjugated), after which CD62L+ cells (Pe-Cy7- conjugated) were quantified.

References

    1. Kessler RC, et al. Lifetime prevalence and age-of-onset distributions of DSM-IV disorders in the National Comorbidity Survey Replication. Arch. Gen. Psychiatry. 2005;62:593–602. doi: 10.1001/archpsyc.62.6.593. - DOI - PubMed
    1. Collaborators GMD. Global, regional, and national burden of 12 mental disorders in 204 countries and territories, 1990–2019: a systematic analysis for the Global Burden of Disease Study 2019. Lancet Psychiatry. 2022;9:137–150. doi: 10.1016/S2215-0366(21)00395-3. - DOI - PMC - PubMed
    1. Kessler RC, Petukhova M, Sampson NA, Zaslavsky AM, Wittchen HU. Twelve‐month and lifetime prevalence and lifetime morbid risk of anxiety and mood disorders in the United States. Int. J. Methods Psychiatr. Res. 2012;21:169–184. doi: 10.1002/mpr.1359. - DOI - PMC - PubMed
    1. Menard C, et al. Social stress induces neurovascular pathology promoting depression. Nat. Neurosci. 2017;20:1752–1760. doi: 10.1038/s41593-017-0010-3. - DOI - PMC - PubMed
    1. Cryan, J. F. et al. The microbiota–gut–brain axis. Physiol. Rev.99, 1877–2013 (2019). - PubMed

Substances