. 2024 Mar;26(3):366-377.
doi: 10.1038/s41556-024-01348-4. Epub 2024 Feb 5.

A metabolite sensor subunit of the Atg1/ULK complex regulates selective autophagy

Affiliations

A metabolite sensor subunit of the Atg1/ULK complex regulates selective autophagy

A S Gross et al. Nat Cell Biol. 2024 Mar.

Abstract

Cells convert complex metabolic information into stress-adapted autophagy responses. Canonically, multilayered protein kinase networks converge on the conserved Atg1/ULK kinase complex (AKC) to induce non-selective and selective forms of autophagy in response to metabolic changes. Here we show that, upon phosphate starvation, the metabolite sensor Pho81 interacts with the adaptor subunit Atg11 at the AKC via an Atg11/FIP200 interaction motif to modulate pexophagy by virtue of its conserved phospho-metabolite sensing SPX domain. Notably, core AKC components Atg13 and Atg17 are dispensable for phosphate starvation-induced autophagy revealing significant compositional and functional plasticity of the AKC. Our data indicate that, instead of functioning as a selective autophagy receptor, Pho81 compensates for partially inactive Atg13 by promoting Atg11 phosphorylation by Atg1 critical for pexophagy during phosphate starvation. Our work shows Atg11/FIP200 adaptor subunits bind not only selective autophagy receptors but also modulator subunits that convey metabolic information directly to the AKC for autophagy regulation.


Conflict of interest statement

The authors declare no competing interests.

Figures
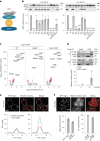
Fig. 1
Fig. 1. Pho81 binds to the AKC via Atg11 during P-S.
a, Schematics of the AKC. b, 2GFP–Atg8 turnover in indicated strains after P-S or N-S (24 h). Cells were analysed by whole cell extraction and western blot analysis using an α-GFP antibody. Data are mean ± s.d. (n = 4 biologically independent experiments). c, Fold changes (FC) in protein abundance relative to negative control after CoIP–MS of indicated 3GFP-tagged proteins after P-S (8 h). Significantly enriched proteins are shown in red (n = 4 biologically independent experiments). d, CoIP after GFP pulldown from cells harbouring plasmid-encoded GFP–ATG11 and PHO81–mCherry during growth (0 h) or P-S (24 h). Quantifications show relative levels of Pho81–mCherry over GFP and GFP–Atg11 normalized to 0 h Pho81–mCherry/GFP–Atg11. Asterisk indicates an unspecific band. Samples were derived from the same experiment and processed in parallel. Data are mean ± s.d. (n = 4 biologically independent experiments). e, Fluorescence imaging of cells expressing plasmid encoded GFP–ATG11 (cyan) and PHO81–mCherry (red) after P-S (4 h). Intensity plots along yellow lines show grey values for indicated proteins. Data are representative of three biologically independent experiments. Scale bar, 5 µm. f, Fluorescence imaging of cells expressing plasmid encoded PHO81–mCherry under ADH1 promoter (OE) and GFP–ATG11 under its endogenous promoter after P-S (4 h). Scale bar, 5 µm. Quantification of Pho81–mCherry and GFP–Atg11 puncta per cell (left) and the respective co-localization (right). Data are mean ± s.d. (n = 100 cells examined over three independent experiments). Statistical significance was assessed using one-way ANOVA followed by Tukey’s multiple comparisons test. P values relative to WT: ∆atg11 *P = 0.0165; ∆atg17 *P = 0.0203; ***P < 0.0001, except ∆atg13∆atg17∆atg29∆atg31 P = 0.0002 (b), two-sided statistical testing with adjustment for multiple testing within a comparison performed using limma, (c) and two-way ANOVA followed by Tukey’s multiple comparisons test (d). P values relative to 0 h Pho81–mCherry/GFP–Atg11: **P = 0.0049. Source numerical data and unprocessed blots are available in Source data. Source data
Fig. 2
Fig. 2. Pho81 positively regulates pexophagy during P-S.
a,b, Whole cell TMT proteomics analysis of indicated strains compared with WT after P-S (24 h) (n = 3 biologically independent experiments): significant proteome changes in ∆atg1 and ∆atg11 cells compared with WT, where volcano plots show significant fold changes (FC) above horizontal dotted line and top 20 proteins with the highest adjusted P value are labelled (a); significant proteome changes in ∆pho81, ∆atg11 and ∆atg11∆pho81 cells compared with WT (b). c, 2GFP–Atg8, Om45–GFP or Pex11–GFP turnover in WT and ∆pho81 cells upon P-S (24 h). Data are mean ± s.d. (n = 6 biologically independent experiments). d,e, Pex11–GFP turnover in indicated strains after P-S (24 h). Data are mean ± s.d. (d, n = 11; e, n = 3 biologically independent experiments). f, Fluorescence imaging of indicated strains expressing PEX11–GFP after P-S (0 and 24 h). Images represent maximum intensity Z-stack projections. Right: quantification of peroxisomes per cell. Box-and-whiskers plots: the boxes extend from the 25th to the 75th percentile spanning the IQR, whiskers show minimal and maximal values, black line in the middle of the boxes represents the median (n = 100 cells examined over four independent experiments). g, Fluorescence imaging of indicated strains expressing genomic PHO81–GFP and pRS315–BFPeSKL to visualize peroxisomes during growth and after P-S (4 h). Arrowheads indicate Pho81–GFP positive (white) or negative (purple) peroxisomes. Data are representative of three biologically independent experiments. Scale bars, 5 µm (f and g). Statistical significance was assessed using two-sided statistical testing with adjustment for multiple testing within a comparison performed using limma (a and b), two-tailed t-test **P = 0.0005 (c), one-way ANOVA followed by Tukey’s multiple comparisons test, P values relative to WT: **P = 0.0033; ***P < 0.001 (d and e), and two-way ANOVA followed by Šídák’s multiple comparisons test, P values relative to WT: ***P < 0.0001 (24 h); P values 24 versus 0 h timepoints: #, P = 0.0319; ##, P = 0.0014; ###, P < 0.0001 (f). Source numerical data and unprocessed blots are available in Source data. Source data
Fig. 3
Fig. 3. Pho81 functionally interacts with Atg13 and Atg17 during pexophagy upon P-S.
a, Y2H assay of cells expressing pGAD-PHO81 or pGAD-ATG36 in combination with pGBDU (empty vector, ev), pGBDU-ATG8 or pGBDU-ATG11 grown on SD + HIS or SD − HIS medium. bd, Pex11–GFP turnover in indicated strains after P-S (24 h) (b, n = 3–6; c, n = 9 biologically independent experiments) or after N-S (24 h) (n = 4 biologically independent experiments) (d). Data are mean ± s.d. e, 2GFP–Atg8 turnover in indicated strains after P-S (24 h). Data are mean ± s.d. (n = 6 biologically independent experiments). f, 2GFP turnover in indicated strains after P-S (24 h). Data are mean ± s.d. (n = 3 biologically independent experiments). g, Fluorescence imaging of WT cells expressing genomic PHO81–GFP and ATG13–mCherry after P-S (4 h). Arrowheads indicate Pho81–GFP positive (white) or negative (purple) Atg13 foci. Scale bar, 5 µm. Quantification of Atg13–mCherry and Pho81–GFP co-localization in WT cells. Data are mean ± s.d. (n = 150 cells examined over three independent experiments). h, Fluorescence imaging of indicated strains expressing genomic PHO81–GFP and ATG1–mCherry after P-S (4 h). Arrowheads indicate Pho81–GFP-positive (white) or Pho81–GFP-negative (purple) Atg1 puncta. Scale bar, 5 µm. Quantification of Atg1–mCherry and Pho81–GFP co-localization in WT and ∆atg13 cells. Data are mean ± s.d. (n = 300 cells examined over three independent experiments). Statistical significance was assessed using one-way ANOVA followed by Tukey’s multiple comparisons test. P values relative to WT or as indicated: ***P < 0.0001 except *P = 0.0494 (d) and P values relative to ∆pho81 ###, P < 0.0001 (bf). Two-way ANOVA followed by Tukey’s multiple comparisons test. P values relative to WT or as indicated: ***P = 0.0002 (g), **P = 0.0078 (h), non-significant (n.s.). Source numerical data and unprocessed blots are available in Source data. Source data
Fig. 4
Fig. 4. Atg13 phosphorylation by TORC1 determines dependence of pexophagy on Pho81 during P-S.
a, Principal component analysis of phosphoproteomics data for WT and indicated cells upon P-S (red) and N-S (blue) after 8 h. b, Significantly changed phosphosites during P-S and N-S (grey), WT and ∆pho81 after P-S (red), or WT and ∆atg13 after N-S (blue) after 8 h. c, Phosphorylation of representative TORC1 kinase and Atg1 kinase sites in indicated cells upon P-S and N-S (8 h). Data in ac are derived from four biologically independent experiments. d, Phosphorylation of endogenous Atg13 in WT and ∆pho81 cells during P-S ± rapamycin or N-S at indicated timepoints. Samples were analysed by whole cell extraction and western blot using an α-Atg13 antibody (n = 3 biologically independent experiments). e, Pex11–GFP turnover in indicated strains after P-S (24 h) ± rapamycin. Data are mean ± s.d. (n = 4 biologically independent experiments). f, Pex11–GFP turnover in indicated strains after P-S (24 h). Data are mean ± s.d. (n = 4 biologically independent experiments). Statistical significance was assessed using two-way ANOVA followed by Tukey’s multiple comparisons test. P values relative to WT-rapa or as indicated *P = 0.0494, **P = 0.0014, ∆pho81 − versus + rapa ***P = 0.0006, ∆atg11 + rapa versus WT − rapa ***P = 0.0004 (e) and one-way ANOVA followed by Tukey’s multiple comparisons test, P values relative to WT, ***P ≤ 0.0002 (f), non-significant (n.s.). Source numerical data and unprocessed blots are available in Source data. Source data
Fig. 5
Fig. 5. Pho81 interacts with Atg11 via an Atg11/FIP200 interaction motif to promote phosphorylation of Atg11 required for pexophagy.
a, Schematics of Pho81 and ankyrin repeat variants; Pho81A (Pho81 ankyrin repeat replaced by Ankyrin repeat of Akr1); Pho81LA1 to Pho81LA4 (Pho81 ankyrin repeat loops 1 to 4 replaced by corresponding loop of Akr1 Ankyrin repeat loops 1 to 4). b, Y2H of cells expressing indicated pGAD-PHO81 variants and pGBDU-empty vector (−) or ATG11 were grown on SD + HIS or SD − HIS medium. c, Consensus motif of Atg11/FIP200 interaction region with homology logo (WebLogo 3.0). based on alignment of indicated Atg11/FIP200 interaction regions and corresponding amino acid probability. Sc, Saccharomyces cerevisiae; Pp, Pichia pastoris; Hs, Homo sapiens. d, Schematics of Pho81DD, Pho81T and Pho81DE. e, Y2H of cells expressing indicated pGAD-PHO81 variants and pGBDU-empty vector (−) or ATG11 were grown on SD + HIS or SD − HIS medium. f, Enrichment of AKC subunits after GFP–Atg11-based CoIP–MS from Δpho81 cells expressing plasmid-encoded PHO81–mCherry or pho81DD–mCherry. Control is GFP. Data are mean ± s.d. (n = 3–4 biologically independent experiments). Statistical analysis is presented in Supplementary Table 2. FC, fold change. g,h, Pex11–GFP turnover in indicated strains harboring empty vector (ev) or expressing plasmid-encoded PHO81 variants after P-S (24 h). Data are mean ± s.d. (g, n = 9; h, n = 4 biologically independent experiments). i, Atg11 peptides containing S121, S613 or S935 identified upon phospho-proteomic analysis of data shown in f and volcano plot of identified phosphosites with significant enrichment in red. j, Pex11–GFP turnover in Δatg11 or Δatg11Δpho81 cells harboring ev or expressing plasmid-encoded ATG11 or atg113SA (S121A, S613A, S935A) after P-S (24 h). Data are mean ± s.d. (n = 6 biologically independent experiments). In g, h and j, statistical significance was assessed using one-way ANOVA followed by Tukey’s multiple comparisons test. P values relative to WT (ev, *) or PHO81 expressing ∆pho81 cells (#) (g and h) or ATG11. P values *** or ###, P < 0.0001 except *P = 0.0492 (h) and **P = 0.0037 (j), non-significant (n.s.). Source numerical data and unprocessed blots are available in Source data. Source data
Fig. 6
Fig. 6. SPX domain-dependent phospho-metabolite sensing by Pho81 regulates pexophagy.
a, Schematics of the Pho81 SPX domain variants; Pho81∆SPX (C-terminus 173–1,178); Pho81YKK: Y24A, K28A and K154A indicate mutated residues involved in inositol phosphate sensing. b, Sequence alignment of SPX domain containing proteins from Sc, Saccharomyces cerevisiae; At, Arabidopsis thaliana; Mm, Mus musculus; Hs, Homo sapiens. c, Enrichment of AKC subunits after GFP–Atg11-based CoIP–MS from cells expressing plasmid-encoded PHO81–, pho81YKK or pho81∆SPX–mCherry. Control is GFP. n = 4 biologically independent experiments. Statistical analysis is presented in Supplementary Table 2. FC, fold change. d, Pex11–GFP turnover in strains harboring empty vector (ev) or expressing indicated plasmid-encoded PHO81 variants in the respective PEX11–GFP-expressing deletion cells upon 24 h of P-S. Data are mean ± s.d. (n = 4 biologically independent experiments). e, Fluorescence imaging of cells expressing genomic PHO81–GFP variants and ATG1–mCherry during growth (0 h) and PS (4 h). Arrows indicate Pho81–GFP positive (white) or negative (purple) Atg1–mCherry foci. Data are representative of three biologically independent experiments. Scale bar, 2 µm. f, Y2H of cells expressing pGAD-PHO81 or indicated variants in combination with pGBDU-empty vector (−) or pGBDU-ATG11 grown on +HIS, −HIS, −ADE selection plates. g, Pex11-GFP turnover in cells harboring ev (−) or expressing PHO81 under an ADH1 promoter (OE) and PEX11–GFP upon 24 h P-S. Data are mean ± s.d. (n = 3 biologically independent experiments). h, 2GFP–Atg8 turnover in indicated strains harboring ev (−) or expressing PHO81 under an ADH1 promoter (OE) after P-S (24 h). Data are mean ± s.d. (n = 3 biologically independent experiments). i, Pex11–GFP turnover in WT and ∆pho81 cells after P-S (24 h) ± InsP6. Data are mean ± s.d. (n = 3 biologically independent experiments). j, Pex11–GFP turnover in cells harbouring pRS315 or pRS315–prADH1–KCS1 (OE) after P-S (24 h). Data are mean ± s.d. (n = 4 biologically independent experiments). Statistical significance was assessed using one-way ANOVA followed by Tukey’s multiple comparisons test (d and i), two-tailed t-test (g and j) and two-way ANOVA followed by Tukey’s multiple comparisons test (h); P values are relative to WT (gj), Δatg13 cells (d) or as indicated: ***P < 0.0001 except *P = 0.0096 and **P = 0.0018 (i) and **P = 0.0018 (j). Source numerical data and unprocessed blots are available in Source data. Source data
Extended Data Fig. 1
Extended Data Fig. 1. Additional analysis of Pho81 in autophagy during P-S.
a, Fluorescence imaging of strains co-expressing plasmid encoded PHO81-mCherry under ADH1 promoter and genomic 2GFP-ATG8 upon phosphate starvation (4 h). Scale bar = 5 µm. Quantification of Pho81-mCherry puncta and co-localization with 2GFP-Atg8. Data are means ± SD (n = 100 cells examined over 5 independent experiments). b, Y2H of cells harboring pGAD (ev) or pGAD-PHO81 and pGBDU-ATG11 in WT (pJ69-4a) or ∆atg36 cells grown on SD + HIS or SD-HIS media. c, Fluorescence imaging of strains expressing plasmid-encoded PHO81-mCherry variants under ADH1 promoter during growth. Scale bar = 5 µm. Quantification of Pho81-mCherry puncta per cell. Data are means ± SD (n = 125 cells examined over 5 independent experiments). d, Pex11-GFP turnover in cells expressing indicated plasmid-encoded PHO81 variants in Δpho4 or Δpho4Δpho81 cells after phosphate starvation (24 h). Data are normalized to the empty vector control in Δpho4 cells and are means ± SD (n = 6 biologically independent experiments). Statistical significance was assessed using one-way ANOVA followed by Tukey’s multiple comparison test. P-values are relative to WT (c), ev control in Δpho4, or as indicated: *, p < 0.05; **, p < 0.01; ***, p < 0.001. Source numerical data and unprocessed blots are available in source data. Source data

Comment in

Similar articles

Cited by

References

    1. Kamada Y, et al. Tor-mediated induction of autophagy via an Apg1 protein kinase complex. J. Cell Biol. 2000;150:1507–1513. doi: 10.1083/jcb.150.6.1507. - DOI - PMC - PubMed
    1. Kawamata T, Kamada Y, Kabeya Y, Sekito T, Ohsumi Y. Organization of the pre-autophagosomal structure responsible for autophagosome formation. Mol. Biol. Cell. 2008;19:2039–2050. doi: 10.1091/mbc.e07-10-1048. - DOI - PMC - PubMed
    1. Kabeya Y, et al. Atg17 functions in cooperation with Atg1 and Atg13 in yeast autophagy. Mol. Biol. Cell. 2005;16:2544–2553. doi: 10.1091/mbc.e04-08-0669. - DOI - PMC - PubMed
    1. Matsuura A, Tsukada M, Wada Y, Ohsumi Y. Apg1p, a novel protein kinase required for the autophagic process in Saccharomyces cerevisiae. Gene. 1997;192:245–250. doi: 10.1016/S0378-1119(97)00084-X. - DOI - PubMed
    1. Suzuki K, et al. The pre-autophagosomal structure organized by concerted functions of APG genes is essential for autophagosome formation. EMBO J. 2001;20:5971–5981. doi: 10.1093/emboj/20.21.5971. - DOI - PMC - PubMed

Publication types

MeSH terms