. 2024 Mar;43(5):780-805.
doi: 10.1038/s44318-024-00040-5. Epub 2024 Feb 5.

Sterile inflammation via TRPM8 RNA-dependent TLR3-NF-kB/IRF3 activation promotes antitumor immunity in prostate cancer

Affiliations

Sterile inflammation via TRPM8 RNA-dependent TLR3-NF-kB/IRF3 activation promotes antitumor immunity in prostate cancer

Alessandro Alaimo et al. EMBO J. 2024 Mar.

Abstract

Inflammation is a common condition of prostate tissue, whose impact on carcinogenesis is highly debated. Microbial colonization is a well-documented cause of a small percentage of prostatitis cases, but it remains unclear what underlies the majority of sterile inflammation reported. Here, androgen- independent fluctuations of PSA expression in prostate cells have lead us to identify a prominent function of the Transient Receptor Potential Cation Channel Subfamily M Member 8 (TRPM8) gene in sterile inflammation. Prostate cells secret TRPM8 RNA into extracellular vesicles (EVs), which primes TLR3/NF-kB-mediated inflammatory signaling after EV endocytosis by epithelial cancer cells. Furthermore, prostate cancer xenografts expressing a translation-defective form of TRPM8 RNA contain less collagen type I in the extracellular matrix, significantly more infiltrating NK cells, and larger necrotic areas as compared to control xenografts. These findings imply sustained, androgen-independent expression of TRPM8 constitutes as a promoter of anticancer innate immunity, which may constitute a clinically relevant condition affecting prostate cancer prognosis.

Keywords: Immunity; Inflammation; PSA; Prostate; TRP.


Conflict of interest statement

The authors declare no competing interests.

Figures
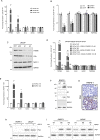
Figure 1
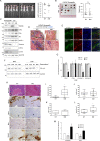
Figure 1. TRPM8 affects PSA levels independently from AR activity in prostate cells.
(A) RT-qPCR analysis of TRPM8, and AR transcriptional targeted genes KLK3, KLK2, NKX3.1, TMPRSS2 in wild type (WT) and genetically modified (TRPM8 overexpression, M8; TRPM8 knock-out, Crisper/CAS9 hereafter CAS) LNCaP cells. (B,C) RT-qPCR (B) and Western blotting (C) of LNCaP cells transfected with non-targeting (siCTR) or TRPM8 targeting (siRNA1 and siRNA2) small interfering RNA molecules. (D) RT-qPCR analysis of wild type (WT) and genetically engineered (M8 and CAS) LNCaP cells cultured in steroid-stripped charcoal serum and treated with 100 nM Enzalutamide for 48 h. (E,F) RT-qPCR (E) and immunoblot (F) analyses showing expression of TRPM8, KLK3 (PSA) and the indicated genes in RWPE-1 wild type (WT) and RWPE-1 stably overexpressing TRPM8 (M8). (G) Immunohistochemistry of PSA on paraffin embedded RWPE-1 WT and RWPE-1 M8 cell pellets. Scale bar, 50 μm. (H,I) Immunoblotting analysis showing expression of PSA in RWPE-1 and LNCaP cells treated or not with WS-12 (TRPM8 agonist, 1 μM, 12 h, (H)) and treated or not with AMTB (TRPM8 antagonist, 10 μM, 24 h, (I)). GAPDH was used as loading control. Data Information: In (A,B and D,E) data are presented as mean ± SD of n = 4 (A,B,E) and n = 3 (D) independent biological replicates. *P ≤ 0.05; **P ≤ 0.01; ***P ≤ 0.001; ns, not statistically significant (Two-tailed Student’s t-test). Source data are available online for this figure.
Figure 2
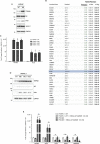
Figure 2. TRPM8 RNA increases KLK3 RNA and PSA amount.
(A) Sequences alignment of wild type (WT) and translationally defective mutant (MM) TRPM8. (B) End-point PCR analysis showing the stability of full-length TRPM8 MM RNA in both LNCaP and RWPE-1. Expression of endogenous TRPM8 RNA (WT) was used as reference. (C) ddPCR quantification of TRPM8 gene expression in WT and MM. Concentration of TRPM8 and ACTB. (left panel) and total number of TRPM8 copies normalized to total number of ACTB copies (right panel). (D) RT-qPCR analysis of TRPM8, KLK3 and other known AR-targeted genes in both wild type (WT) and genetically engineered (CAS and MM) LNCaP cell lines. (E) Western blotting analysis of TRPM8, PSA, KLK2, and NKX3.1 in both wild type (WT) and genetically engineered (CAS and MM) LNCaP and RWPE-1 cell lines. GAPDH was used as loading control. (F) PSA amount (ng/ml) in the indicated cell-conditioned culture medium. (G,H) Immunoblot analysis of NF-kB p65 in cytosolic and nuclear fractions of CAS, WT, M8, and MM engineered LNCaP (G) and RWPE-1 (H) cell lines. β-Tubulin (β-TUB) and Fibrillarin (FBL) were used as cytoplasmic and nuclear markers, respectively. (I) Immunolocalization of NF-kB in wild type (WT) and MM RWPE-1cells. Scale bare 10 μm. (L) Schematic representation of TRPM8 RNA mediated activation of NF-kB/IRF3 response (Created with BioRender.com). Data Information: In (C,D) data are presented as mean ± SD of n = 3 (C) and n = 4 (D) independent biological replicates. In (F) data are presented as results of a single experiment. **P ≤ 0.01; ***P ≤ 0.001 (Two-tailed Student’s t-test). Source data are available online for this figure.
Figure 3
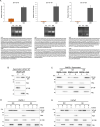
Figure 3. EVs secreted TRPM8 RNA triggers NF-kB activation via TLR3 signaling.
(A) Relative amount of TRPM8 RNA carried by extracellular vesicles harvested from the supernatants of the indicated cell lines. TRPM8 not expressing (PC-3) and knocked-out (LNCaP CAS) prostate cancer cell lines were used as negative controls. (B) RNA-seq analysis of isolated extracellular vesicles (EVs) circulating in the blood of healthy donors (HD, n = 16) and PCa patients (PCa, n = 27) demonstrating the presence of TRPM8 RNA in EVs isolated from the blood of PCa patients. (C) Schematic representation of the TRPM8 RNA/TLR3 molecular circuit triggering sterile inflammation (Created with BioRender.com). (D) Nucleus/Cytosol fractionation and Western blot analysis of NF-kB p65 and PSA in LNCaP CAS cells conditioned with the supernatants of LNCaP (CAS, M8, and MM). β-Tubulin (β-TUB) and Fibrillarin (FBL) were used as markers of the cytosolic and nuclear fractions, respectively. (E) Nucleus/Cytosol fractionation and Western blot analysis of NF-kB p65 in LNCaP CAS cells conditioned with EVs and the EVs-depleted supernatants (SN-EVs) of LNCaP (CAS, WT, and MM). β-Tubulin (β-TUB) and Fibrillarin (FBL) were used as markers of the cytosolic and nuclear fractions, respectively. (F) Nucleus/Cytosol fractionation and Western blot analysis of NF-kB p65 and PSA in LNCaP MM and M8 cell lines in the presence or absence of TLR3/dsRNA Complex Inhibitor (TLR3 inhibitor; 20 μM, 24 h). β-Tubulin (β-TUB) and Fibrillarin (FBL) were used as markers of the cytosolic and nuclear fractions, respectively. (G) Nucleus/Cytosol fractionation and Western blot analysis of NF-kB p65 in LNCaP MM cells in the presence of TLR3 Inhibitor (20 μM, 24 h), TLR7/8 inhibitor M5049 (1 μM, 6 h), or the combination of RIG1 inhibitor RIG012 (2 μM, 6 h) and PKR inhibitor C16 (2 μM, 6 h). Untreated LNCaP MM cells served as positive control for NF-kB nuclear localization. β-Tubulin (β-TUB) and Fibrillarin (FBL) were used as markers of the cytosolic and nuclear fractions, respectively. (H) Western blot analysis of TLR3 immunoprecipitation from LNCaP under native and formalin fixed (0.1% f.c., 10 min) conditions. Input line shows 10% of total protein extract. (I,J) PCR analysis of total (I) and TLR3-bound (J) TRPM8 transcript in LNCaP MM, WT and CAS cell lines with sets of primers spanning different exons (Ex) of the coding sequence of TRPM8 RNA. Data Information: In (A) data are presented as results of a single experiment (replicates are presented in Fig. EV3A). In (B) box-plots elements indicate the median (center line), upper and lower quartiles (box limits). Whiskers extend to the most extreme value included in 1.5 × interquartile range. (Two-sided Wilcoxon rank-sum test). Source data are available online for this figure.
Figure 4
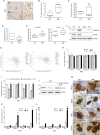
Figure 4. TRPM8/TLR3 inflammation promotes Natural Killer cells infiltration and tumor necrosis.
(A) Images showing in vivo bioluminescence quantification of subcutaneous xenografts obtained with LNCaP WT luc (n = 10) and LNCaP MM luc (n = 7) 8 weeks after cells injection. (B) Images (left) and weight (right) of LNCaP WT luc- and LNCaP MM luc-derived xenografts 8 weeks after cells injection. (C) Western blot analysis of proteins extracted from FFPE sections of LNCaP WT and LNCaP MM xenografts and in vitro cultured LNCaP WT and LNCaP MM cell lines. β-Actin was used as loading control. (D) Trichrome staining showing lower deposition of collagen (blue staining) in xenografts generated by LNCaP MM cells (n = 3) compared to those obtained with LNCaP WT (n = 3). Scale bars, 100 μm. (E) Immunofluorescence analysis of alpha-Smooth muscle actin (α-Sma) and Vimentin in FFPE sections of LNCaP WT and LNCaP MM xenograft. Scale bars, 100 μm. (F) Immunoblotting analysis of COL1A1 in NAF and CAF cells derived from human prostate tissues and conditioned with the supernatants of both LNCaP (CAS, WT, MM) and RWPE-1 (CAS, WT, MM) cell lines, respectively. GAPDH was used as loading control. (G) RT-qPCR analysis of the indicated genes of the metabolism of type I collagen in CAF cells. (H) Cytochemistry and immunohistochemistry analyses of LNCaP WT and MM xenografts. Representative images of hematoxylin and eosin (H&E) staining (necrosis) and IHC analyses for MHCII, CD45R (B220), IBA1 and NKp46 in tissue sections from PDXs. Scale bars, 200 μm. (I,L) Quantitation of necrotic areas and immune cells infiltrate in multiple sections of LNCaP WT (n = 3) and LNCaP MM (n = 3) xenografts. (M) RT-qPCR analysis of NCR3LG1 and BG6, two known ligands of NKp46 receptor, in LNCaP WT, CAS and MM cell lines. Data Information: In (A,B) data are presented as mean ± SD. Not statistically significant (ns). (Student’s t-test). In (G,M) data are presented as mean ± SD of n = 3 independent biological replicates. *P ≤ 0.05; **P ≤ 0.01; ***P ≤ 0.001. (Two-tailed Student’s t-test). In (IL) box-plots elements indicate the median (center line), upper and lower quartiles (box limits). Whiskers extend from the minimum to the maximum. *P ≤ 0.05 (Student’s t-test). Source data are available online for this figure.
Figure 5
Figure 5. Sterile inflammation and cancer immunity.
Molecular and cellular consequences of sterile inflammation triggered by TRPM8 RNA in the prostate cancer microenvironment (Created with BioRender.com).
Figure EV1
Figure EV1. TRPM8 favors KLK3 expression in prostate cells.
(A) Immunoblot analysis showing expression of TRPM8, PSA and the other indicated proteins in LNCaP wild type (WT) and stably overexpressing TRPM8 (M8). GAPDH was used as loading control. (B) List of genes ranked by correlation coefficient whose expression in cancer correlates with TRPM8 expression (TCGA, cBioportal). (C,D) RT-qPCR (C) and Western blot (D) analyses of TRPM8 and KLK3 (PSA) expression in RWPE-1 wild type (WT) and in three independent clones of RWPE-1 stably overexpressing TRPM8 (M8.1; M8.2; M8.3). GAPDH was analyzed after stripping of the primary and secondary antibodies used for PSA. (E) RT-qPCR analysis of RWPE-1 and RWPE-1 M8 cells treated with 100 nM Enzalutamide for 48 h. The Ct values associated with KLK3 expression in RWPE-1 (34.33, 34.56, 34.72) confirmed the negligible expression of KLK3 gene in these cells. Data Information: In (C,E) data are presented as mean ± SD of n = 3 independent biological replicates. *P ≤ 0.05; **P ≤ 0.01; ***P ≤ 0.001; ns, not statistically significant (Two-tailed Student’s t-test). Source data are available online for this figure.
Figure EV2
Figure EV2. Pro-inflammatory activity of the mutant non-coding RNA of TRPM8.
(A,B) End-point PCR (A) and Western blot analysis (B) of TRPM8 in LNCaP (WT), RWPE-1 (WT) and PC-3 (WT and MM) cell lines. GAPDH was used as loading control. (C) Immunoblotting analysis of TRPM8 protein with the Alomone (#ACC-049) antibody in wild type and genetically modified (M8, CAS, MM) LNCaP and RWPE-1 cell lines. (D) RT-qPCR analysis of TRPM8, KLK3 and TMPRSS2 genes in both wild type (WT) and genetically engineered (MM, two independent clones) LNCaP cell lines expressing reduced levels of TRPM8 RNA compared to clones described in Fig. 1C. (E) Immunoblot analysis of NF-kB p65 in cytosolic and nuclear fractions of CAS, WT, and MM (described in D) engineered LNCaP cell lines. β-Tubulin (β-TUB) and Fibrillarin (FBL) were used as cytoplasmic and nuclear markers, respectively. (F,G) RT-qPCR analyses of canonical NF-kB and IRF3 targets genes in both LNCaP and RWPE-1 CAS and MM cells. Data Information: In (D,E,G,H) data are presented as mean ± SD of n = 4 (D), n = 2 (E), and n = 3 (G,H) independent biological replicates. *P ≤ 0.05; **P ≤ 0.01; ns, not statistically significant (Two-tailed Student’s t-test). Source data are available online for this figure.
Figure EV3
Figure EV3. TRPM8 RNA secretion modulates TLR3/TAK1 signal cascade.
(A) RT-qPCR analysis of TRPM8 transcript released by WT and MM LNCaP cells into extracellular vesicles (EVs). Specificity and sequence of amplicons obtained with sets of primers spanning different exons (Ex) of the coding sequence of TRPM8 RNA are shown. Y3 transcript was used to normalize the data. (B) Nucleus/Cytosol fractionation and Western blot analysis of NF-kB p65 and PSA in LNCaP CAS cells conditioned with the supernatants of LNCaP WT cells. β-Tubulin (β-TUB) and Fibrillarin (FBL) were used as markers of the cytosolic and nuclear fractions, respectively. (C) Nucleus/Cytosol fractionation and Western blot analysis of NF-kB p65 and PSA in RWPE-1 CAS cells conditioned with the supernatants of RWPE-1 (CAS, M8, and MM). β-Tubulin (β-TUB) and Fibrillarin (FBL) were used as markers of the cytosolic and nuclear fractions, respectively. (D,E) Nucleus/Cytosol fractionation and Western blot analysis of NF-kB p65 and PSA in RWPE-1 MM and M8 (D) and LNCaP MM and M8 (E) cell lines in the presence or absence of Takinib (TAK1 inhibitor; 10 μM, 24 h). β-Tubulin (β-TUB) and Fibrillarin (FBL) were used as markers of the cytosolic and nuclear fractions, respectively. Data Information: In (A) data are presented as mean ± SD of n = 3 biological replicates. Source data are available online for this figure.
Figure EV4
Figure EV4. Prediction of TRPM8 RNA structures highlights putative TLR3 binding motifs.
(A) TLRs expression in LNCaP and RWPE-1 prostate cell lines based on publicly available datasets. (B) In silico prediction of the secondary structure of human TRPM8 transcript. Highly stable dsRNA stems with bulge/internal loops are indicated in red. (C) Mountain plot of (B). (D) Nucleus/Cytosol fractionation and Western blot analysis of NF-kB p65 and PSA in RWPE-1 MM and M8 cell lines in the presence or absence of TLR3/dsRNA Complex Inhibitor (TLR3 inhibitor; 20 μM, 24 h). β-Tubulin (β-TUB) and Fibrillarin (FBL) were used as markers of the cytosolic and nuclear fractions, respectively. (E) Nucleus/Cytosol fractionation and Western blot analysis of NF-kB p65, c-Rel, phospho-p50, STAT1, IRF3 and PSA in LNCaP CAS cells conditioned with the supernatants of LNCaP MM cells. β-Tubulin (β-TUB) and Fibrillarin (FBL) were used as markers of the cytosolic and nuclear fractions, respectively. (F) Nucleus/Cytosol fractionation and Western blot analysis of NF-kB p65 in LNCaP CAS cells transfected with Poly(I:C) (2 μg/mL, 24 h) and treated or not with the the combination of the RIG1 inhibitor RIG012 (2 μM, 6 h) and the PKR inhibitor C16 (2 μM, 6 h). Untransfected and untreated LNCaP CAS cells served as control for the activation of NF-kB by Poly(I:C). β-Tubulin (β-TUB) and Fibrillarin (FBL) were used as markers of the cytosolic and nuclear fractions, respectively. (G) PCR analysis of TLR3-bound TRPM8 transcript (native RIP) in LNCaP WT cells treated or not with TLR3/dsRNA complex inhibitor. Sets of primers spanning different exons (Ex) of the coding sequence of TRPM8 RNA are shown. Data Information: In (A) the heatmap was plotted with the pheatmap package, scaling gene expression by row. All the analyses were done with R 4.0.3. Source data are available online for this figure.
Figure EV5
Figure EV5. TRPM8 RNA secretion alters fibroblasts functions.
(A,B) Immunolocalization of PSA in FFPE sections of LNCaP WT (n = 3 xenografts/5 sections) and MM (n = 2 xenografts/4 sections) tumors (A), coupled with the percentage of PSA+ cells (total number of cells counted: WT = 142.293; MM = 106.013) (B). (C) Quantification of total PSA (free and complexed) circulating in the plasma of xenografted mice (WT, n = 4; MM, n = 4). (D) Quantification of Collagen Type-I (percentage of blue area to total section area; n = 6 sections per genotype), relative to Fig. 4D. (E) Quantification of Vimentin and α-Sma in FFPE sections of LNCaP WT and LNCaP MM xenograft (a minimum of 5 different areas per genotype were analyzed), relative to Fig. 4E. (F) Western blot analysis of Vimentin and α-SMA proteins in NAF, CAF, LNCaP and PC-3 cell lines. GAPDH was used as loading control. (G) Inverse correlation in PCa of the expression of P3H3 (left panel) and COLGALT1 (right panel) with respect to TRPM8 (TCGA, cBioportal). (H) RT-qPCR analysis of the indicated genes of the metabolism of type I collagen in NAF cells. (I) RT-qPCR analysis of PH3, PH4, COLGALT1, and COLGALT2 genes expression in CAFs conditioned with the supernatant of LNCaP MM cells and treated or not with the TLR3 inhibitor (20 μM, 24 h). (J) Western blot analysis of COL1A1 levels in CAFs conditioned with the supernatant of LNCaP MM cells and treated or not with the TLR3 inhibitor (XX μM, 24 h). GAPDH was used as loading control. (K,L) RT-qPCR analysis of canonical NF-kB targets genes in NAF (K) and CAF (L) cells conditioned with the supernatants of LNCaP (CAS, WT, MM) cell lines. (M) Magnification images of MHCII, CD45R (B220), IBA1 and NKp46 immunolocalization in FFPE sections of LNCaP wild type (WT) and LNCaP MM xenografts. Scale bars, 20 μm. Data Information: In (BE) box-plots elements indicate the median (center line), upper and lower quartiles (box limits). Whiskers extend from the minimum to the maximum. *P ≤ 0.05; **P ≤ 0.01. (Student’s t-test). In (H,I,K,L) data are presented as mean ± SD of n = 3 independent biological replicates. *P ≤ 0.05; **P ≤ 0.01; ***P ≤ 0.001. (Two-tailed Student’s t-test). Source data are available online for this figure.

References

    1. Affo S, Nair A, Brundu F, Ravichandra A, Bhattacharjee S, Matsuda M, Chin L, Filliol A, Wen W, Song X, et al. Promotion of cholangiocarcinoma growth by diverse cancer-associated fibroblast subpopulations. Cancer Cell. 2021;39:883. doi: 10.1016/j.ccell.2021.05.010. - DOI - PMC - PubMed
    1. Alaimo A, Lorenzoni M, Ambrosino P, Bertossi A, Bisio A, Macchia A, Zoni E, Genovesi S, Cambuli F, Foletto V, et al. Calcium cytotoxicity sensitizes prostate cancer cells to standard-of-care treatments for locally advanced tumors. Cell Death Dis. 2020;11:1039. doi: 10.1038/s41419-020-03256-5. - DOI - PMC - PubMed
    1. Asuthkar S, Demirkhanyan L, Sun X, Elustondo PA, Krishnan V, Baskaran P, Velpula KK, Thyagarajan B, Pavlov EV, Zakharian E. The TRPM8 protein is a testosterone receptor. J Biol Chem. 2015;290:2670–2688. doi: 10.1074/jbc.M114.610873. - DOI - PMC - PubMed
    1. Axelrad JE, Lichtiger S, Yajnik V. Inflammatory bowel disease and cancer: The role of inflammation, immunosuppression, and cancer treatment. WJG. 2016;22:4794. doi: 10.3748/wjg.v22.i20.4794. - DOI - PMC - PubMed
    1. Bankhead P, Loughrey MB, Fernández JA, Dombrowski Y, McArt DG, Dunne PD, McQuaid S, Gray RT, Murray LJ, Coleman HG, et al. QuPath: Open source software for digital pathology image analysis. Sci Rep. 2017;7:16878. doi: 10.1038/s41598-017-17204-5. - DOI - PMC - PubMed