. 2024 Feb 5;25(1):143.
doi: 10.1186/s12864-024-10029-3.

The impact of selective HDAC inhibitors on the transcriptome of early mouse embryos

Affiliations

The impact of selective HDAC inhibitors on the transcriptome of early mouse embryos

Ruiqi Shao et al. BMC Genomics. .

Abstract

Background: Histone acetylation, which is regulated by histone acetyltransferases (HATs) and histone deacetylases (HDACs), plays a crucial role in the control of gene expression. HDAC inhibitors (HDACi) have shown potential in cancer therapy; however, the specific roles of HDACs in early embryos remain unclear. Moreover, although some pan-HDACi have been used to maintain cellular undifferentiated states in early embryos, the specific mechanisms underlying their effects remain unknown. Thus, there remains a significant knowledge gap regarding the application of selective HDACi in early embryos.

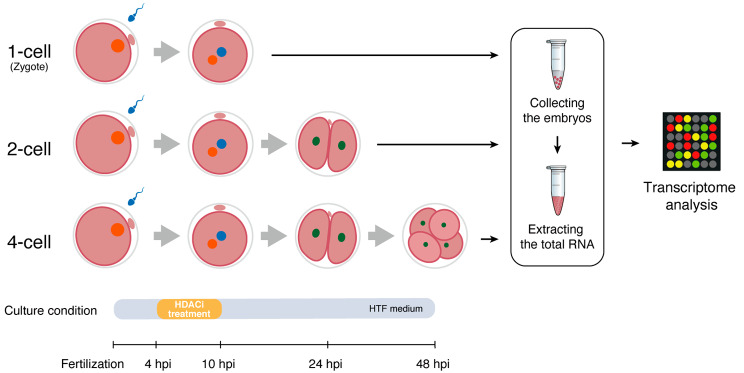
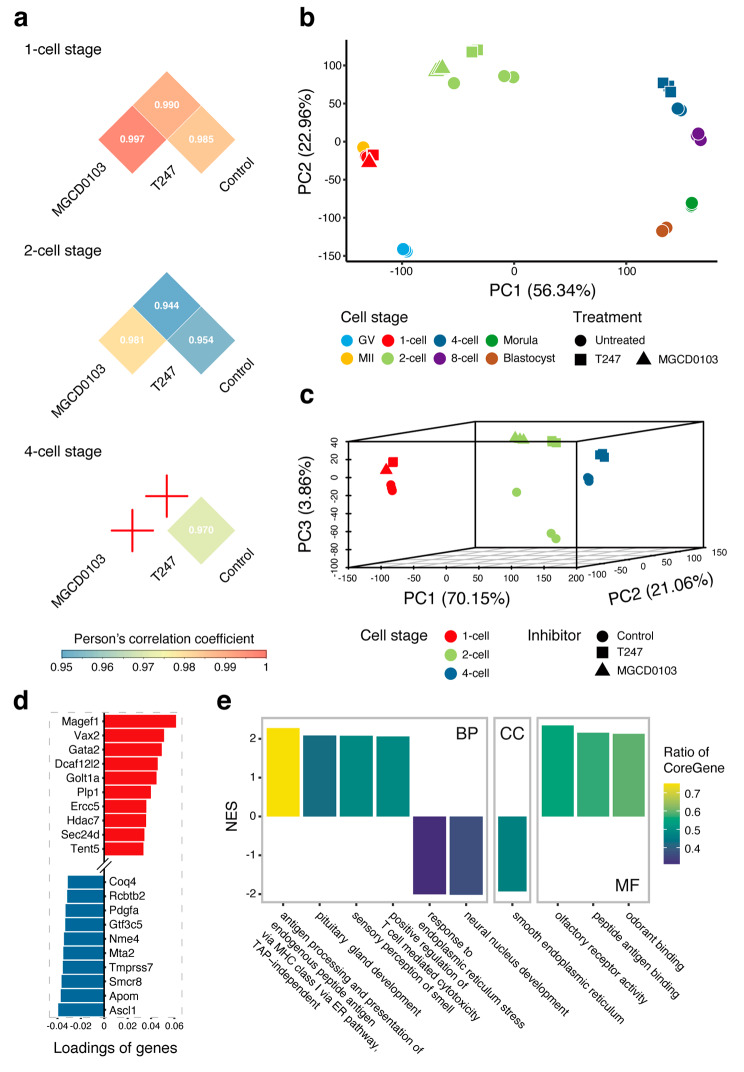
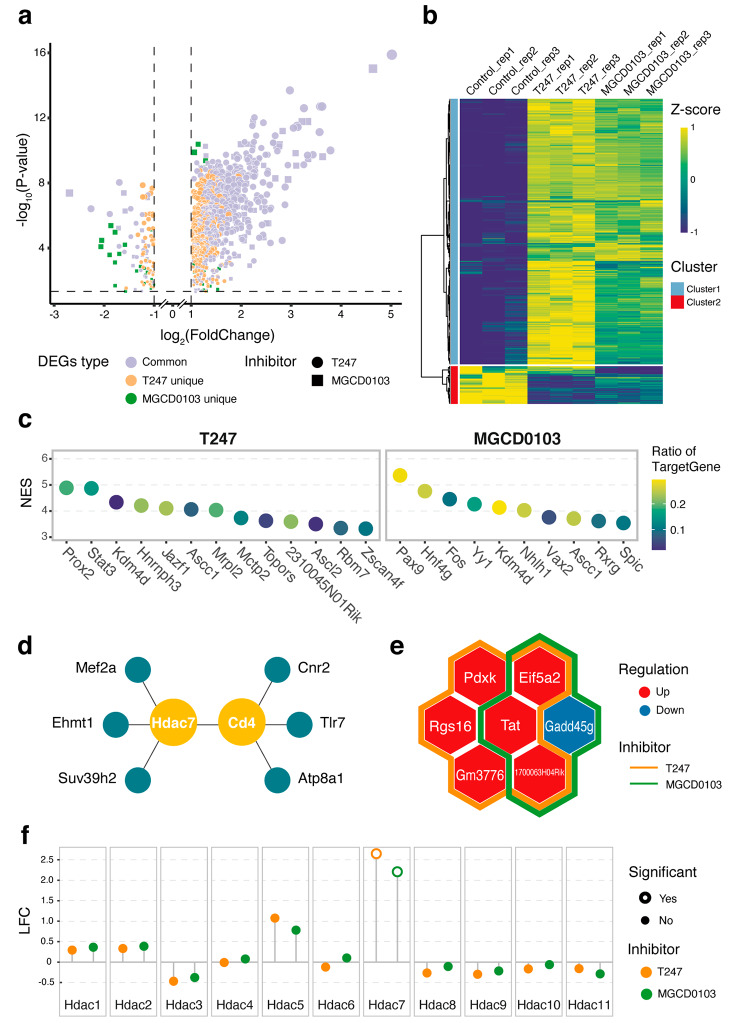
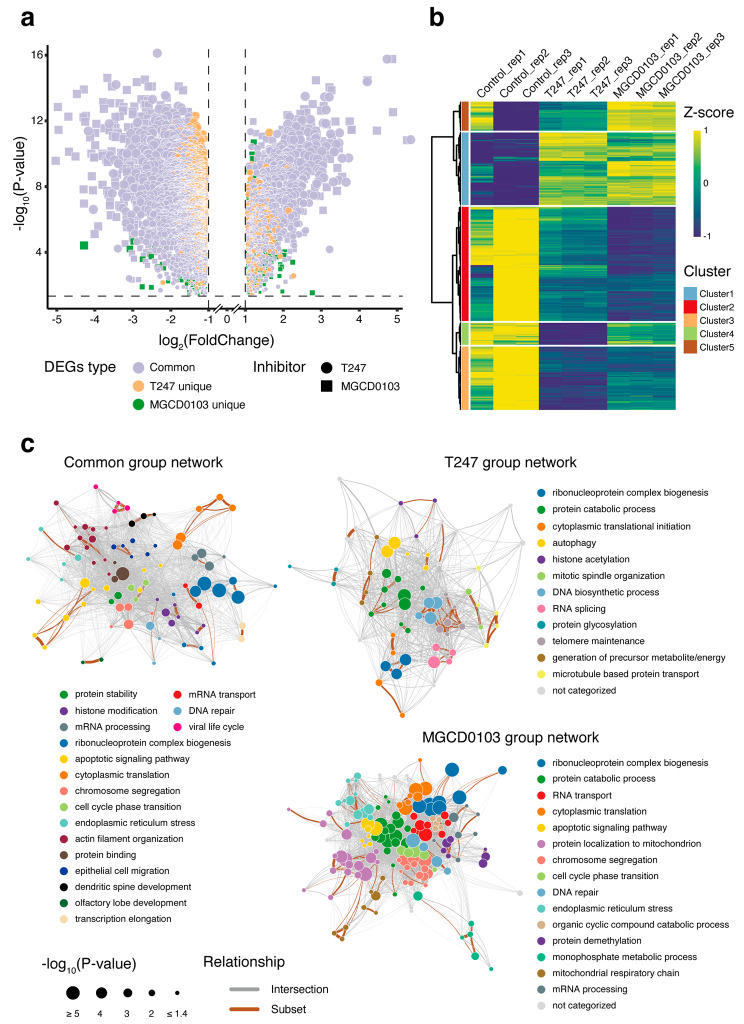
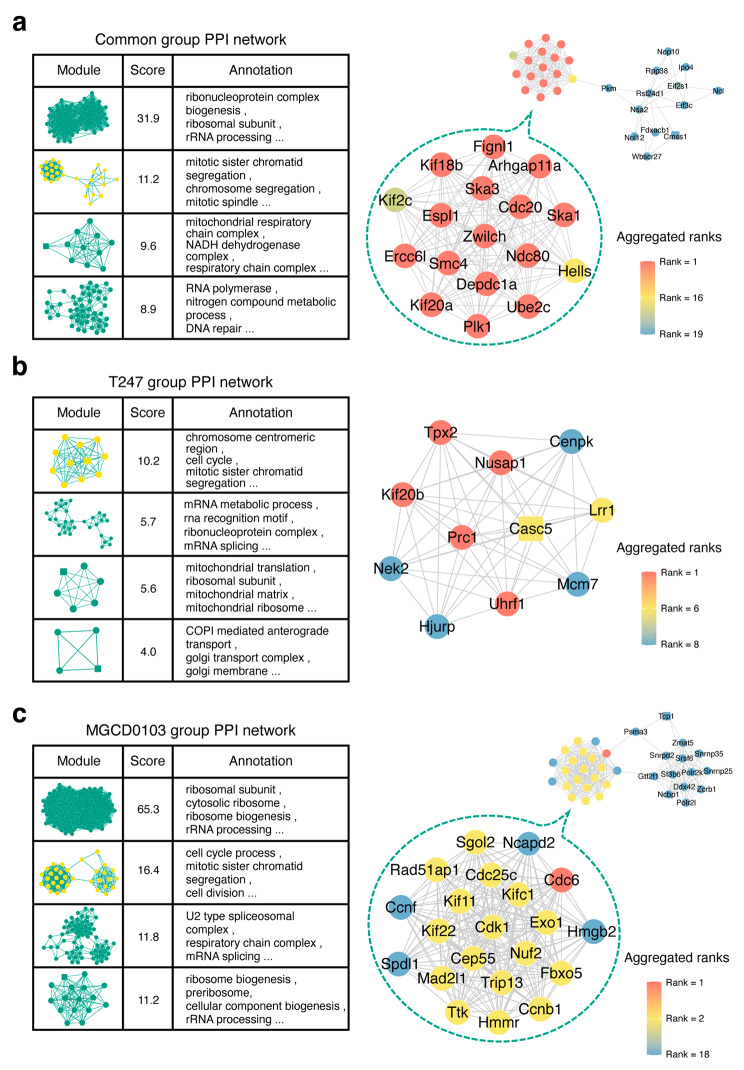
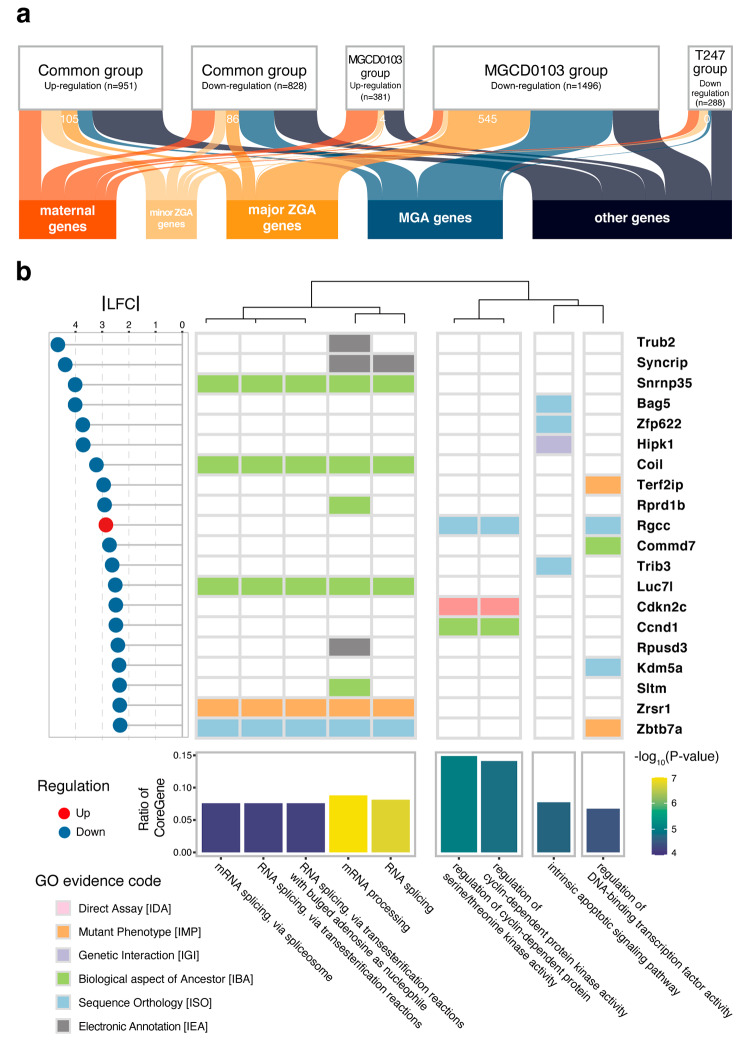
Results: To address this gap, we treated early embryos with two selective HDACi (MGCD0103 and T247). Subsequently, we collected and analyzed their transcriptome data at different developmental stages. Our findings unveiled a significant effect of HDACi treatment during the crucial 2-cell stage of zygotes, leading to a delay in embryonic development after T247 and an arrest at 2-cell stage after MGCD0103 administration. Furthermore, we elucidated the regulatory targets underlying this arrested embryonic development, which pinpointed the G2/M phase as the potential period of embryonic development arrest caused by MGCD0103. Moreover, our investigation provided a comprehensive profile of the biological processes that are affected by HDACi, with their main effects being predominantly localized in four aspects of zygotic gene activation (ZGA): RNA splicing, cell cycle regulation, autophagy, and transcription factor regulation. By exploring the transcriptional regulation and epigenetic features of the genes affected by HDACi, we made inferences regarding the potential main pathways via which HDACs affect gene expression in early embryos. Notably, Hdac7 exhibited a distinct response, highlighting its potential as a key player in early embryonic development.

Conclusions: Our study conducted a comprehensive analysis of the effects of HDACi on early embryonic development at the transcriptional level. The results demonstrated that HDACi significantly affected ZGA in embryos, elucidated the distinct actions of various selective HDACi, and identified specific biological pathways and mechanisms via which these inhibitors modulated early embryonic development.

Keywords: Early embryos; Epigenetic reprogramming; HDAC inhibitor; MGCD0103; T247; Transcriptome; Zygotic gene activation.


Conflict of interest statement

The authors declare no competing interests.

Figures

Fig. 1
Fig. 1
Schematic overview of experiment. Schematic showing the preparation of mouse embryos treated with HDACi for transcriptome analysis. Each sample consisted of 100 embryos, and experiment was repeated with three independent samples (biological replicates)
Fig. 2
Fig. 2
Outline of the effects of HDACi on early embryos. (a) Heatmap of the correlation between the HDAC inhibitors (HDACi) treatment and the control groups at three developmental stages. The mean of Pearson’s correlation coefficients of replicate samples within the treatment is shown. The red crosses indicate embryos that failed to develop to the corresponding stage after HDACi treatment. Results of the principal component analysis of combined data from other normal pre-implantation embryos (b) and of data from the HDACi treatment and control groups alone (c). The colors indicate the different developmental stages, and the shapes indicate the different treatment conditions. (d) The bar graph shows the genes with the highest loadings in the PC3 direction in (c), where red indicates a positive correlation between gene expression and the HDACi effects, and blue indicates a negative correlation. (e) Bar graph showing the 10 gene ontology (GO) terms with the highest absolute NES values in the enrichment analysis, using the loading order of genes in the PC3 direction in (c). NES: normalized enrichment score; CoreGene: genes in the ranked gene list before (for positive ES) or after (for negative ES) the peak in the running enrichment score
Fig. 3
Fig. 3
HDACi effects on 1-cell stage embryos. (a) Volcano plot of differentially expressed genes (DEGs), with colors representing the relationships between the DEGs in the two HDACi treatments, and point shapes indicating the HDACi treatment from which the corresponding DEGs stem. To display all data clearly, the point sizes were linearly scaled along the slopes using the same absolute values on both the positive and negative x-axes. (b) Heatmap of DEGs prepared using the hierarchical clustering method to divide the differential genes into two clusters. (c) Results of predicted transcription factors (TFs) that regulated DEGs, ranked in descending order of NES, with the color representing the ratio of DEGs among the gene set that was regulated by the corresponding TFs. (d) protein–protein interaction (PPI) network of HDACi-affected minor zygotic gene activation (ZGA) genes, with yellow nodes representing core proteins. (e) Hexagonal Venn diagram showing the presence of DEGs in the strictly filtered minor ZGA gene set. The color of the frame indicates the type of HDACi, and the genes within the frame represent the minor ZGA genes that were affected by the corresponding HDACi treatment. (f) Differential expression results of HDAC-family genes after HDACi treatment, where the open circles represent adjusted P-values < 0.05 and LFC represents the log2 fold change
Fig. 4
Fig. 4
Profile of the HDACi effects on 2-cell stage embryos. (a) Volcano plot of DEGs, as in Fig. 3a. (b) Heatmap of DEGs prepared using the hierarchical clustering method, to divide the differential genes into five clusters. (c) The network diagram represents the enriched biological processes within each group of DEGs and their relationship. Each point represents a GO term that has been enriched, with its size indicating the negative logarithm of the P-value obtained from the enrichment analysis. Different colors represent different GO-term clusters, with each cluster being annotated with a label, and clusters with the same label being represented by the same color in the networks of the different groups. The width of the lines connecting the points represents the strength of the relationships between the GO terms, with brown lines connecting a pair of GO terms in which one is a subset of genes contained in the other. The layout of the network indicates that GO terms with a higher degree of correlation tended to cluster together
Fig. 5
Fig. 5
Analysis of the PPI network at the 2-cell stage. (a) A table listing the network structures, specific scores, and functional annotations of the top four modules with the highest scores from the complete PPI network in the DEGs of the common group is shown on the left. The details of the module highlighted in yellow are shown on the right: the protein-coding gene symbols corresponding to each node in the module are provided, with the color indicating the comprehensive ranking of the inferred importance of each node in the network (ties in the ranking are allowed). Results of the PPI network analysis in the DEGs of the T247 (b) and MGCD0103 (c) groups using the same display approach as in (a)
Fig. 6
Fig. 6
Analysis of the major ZGA genes affected by HDACi at the 2-cell stage. (a) The Sankey diagrams display the proportions of different expression patterns of up- and downregulated DEGs in the three groups. The upper part contains the up- and downregulated DEGs set from the three groups affected by HDACi in this experiment, whereas the lower part represents the gene sets classified according to programmed waves during maternal-to-zygotic gene activation. (b) The combined plot represents the presence of the top 20 major ZGA genes with the highest effect under HDACi treatment in the enriched GO terms. The main heatmap shows the presence of these 20 major ZGA genes in the GO terms that were calculated from all HDACi-affected major ZGA genes. If a gene is present in a GO term, the corresponding rectangle in the heatmap is colored based on the evidence code, which indicates how the gene is annotated in that GO term. The lollipop plot depicted on the left side of the heatmap shows the fold change in expression of these 20 genes, where|LFC| denotes the absolute value of the log2 fold change and the upregulated genes are represented in red, whereas the downregulated genes are indicated in blue. The bar chart at the bottom of the heatmap shows enriched GO terms and was divided into four clusters. The height of each bar represents the proportion of an HDACi-affected major ZGA gene in the corresponding GO term, with the color representing the negative logarithm of the P-value obtained from the enrichment analysis
Fig. 7
Fig. 7
Relationship between the genes affected by HDACi and their epigenetic status. The dot heatmap shows the enrichment of DEGs that are up- or downregulated by the two HDACi at the 1-cell, 2-cell, and 4-cell stage, respectively, in the defined gene set, which exhibited high-level epigenetic modifications in the promoter region. The size of the dots/open circles (outer) represent the negative logarithm of the P-value adjusted for multiple testing in the hypergeometric test. An open circle denotes an adjusted P-value < 0.01, indicating a significant enrichment effect; otherwise, a point is used to indicate no significant enrichment. The color indicates the number of genes affected by HDACi in the defined high-level epigenetically modified gene set

Similar articles

Cited by

References

    1. Gershey EL, Vidali G, Allfrey VG. Chemical studies of histone acetylation. The occurrence of epsilon-N-acetyllysine in the f2a1 histone. J Biol Chem. 1968;243(19):5018–22. doi: 10.1016/S0021-9258(18)91985-X. - DOI - PubMed
    1. Yang XJ, Seto E. HATs and HDACs: from structure, function and regulation to novel strategies for therapy and prevention. Oncogene. 2007;26(37):5310–8. doi: 10.1038/sj.onc.1210599. - DOI - PubMed
    1. Gregoretti IV, Lee YM, Goodson HV. Molecular evolution of the histone deacetylase family: functional implications of phylogenetic analysis. J Mol Biol. 2004;338(1):17–31. doi: 10.1016/j.jmb.2004.02.006. - DOI - PubMed
    1. Witt O, et al. HDAC family: what are the cancer relevant targets? Cancer Lett. 2009;277(1):8–21. doi: 10.1016/j.canlet.2008.08.016. - DOI - PubMed
    1. Li G, Tian Y, Zhu WG. The roles of histone deacetylases and their inhibitors in Cancer Therapy. Front Cell Dev Biol. 2020;8:576946. doi: 10.3389/fcell.2020.576946. - DOI - PMC - PubMed