. 2024 Feb 5;22(1):137.
doi: 10.1186/s12967-024-04933-1.

The siRNA-mediated knockdown of AP-1 restores the function of the pulmonary artery and the right ventricle by reducing perivascular and interstitial fibrosis and key molecular players in cardiopulmonary disease

Affiliations

The siRNA-mediated knockdown of AP-1 restores the function of the pulmonary artery and the right ventricle by reducing perivascular and interstitial fibrosis and key molecular players in cardiopulmonary disease

Ioana Karla Comarița et al. J Transl Med. .

Abstract

Background: Pulmonary hypertension (PH) is a complex multifactorial vascular pathology characterized by an increased pulmonary arterial pressure, vasoconstriction, remodelling of the pulmonary vasculature, thrombosis in situ and inflammation associated with right-side heart failure. Herein, we explored the potential beneficial effects of treatment with siRNA AP-1 on pulmonary arterial hypertension (PAH), right ventricular dysfunction along with perivascular and interstitial fibrosis in pulmonary artery-PA, right ventricle-RV and lung in an experimental animal model of monocrotaline (MCT)-induced PAH.

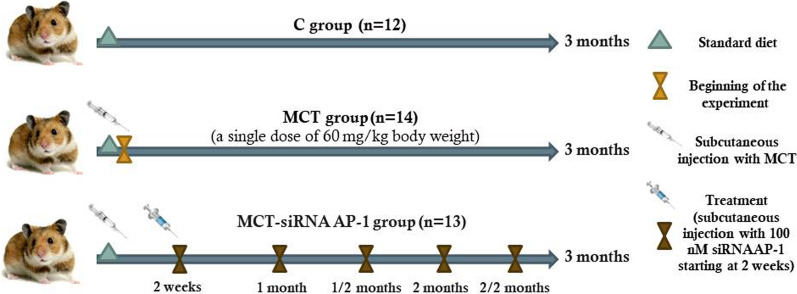
Methods: Golden Syrian hamsters were divided into: (1) C group-healthy animals taken as control; (2) MCT group obtained by a single subcutaneous injection of 60 mg/kg MCT at the beginning of the experiment; (3) MCT-siRNA AP-1 group received a one-time subcutaneous dose of MCT and subcutaneous injections containing 100 nM siRNA AP-1, every two weeks. All animal groups received water and standard chow ad libitum for 12 weeks.

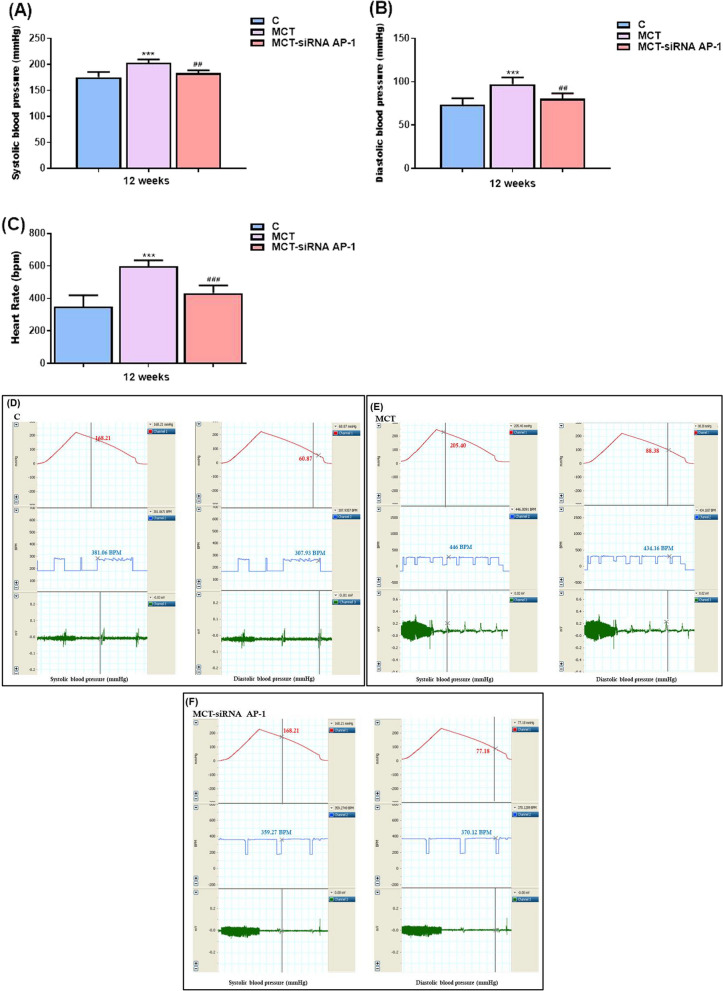
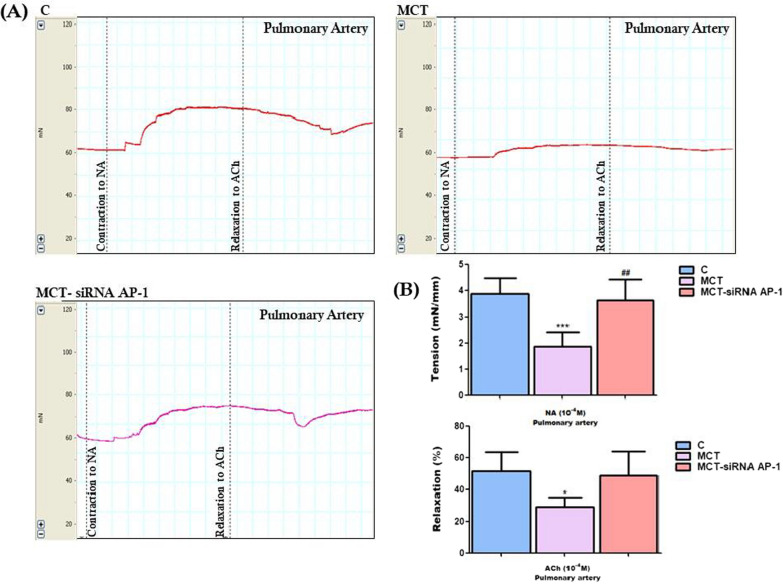
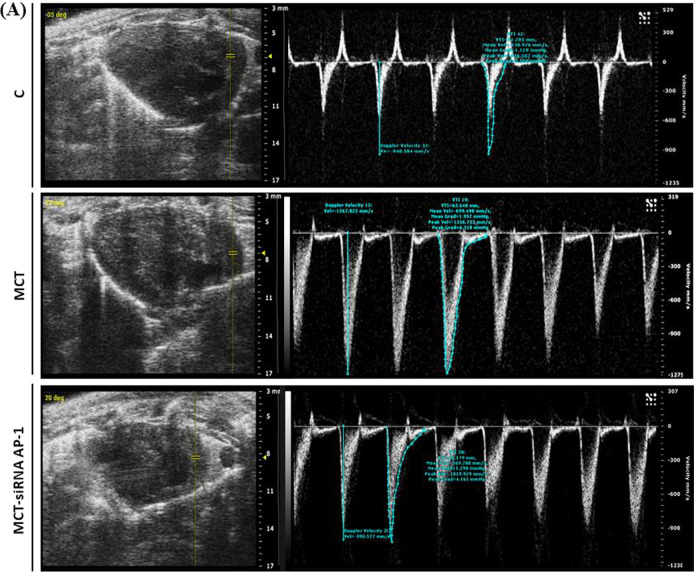
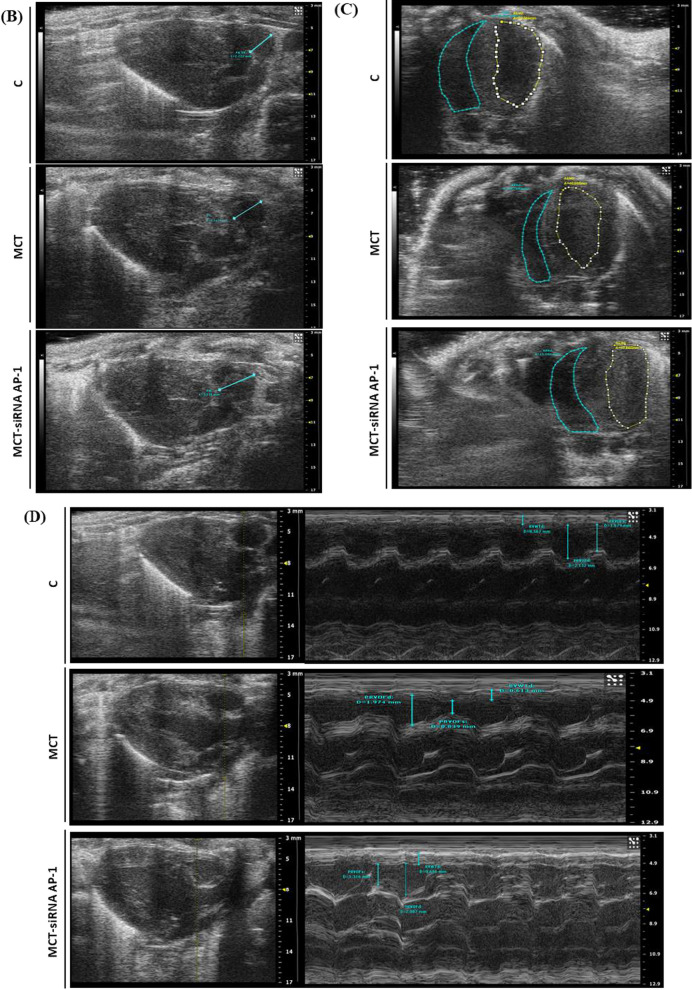
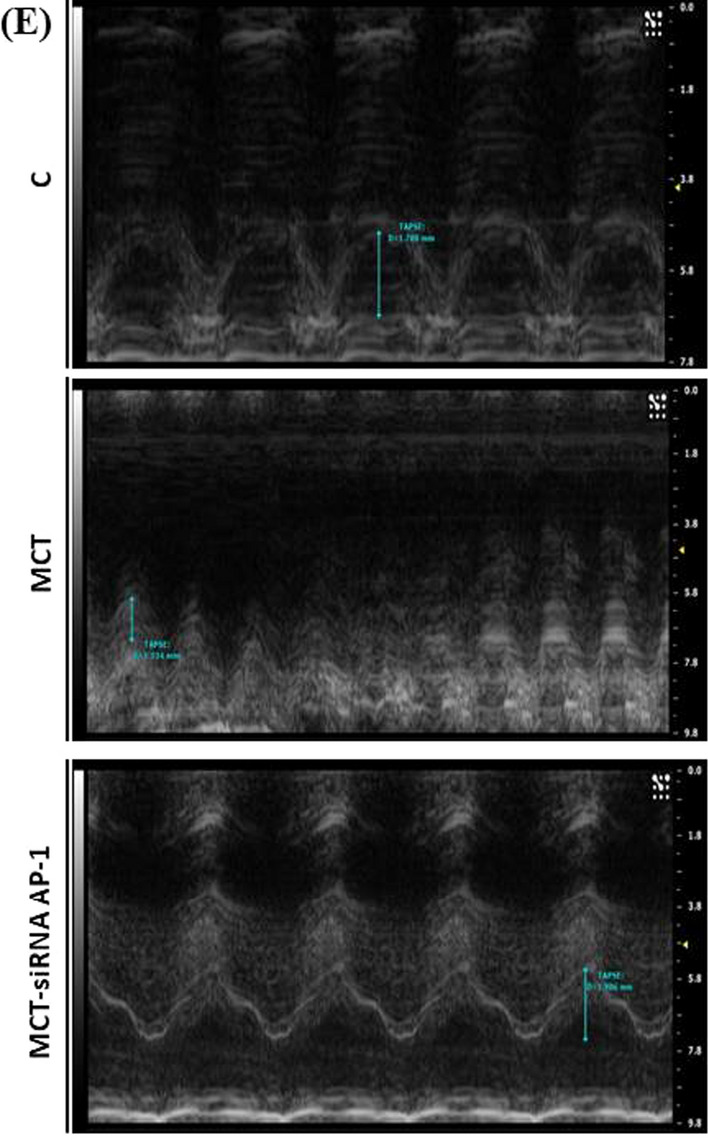
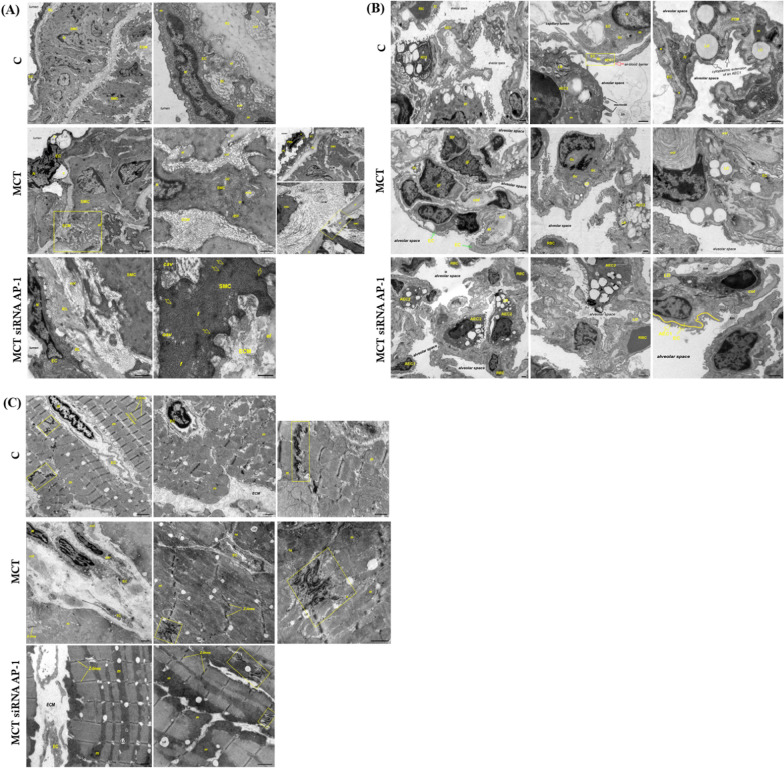
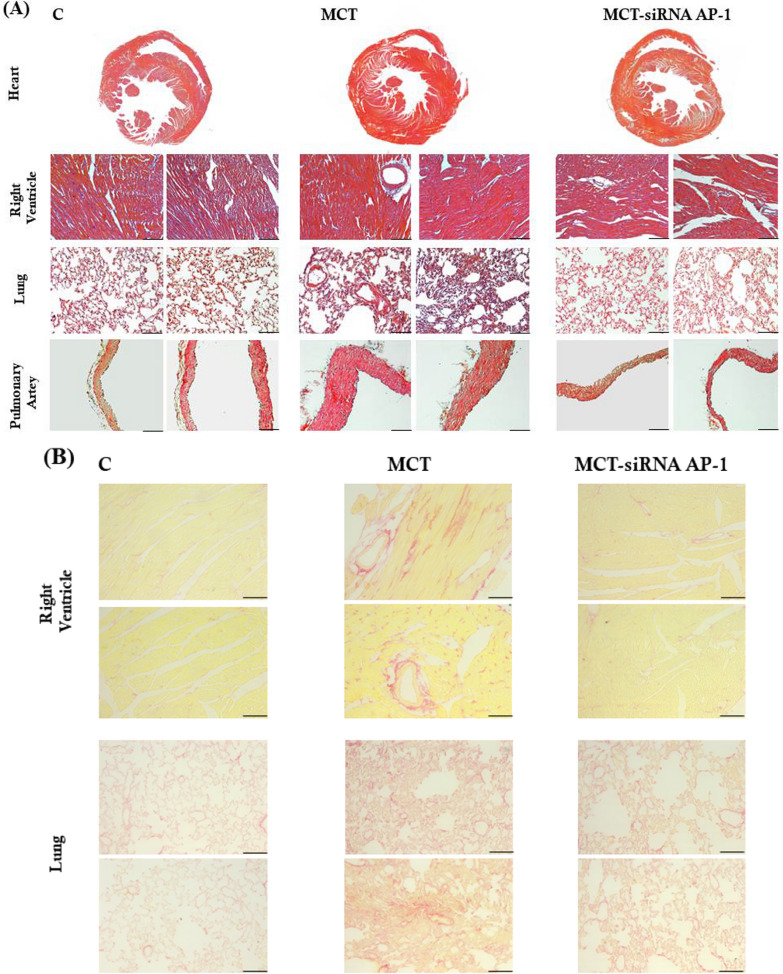
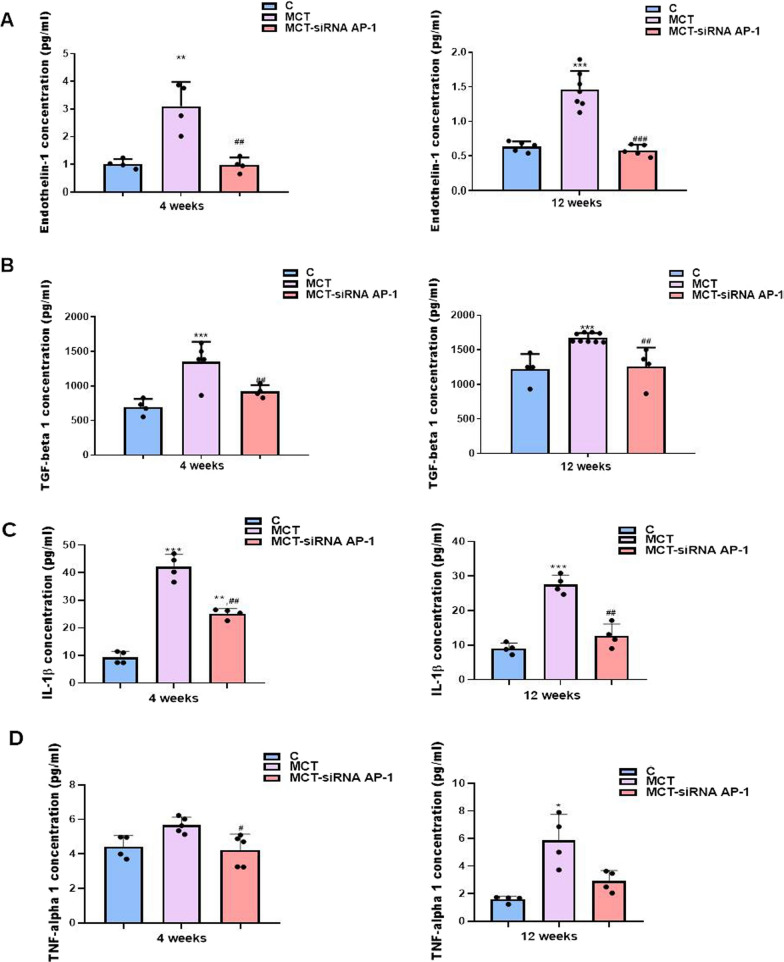
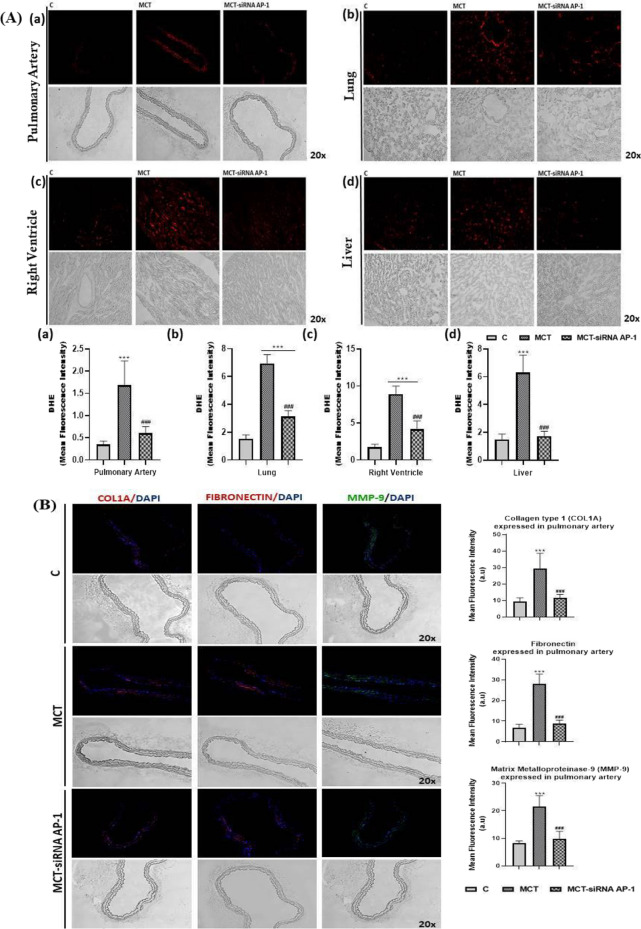
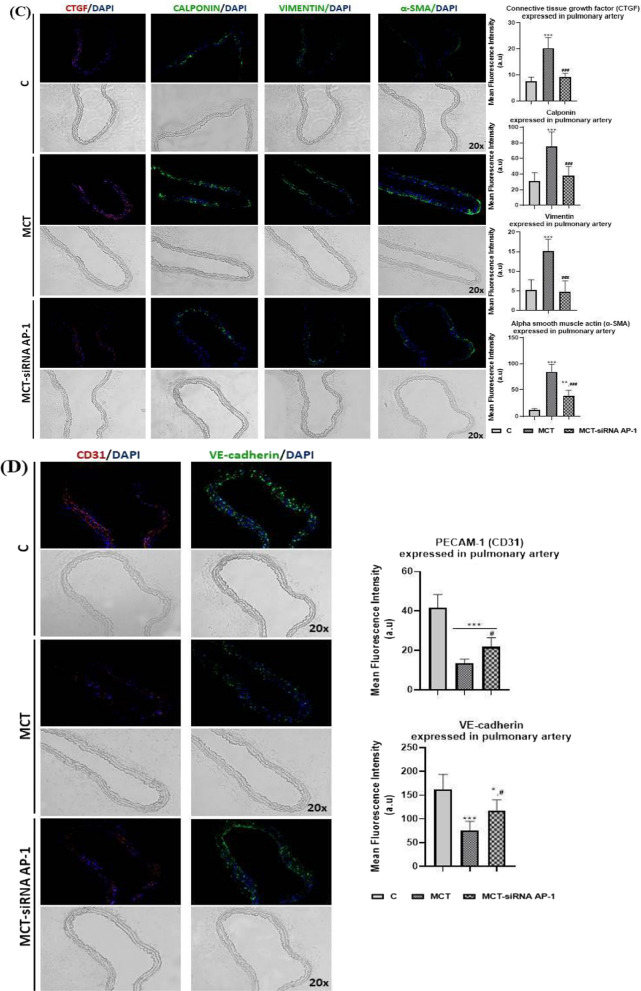
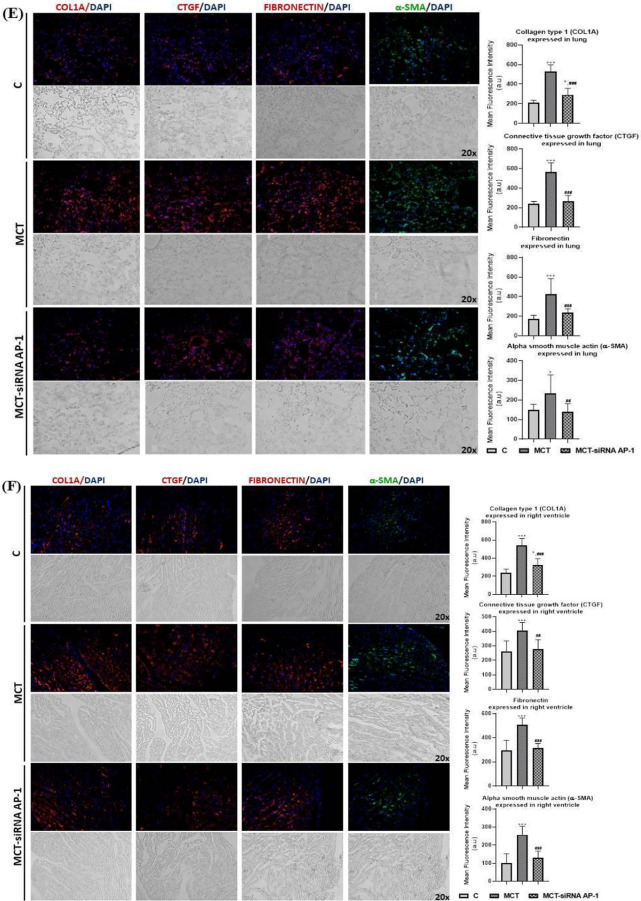
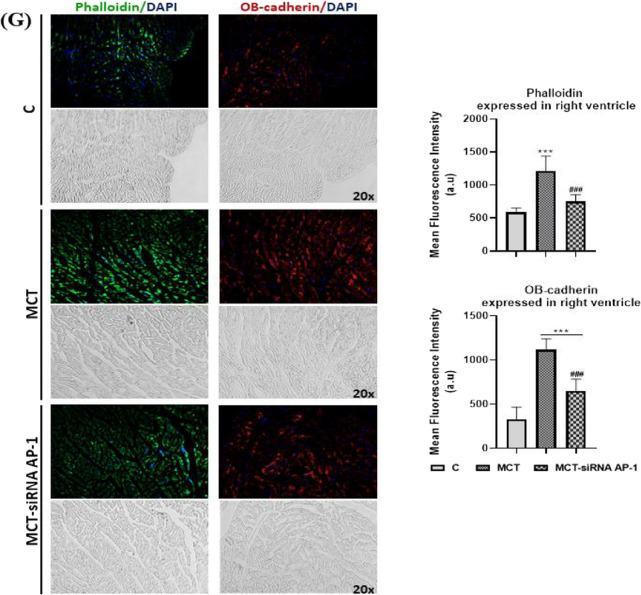
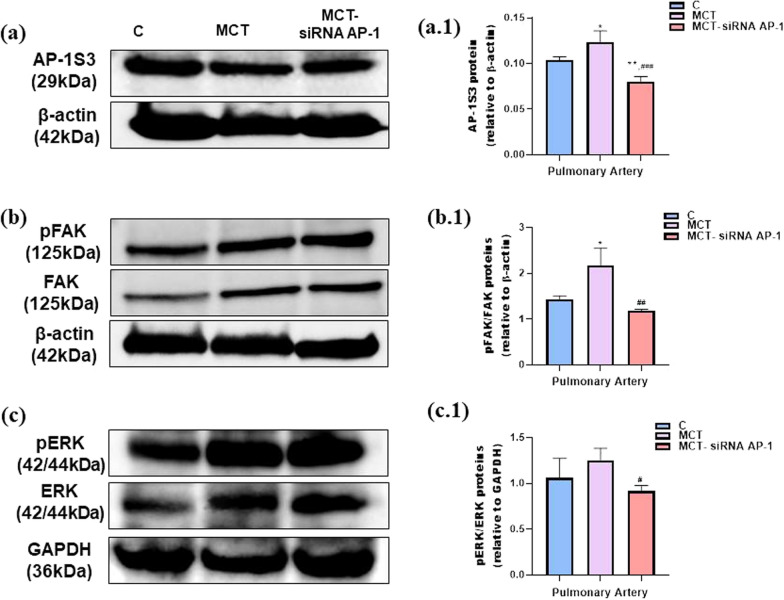
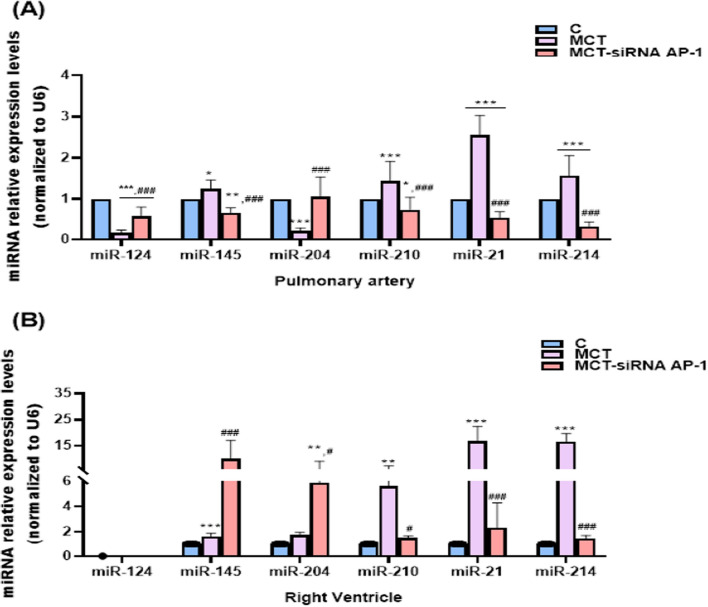
Results: In comparison with the MCT group, siRNA AP-1 treatment had significant beneficial effects on investigated tissues contributing to: (1) a reduction in TGF-β1/ET-1/IL-1β/TNF-α plasma concentrations; (2) a reduced level of cytosolic ROS production in PA, RV and lung and notable improvements regarding the ultrastructure of these tissues; a decrease of inflammatory and fibrotic marker expressions in PA (COL1A/Fibronectin/Vimentin/α-SMA/CTGF/Calponin/MMP-9), RV and lung (COL1A/CTGF/Fibronectin/α-SMA/F-actin/OB-cadherin) and an increase of endothelial marker expressions (CD31/VE-cadherin) in PA; (4) structural and functional recoveries of the PA [reduced Vel, restored vascular reactivity (NA contraction, ACh relaxation)] and RV (enlarged internal cavity diameter in diastole, increased TAPSE and PRVOFs) associated with a decrease in systolic and diastolic blood pressure, and heart rate; (5) a reduced protein expression profile of AP-1S3/ pFAK/FAK/pERK/ERK and a significant decrease in the expression levels of miRNA-145, miRNA-210, miRNA-21, and miRNA-214 along with an increase of miRNA-124 and miRNA-204.

Conclusions: The siRNA AP-1-based therapy led to an improvement of pulmonary arterial and right ventricular function accompanied by a regression of perivascular and interstitial fibrosis in PA, RV and lung and a down-regulation of key inflammatory and fibrotic markers in MCT-treated hamsters.

Keywords: Cardiac and pulmonary fibrosis; Cardiopulmonary disease; Monocrotaline; Pulmonary arterial hypertension; siRNA AP-1.


Conflict of interest statement

The authors declare that the research was conducted in the absence of any commercial or financial relationships that could be construed as a potential conflict of interest.

Figures

Fig. 1
Fig. 1
Schematic illustration of experimental animal models obtained for a period of 12 weeks. Golden Syrian hamsters (39 males, 3 months old) were randomly divided into three experimental groups, including: (1) C group, healthy animals; (2) MCT group obtained by a single subcutaneous injection dose of 60 mg/kg monocrotaline (MCT) at the beginning of the experiment (day 0); (3) MCT-siRNA AP-1 group that received subcutaneous injections of 100 nM siRNA AP-1 every two weeks. All animal groups received water and standard chow ad libitum
Fig. 2
Fig. 2
The development of pulmonary arterial hypertension in hamsters exposed to MCT for 12 weeks and siRNA AP-1 for 10 weeks compared to control animals. A Systolic blood pressure (mmHg), B diastolic blood pressure (mmHg) and C Heart Rate (bpm) of pulmonary arteries were measured using non-invasive voltage device and data quantification. For each measurement, the average value of a continuous recording interval (8–10 times) was calculated. Five animals from each experimental group were evaluated. The data represent the means ± SD. Statistical significance represented as ***P < 0.005, versus control group and ###P < 0.005, ##P < 0.01 versus MCT group. One-way ANOVA, Bonferroni post-test was applied. DF Representative waveforms of pulmonary arterial pressure in all three experimental animal groups: systolic blood pressure (left-red), diastolic blood pressure (right-red), heart rate (blue)
Fig. 3
Fig. 3
A Representative images with myographic recordings at selected time points: for the contraction at NA (10−8 M ÷ 10−4 M) and relaxation at ACh (10−8 M ÷ 10−4 M) of the pulmonary arteries isolated from all three investigated experimental groups. Images were recorded with LabChart 7 software. B Measures of maximal contraction forces developed by pulmonary arteries to 10–4 M NA and maximal relaxation percentages to 10–4 M ACh for the three hamster groups. Data are means ± SD of 4 independent experiments for each investigated group. The statistical significance, noticeably different, was represented as ***P < 0.005, *P < 0.05 versus control group and ##P < 0.01 versus MCT group. Probability values were calculated by One-way ANOVA, Bonferroni post-test
Fig. 4
Fig. 4
Changes in the blood flow, structure and function of pulmonary artery and right ventricle for the investigated experimental groups: C, MCT, MCT-siRNA AP-1. A Representative recordings obtained in pulsed wave Doppler-mode, which highlight the Velocity Time Integral (VTI, mm) and Doppler Peak Velocity (Vel, mm/s) of the pulmonary artery; B representative B-mode recordings, which highlight the inner diameter (mm) of the pulmonary artery; C Representative B-mode recordings, which highlight the area of the right and left ventricle in diastole (mm2); D Representative M-mode recordings, which highlight right ventricle wall thickness in diastole (RVWTd, mm); Representative M-mode recordings, which highlight proximal ventricle outflow chamber during systole and diastole (PRVOFd, PRVOFs, mm); E Representative M-mode recordings which highlight tricuspid annular plane systolic excursion (TAPSE, mm)
Fig. 4
Fig. 4
Changes in the blood flow, structure and function of pulmonary artery and right ventricle for the investigated experimental groups: C, MCT, MCT-siRNA AP-1. A Representative recordings obtained in pulsed wave Doppler-mode, which highlight the Velocity Time Integral (VTI, mm) and Doppler Peak Velocity (Vel, mm/s) of the pulmonary artery; B representative B-mode recordings, which highlight the inner diameter (mm) of the pulmonary artery; C Representative B-mode recordings, which highlight the area of the right and left ventricle in diastole (mm2); D Representative M-mode recordings, which highlight right ventricle wall thickness in diastole (RVWTd, mm); Representative M-mode recordings, which highlight proximal ventricle outflow chamber during systole and diastole (PRVOFd, PRVOFs, mm); E Representative M-mode recordings which highlight tricuspid annular plane systolic excursion (TAPSE, mm)
Fig. 5
Fig. 5
Representative transmission electron microscopy (TEM) images showing the effect of the 12-week administration of MCT alone or in combination with siRNA AP-1 (for 10 weeks) on: A the pulmonary artery; B lung parenchyma; C right ventricle of hamsters from each of the three experimental groups. EC endothelial cell, SMC vascular smooth muscle cell, IEL internal elastic lamina, BL basal lamina, ECM extracellular matrix, col, collagen fibres, el elastin, N nucleus, m mitochondria, cav caveolae, Gc Golgi complex, rER rough endoplasmic reticulum (ER*: stressed ER), mvb multivesicular bodies, PMN polymorphonuclear leukocyte, PL platelet, f myofilaments, AEC 1 type 1 alveolar epithelial cell, AEC 2 type 2 alveolar epithelial cell, RBC red blood cell, MF macrophage, IF inflammatory cell, IS interstitial space, IC interstitial cell, LD lipid droplet, LB surfactant-storing lamellar bodies, tm tubular myelin, Gg glycogen granules, TC telocyte, SR sarcoplasmic reticulum, #: large vacuoles; yellow ellipse: contact between a leukocyte and the endothelial cell surface; dashed yellow boxes: regions with fragmented elastin; arrows: dense plaques; yellow freehand line: alveolar-capillary fused basement membrane; yellow boxes: intercalated discs. Scale bars indicate from left to right and top to bottom: A 2 µm, 0.5 µm; 1 µm, 0.5 µm, 1 µm / 0.5 µm; 1 µm, 0.25 µm; B 1 µm, 1 µm, 0.5 µm; 1 µm, 1 µm, 1 µm; 1 µm, 1 µm, 1 µm; C 2 µm, 1 µm, 1 µm; 1 µm, 1 µm, 1 µm; 1 µm, 1 µm, 1 µm
Fig. 6
Fig. 6
A Representative bright-field microscopy images depicting from top to bottom H&E-stained sections with whole heart, right ventricle, lung and pulmonary artery taken from healthy hamsters (C group) and hamsters after 12 weeks of MCT in the absence or presence of siRNA AP-1 injections given for 10 weeks (MCT group and MCT-siRNA AP-1 group). Four different microscopic fields for each experimental point were analysed. Nuclei: blue, cytoplasm: pink, muscle fibres: deep red. B Representative bright-field microscopy images depicting Picro- Sirius Red-stained sections with right ventricle and lung taken from healthy hamsters (C group) and hamsters after 12 weeks of MCT in the absence or presence of siRNA AP-1 injections given for 10 weeks (MCT group and MCT-siRNA AP-1 group). Four different microscopic fields for each experimental point were analysed. Nuclei, cytoplasm and muscular fibers are visualized in yellow. Collagen fibers are manifested in a striking manner as vivid orange-red bands. Scale bar indicate: 100 µm, magnification × 20
Fig. 7
Fig. 7
Analysis of plasma inflammatory cytokines at 4 and 12 experimental weeks: A ET-1, B TGF-β1, C IL-1β and D TNF-α levels evaluated by enzyme-linked immunosorbent assay (ELISA) method, for all three experimental groups: C, MCT, MCT-siRNA AP-1. The measurements were performed in triplicate and results were depicted as mean ± SD. The statistical significance, noticeably different, was represented as ***P < 0.005, *P < 0.05 versus control group and ###P < 0.005, ##P < 0.01, #P < 0.05 versus MCT group. The values were calculated by One-way ANOVA, Bonferroni post-test
Fig. 8
Fig. 8
Representative 2-dimensional dot plot graphics of the flow cytometry data for the immune and inflammatory infiltrate in BAL fluid collected from the three hamster groups (C, MCT and MCT-siRNA AP-1). Immune and inflammatory cells were incubated with different antibodies for markers specific to these cell types as follow: a CD3e-FITC for T cells, b CD4-PE for T helper cells, c CD8-APC for T cytotoxic cells, d MHC-II-PE for proinflammatory macrophages type M1, e CD11c-AF647 for dendritic cells, macrophages, neutrophils, f Singlec-1-AF647 for alveolar macrophages. Unstained cells were distributed in the left quadrant and stained cells were distributed in the right quadrant (measurements include the percentage of cells within the gate). A total of 10.000 events counted for each marker
Fig. 9
Fig. 9
Representative immunofluorescence images for the evaluation of oxidative stress, remodelling pathway, and fibrosis markers specific to vascular dysfunction, lung and cardiac fibrosis after 12 weeks of MCT alone or in combination with siRNA AP-1 for 10 weeks. The thin cryo-sections from three types of tissues: pulmonary artery, lung and right ventricle harvested from all experimental groups (C, MCT, MCT-siRNA AP-1) were immuno-labelled for: A Cytosolic ROS (Reactive Oxygen Species) production stained with dihydroethidium (DHE) dye shown in bright red nuclear fluorescence; Bar graph with quantification of the stained areas expressed in: (a) pulmonary artery, (b) lung, (c) right ventricle, (d) liver. B proteins involved in vascular remodelling/fibrosis: collagen type I (COL1A1-red), Fibronectin-red, Matrix metalloproteinase-9 (MMP-9-green); Bar graph with quantification of the stained areas expressed in pulmonary artery. C proteins involved in vascular fibrosis and the epithelial-mesenchymal transition (EMT): Connective tissue growth factor (CTGF-red), Calponin-red, Vimentin-red, alpha smooth muscle actin (α-SMA-green); Bar graph with quantification of the stained areas expressed in pulmonary artery. D specific endothelial markers for EMT assessment: PECAM-1 (CD31-red), Vascular endothelial cadherin (VE-cadherin-green); Bar graph with quantification of the stained areas in pulmonary artery. E proteins involved in pulmonary fibrosis and EMT: COL1A1-red, CTGF-red, Fibronectin-red, α-SMA-green; Bar graph with quantification of the stained areas expressed in lung tissue. F, G proteins involved in cardiac hypertrophy/fibrosis and FMT: COL1A1-red, CTGF-red, Fibronectin-red, α-SMA-red, F-actin (Phalloidin-green) OB-cadherin-red; Bar graph with quantification of the stained areas expressed in right ventricle tissue. Nuclei were stained with DAPI dye shown in blue fluorescence. Data were presented as mean ± SD. Each experiment point was performed in triplicate, from two different set of experiments. Five different microscopic fields for each experimental point were analysed. 20 × magnification, images quantified using the ImageJ program. The statistical significance, noticeably different, was represented as ***P < 0.005, **P < 0.01, *P < 0.05 values versus control group and ###P < 0.005, ##P < 0.01, #P < 0.05 values versus MCT group. One-way ANOVA, Bonferroni post-test was applied
Fig. 9
Fig. 9
Representative immunofluorescence images for the evaluation of oxidative stress, remodelling pathway, and fibrosis markers specific to vascular dysfunction, lung and cardiac fibrosis after 12 weeks of MCT alone or in combination with siRNA AP-1 for 10 weeks. The thin cryo-sections from three types of tissues: pulmonary artery, lung and right ventricle harvested from all experimental groups (C, MCT, MCT-siRNA AP-1) were immuno-labelled for: A Cytosolic ROS (Reactive Oxygen Species) production stained with dihydroethidium (DHE) dye shown in bright red nuclear fluorescence; Bar graph with quantification of the stained areas expressed in: (a) pulmonary artery, (b) lung, (c) right ventricle, (d) liver. B proteins involved in vascular remodelling/fibrosis: collagen type I (COL1A1-red), Fibronectin-red, Matrix metalloproteinase-9 (MMP-9-green); Bar graph with quantification of the stained areas expressed in pulmonary artery. C proteins involved in vascular fibrosis and the epithelial-mesenchymal transition (EMT): Connective tissue growth factor (CTGF-red), Calponin-red, Vimentin-red, alpha smooth muscle actin (α-SMA-green); Bar graph with quantification of the stained areas expressed in pulmonary artery. D specific endothelial markers for EMT assessment: PECAM-1 (CD31-red), Vascular endothelial cadherin (VE-cadherin-green); Bar graph with quantification of the stained areas in pulmonary artery. E proteins involved in pulmonary fibrosis and EMT: COL1A1-red, CTGF-red, Fibronectin-red, α-SMA-green; Bar graph with quantification of the stained areas expressed in lung tissue. F, G proteins involved in cardiac hypertrophy/fibrosis and FMT: COL1A1-red, CTGF-red, Fibronectin-red, α-SMA-red, F-actin (Phalloidin-green) OB-cadherin-red; Bar graph with quantification of the stained areas expressed in right ventricle tissue. Nuclei were stained with DAPI dye shown in blue fluorescence. Data were presented as mean ± SD. Each experiment point was performed in triplicate, from two different set of experiments. Five different microscopic fields for each experimental point were analysed. 20 × magnification, images quantified using the ImageJ program. The statistical significance, noticeably different, was represented as ***P < 0.005, **P < 0.01, *P < 0.05 values versus control group and ###P < 0.005, ##P < 0.01, #P < 0.05 values versus MCT group. One-way ANOVA, Bonferroni post-test was applied
Fig. 10
Fig. 10
Representative Western blotting images of the expression levels of AP-1S3 (a), pFAK, FAK (b), pERK, ERK and β-actin/GAPDH (c) in pulmonary artery homogenates from all three experimental animal groups after 12 weeks of MCT alone or in combination with siRNA AP-1 for 10 weeks. Histograms show a quantitative representation of signalling molecules, AP-1S3 (a.1), pFAK, FAK (b.1), pERK, ERK (c.1). The data are shown as the mean ± SD of 4 independent experiments. Statistical significance represented as **P < 0.01, *P < 0.05 values versus control group and ###P < 0.005, ##P < 0.01, #P < 0.05 values versus MCT group, One-way ANOVA, Bonferroni post-test. Quantification of band intensities expressed as ratio with β-actin/GAPDH was analysed by TotalLab TL120 program. The housekeeping β-actin and GAPDH proteins are shown as loading control for protein normalization
Fig. 11
Fig. 11
Bar graph that illustrates relative expression levels of six miRNAs, miRNA-124, miRNA-145, miRNA-204, miRNA-210, miRNA-21 and miRNA-214, extracted from A pulmonary arteries and B right ventricle of the three groups of investigated animals. Total RNA was extracted and used for RT-qPCR assay. The expression of miRNA panel was validated using four tissue samples from each group and matched normal tissue samples. The miRNA expression was normalised using snRU6 as a reference gene. P-values of significant differences between the groups were calculated, and represented as ***P < 0.005, **P < 0.01, *P < 0.05 values versus control group, and ###P < 0.005, #P < 0.05 values versus MCT group (One-way ANOVA Bonferroni post-test analysis). The mean fold change in expression of the target miRNA was calculated using ∆∆Ct = ΔCt (a target sample)−ΔCt (a reference sample). For the control sample, ∆∆Ct equals 0 and 20 equals 1, therefore fold change in gene expression relative to control equals 1

Similar articles

References

    1. Simonneau G, Robbins IM, Beghetti M, Channick RN, Delcroix M, Denton CP, et al. Updated clinical classification of pulmonary hypertension. J Am Coll Cardiol. 2009;54:S43–S54. doi: 10.1016/j.jacc.2009.04.012. - DOI - PubMed
    1. Wolter J, Mooi KG. Histopathology of pulmonary hypertensive diseases. Diagn Histopathol. 2006;12:429–440. doi: 10.1016/j.cdip.2006.07.003. - DOI
    1. Ryan JJ, Marsboom G, Archer SL. Rodent models of group 1 pulmonary hypertension. Handb Exp Pharmacol. 2013;218:105–149. doi: 10.1007/978-3-642-38664-0_5. - DOI - PubMed
    1. Ryan J, Bloch K, Archer SL. Rodent models of pulmonary hypertension: harmonisation with the World Health Organisation’s categorisation of human PH. Int J Clin Pract Suppl. 2011 doi: 10.1111/j.1742-1241.2011.02710.x. - DOI - PubMed
    1. Meyrick B. The pathology of pulmonary artery hypertension. Clin Chest Med. 2001;22:393–404, vii. doi: 10.1016/s0272-5231(05)70279-3. - DOI - PubMed

Publication types

LinkOut - more resources