

The current state of complex systems research on socioeconomic inequalities in health and health behavior-a systematic scoping review
- PMID: 38317165
- PMCID: PMC10845451
- DOI: 10.1186/s12966-024-01562-1
The current state of complex systems research on socioeconomic inequalities in health and health behavior-a systematic scoping review
Abstract
Background: Interest in applying a complex systems approach to understanding socioeconomic inequalities in health is growing, but an overview of existing research on this topic is lacking. In this systematic scoping review, we summarize the current state of the literature, identify shared drivers of multiple health and health behavior outcomes, and highlight areas ripe for future research.
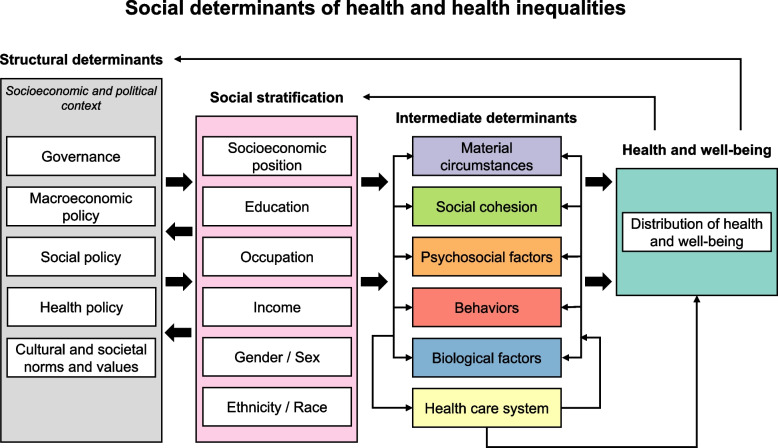
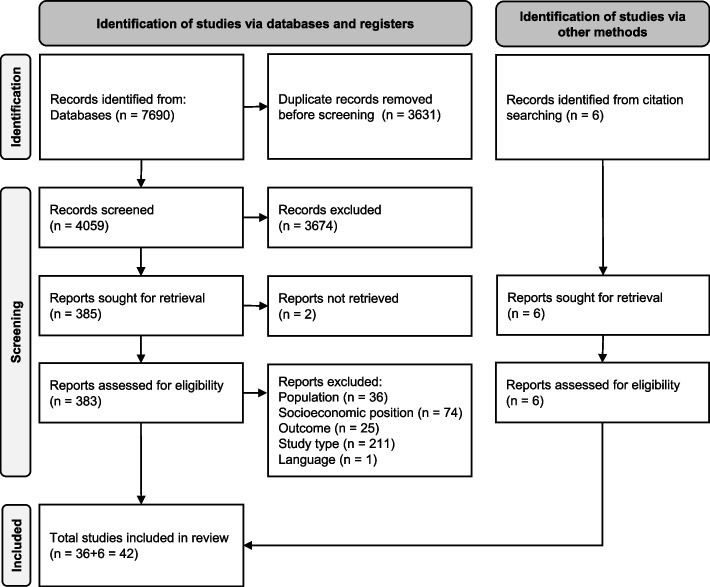
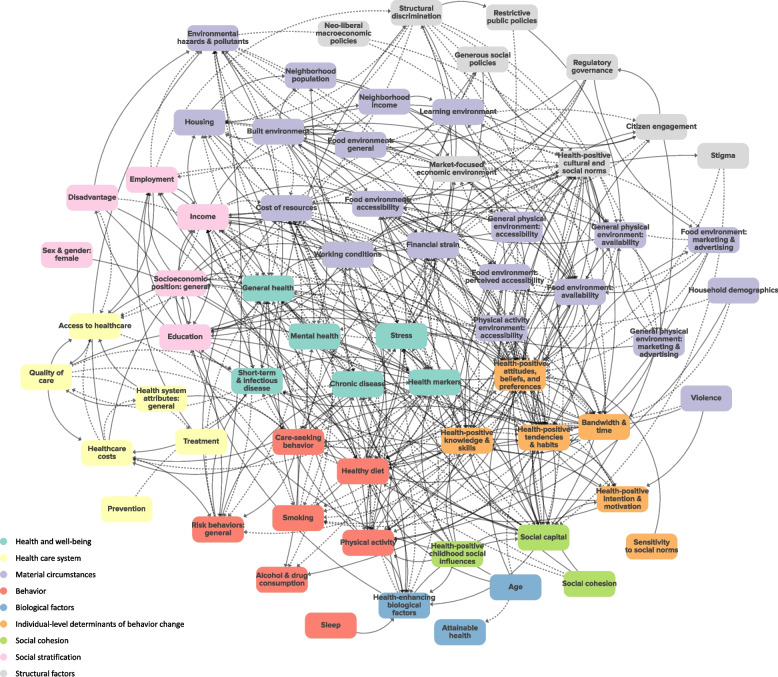
Methods: SCOPUS, Web of Science, and PubMed databases were searched in April 2023 for peer-reviewed, English-language studies in high-income OECD countries containing a conceptual systems model or simulation model of socioeconomic inequalities in health or health behavior in the adult general population. Two independent reviewers screened abstracts and full texts. Data on study aim, type of model, all model elements, and all relationships were extracted. Model elements were categorized based on the Commission on Social Determinants of Health framework, and relationships between grouped elements were visualized in a summary conceptual systems map.
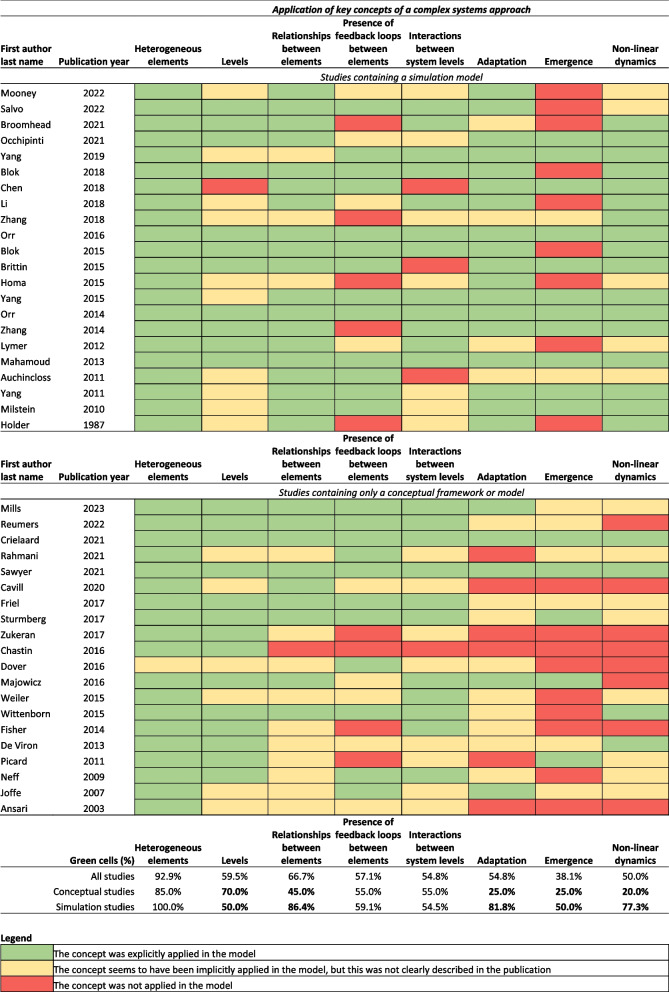
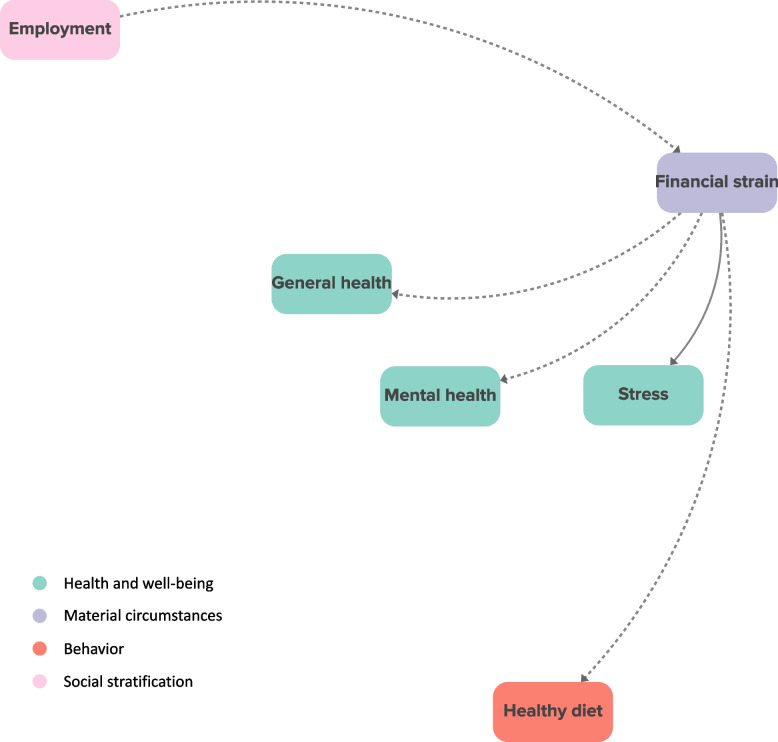
Results: A total of 42 publications were included; 18 only contained a simulation model, 20 only contained a conceptual model, and 4 contained both types of models. General health outcomes (e.g., health status, well-being) were modeled more often than specific outcomes like obesity. Dietary behavior and physical activity were by far the most commonly modeled health behaviors. Intermediary determinants of health (e.g., material circumstances, social cohesion) were included in nearly all models, whereas structural determinants (e.g., policies, societal values) were included in about a third of models. Using the summary conceptual systems map, we identified 15 shared drivers of socioeconomic inequalities in multiple health and health behavior outcomes.
Conclusions: The interconnectedness of socioeconomic position, multiple health and health behavior outcomes, and determinants of socioeconomic inequalities in health is clear from this review. Factors central to the complex system as it is currently understood in the literature (e.g., financial strain) may be both efficient and effective policy levers, and factors less well represented in the literature (e.g., sleep, structural determinants) may warrant more research. Our systematic, comprehensive synthesis of the literature may serve as a basis for, among other things, a complex systems framework for socioeconomic inequalities in health.
Keywords: Causal loop diagram; Complex systems; Health and well-being; Health behavior; Socioeconomic inequalities; Systematic scoping review.
© 2024. The Author(s).
Conflict of interest statement
The authors declare that they have no competing interests.
Figures
References
-
- Mayhew L, Smith D. An Investigation into Inequalities in Adult Lifespan. North Am Actuarial J. 2021;25(sup1):S545–S565. doi: 10.1080/10920277.2019.1671874. - DOI
Publication types
MeSH terms
Grants and funding
LinkOut - more resources
Full Text Sources
Miscellaneous
