. 2024 Feb 5;24(1):56.
doi: 10.1186/s12935-024-03231-6.

Targeting of H19/cell adhesion molecules circuitry by GSK-J4 epidrug inhibits metastatic progression in prostate cancer

Affiliations

Targeting of H19/cell adhesion molecules circuitry by GSK-J4 epidrug inhibits metastatic progression in prostate cancer

Valeria Pecci et al. Cancer Cell Int. .

Abstract

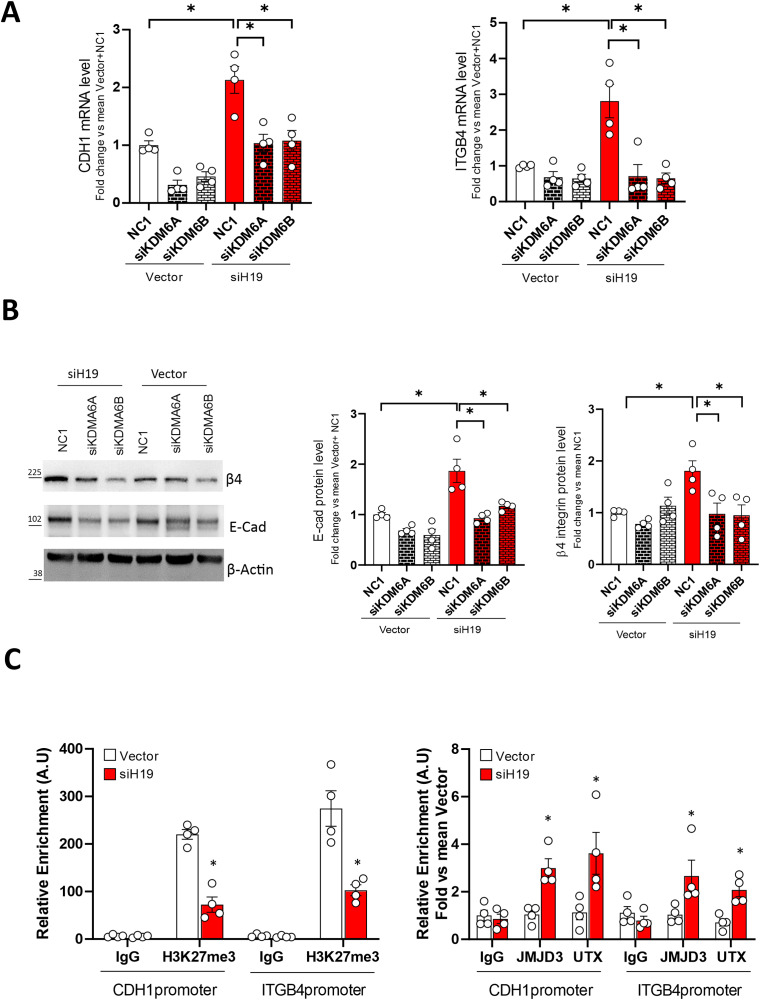
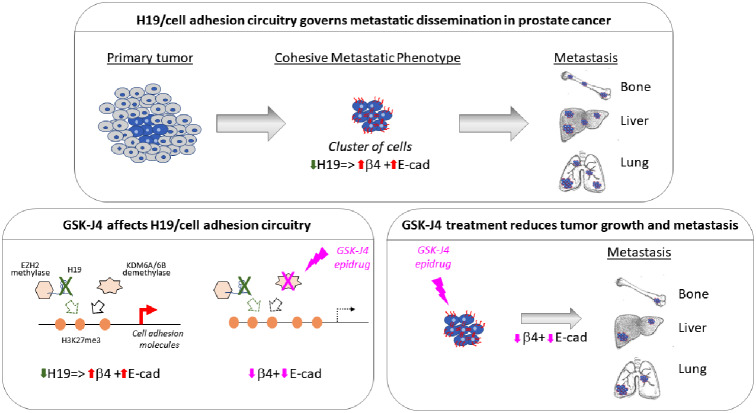
Background: About 30% of Prostate cancer (PCa) patients progress to metastatic PCa that remains largely incurable. This evidence underlines the need for the development of innovative therapies. In this direction, the potential research focus might be on long non-coding RNAs (lncRNAs) like H19, which serve critical biological functions and show significant dysregulation in cancer. Previously, we showed a transcriptional down-regulation of H19 under combined pro-tumoral estrogen and hypoxia treatment in PCa cells that, in turn, induced both E-cadherin and β4 integrin expression. H19, indeed, acts as transcriptional repressor of cell adhesion molecules affecting the PCa metastatic properties. Here, we investigated the role of H19/cell adhesion molecules circuitry on in vivo PCa experimental tumor growth and metastatic dissemination models.

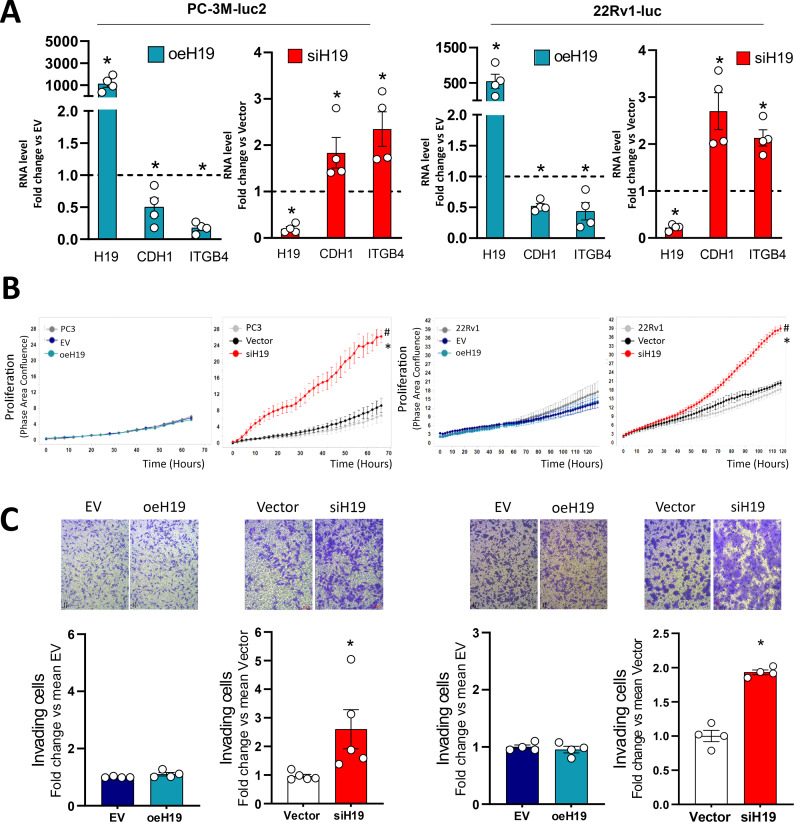
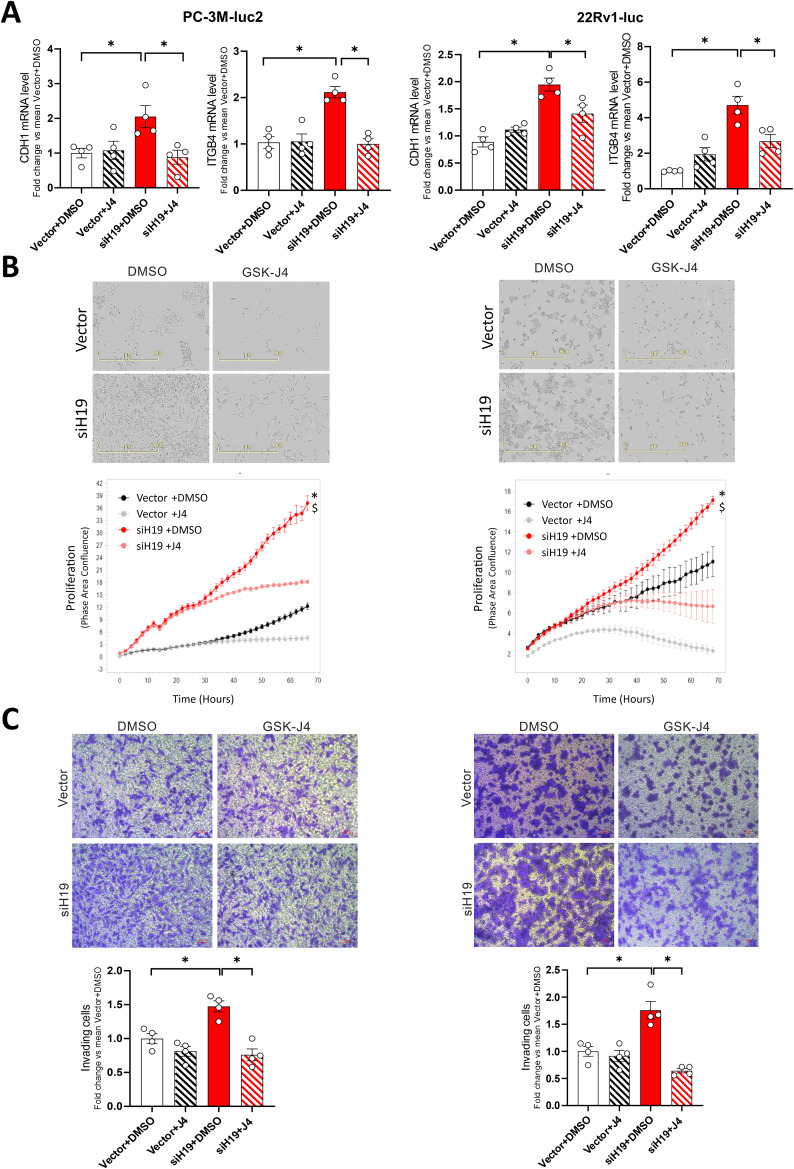
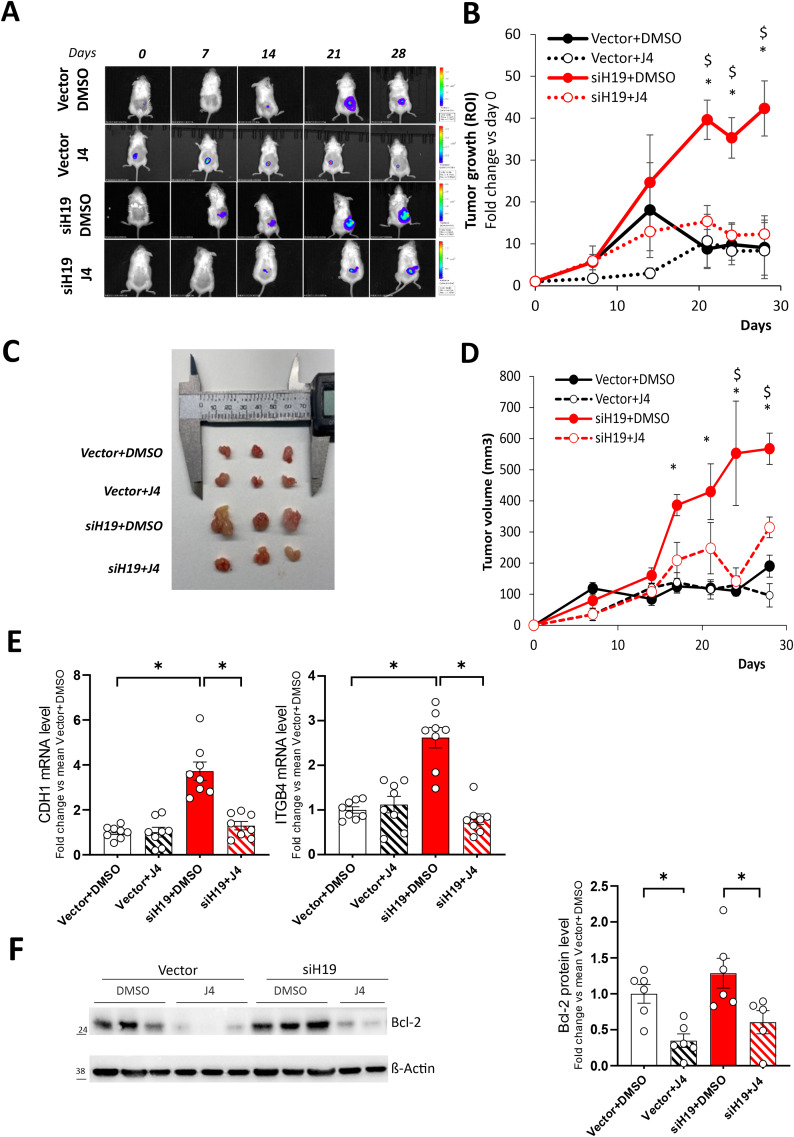
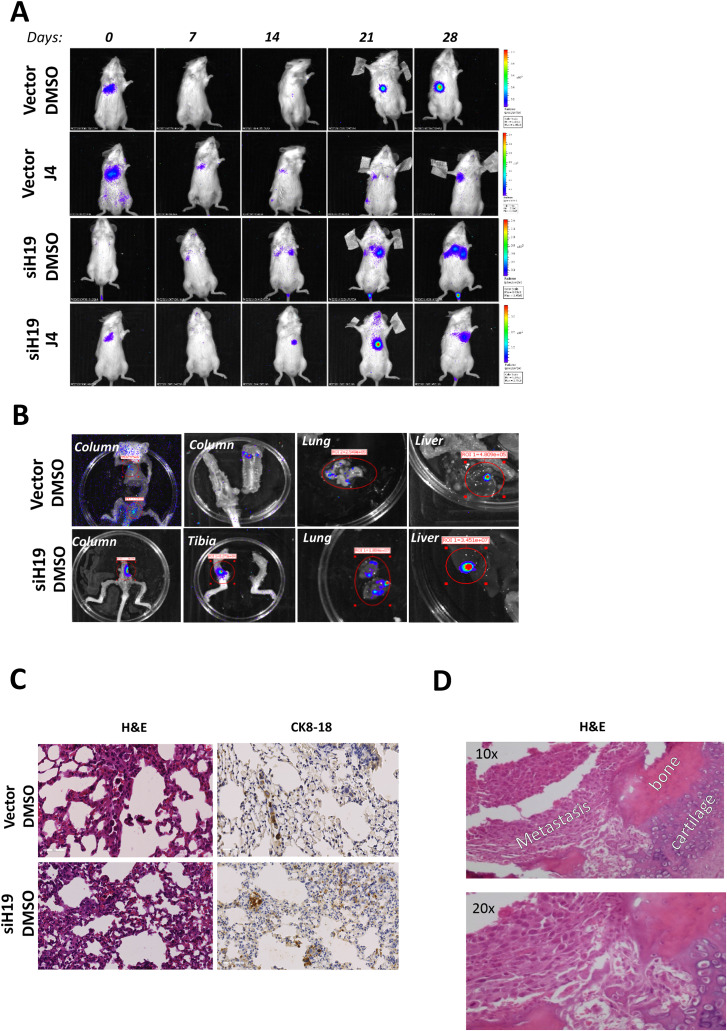
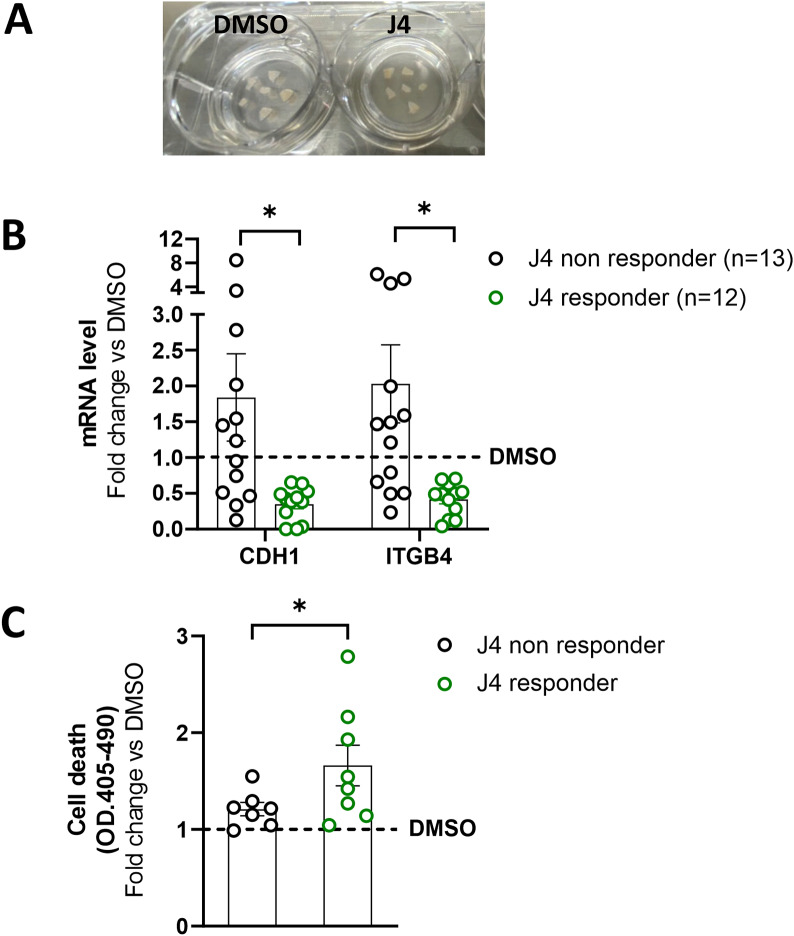
Methods: H19 was silenced in luciferase-positive PC-3 and 22Rv1 cells and in vitro effect was evaluated by gene expression, proliferation and invasion assays before and after treatment with the histone lysine demethylase inhibitor, GSK-J4. In vivo tumor growth and metastasis dissemination, in the presence or absence of GSK-J4, were analyzed in two models of human tumor in immunodeficient mice by in vivo bioluminescent imaging and immunohistochemistry (IHC) on explanted tissues. Organotypic Slice Cultures (OSCs) from fresh PCa-explant were used as ex vivo model to test GSK-J4 effects.

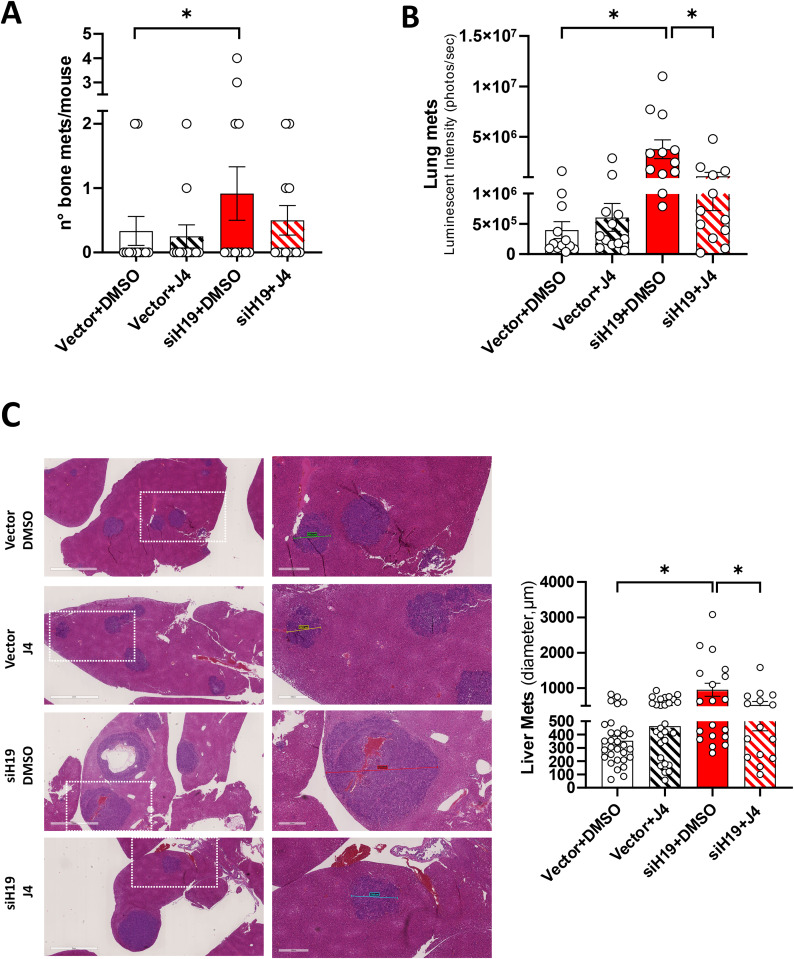
Results: H19 silencing in both PC-3 and 22Rv1 cells increased: i) E-cadherin and β4 integrin expression as well as proliferation and invasion, ii) in vivo tumor growth, and iii) metastasis formation at bone, lung, and liver. Of note, treatment with GSK-J4 reduced lesions. In parallel, GSK-J4 efficiently induced cell death in PCa-derived OSCs.

Conclusions: Our findings underscore the potential of the H19/cell adhesion molecules circuitry as a targeted approach in PCa treatment. Modulating this interaction has proven effective in inhibiting tumor growth and metastasis, presenting a logical foundation for targeted therapy.

Keywords: Lysine demethylase; Metastasis; Preclinical models; lncRNA.


Conflict of interest statement

The authors declare no competing interests.

Figures

Fig. 1
Fig. 1
Evaluation of in vitro metastatic potential in PC-3 and 22Rv1 cells after H19 silencing or overexpression. PC-3M-luc2 (left) and 22Rv1-luc (right) cells were subjected to lentiviral transduction to obtain stable H19 silencing (siH19) compared to scramble vector (Vector) and H19 overexpression (oeH19) compared to empty vector (EV). (A) H19, E-cadherin (CDH1), and β4 integrin (ITGB4) RNAs were assessed by qPCR. Data, plotted as fold change vs. Vector or EV (dashed line), represent the mean ± SEM of 4 independent experiments (white dots). *P < 0.05 vs. Vector or EV. (B) Proliferation assay at different time points. Cells were monitored using the IncuCyte live cell analysis system. Cell confluence was calculated from raw data images. Data represent the mean ± SEM of 3 independent experiments performed in triplicate. *P < 0.05 vs. Vector; # P < 0.05 vs. PC-3 or 22Rv1. (C) Trans well Cell invasion assay after 16 h. Upper panel: representative phase-contrast microscopic images of invading cells under 20X magnification (bright field). Scale bar: 20 μm. Lower panel: number of invading cells. Data plotted as fold change vs. mean vector represent the mean ± SEM of 4 independent experiments (white dots). *P < 0.05
Fig. 2
Fig. 2
Efficacy of GSK-J4 on cell adhesion molecules expression, proliferation, and invasiveness in siH19 cells. H19-silenced (siH19) or control (Vector) PC-3M-luc2 (left) and 22Rv1-luc (right) cells were treated for 72 h with GSK-J4 demethylases inhibitor (1µM) or DMSO as control. (A) CDH1 and ITGB4 mRNA levels were assessed by qPCR. Data plotted as fold change vs. mean Vector + DMSO represent the mean ± SEM of 4 independent experiments (white dots). (B) Cell proliferation was monitored using the IncuCyte live cell analysis system. Upper: raw data pictures of cell confluence exported from the IncuCyte system after 48 h incubation; scale bar is indicated; Lower: Cell confluence was calculated from raw data images; data shown is a representative experiment of 4 biological replicates, each time point represent the mean of 4 samples. *P < 0.05 vs. Vector + DMSO; $ P < 0.05 vs. siH19 + J4. (C) Cell invasion by Trans well assay. Upper: representative phase contrast microscopic images of invading cells under 20X magnification (bright field). Scale bar: 20 μm. Lower: number of invading cells. Data plotted as fold change vs. mean Vector + DMSO represent the mean ± SEM of 4 independent experiments (white dots). *P < 0.05
Fig. 3
Fig. 3
Effects of KDM6A and KDM6B silencing on cell adhesion molecules expression in siH19 cells. SiH19 and Vector cells were transfected with siRNA specific for KDM6A and KDM6B or scramble (NC1), and analysis was performed after 72 h. (A) CDH1 and ITGB4 mRNA levels were quantified by qPCR. Data are represented as mean ± SEM of fold change vs. mean Vector/NC1 cells of 4 independent experiments (white dots). *P < 0.05. (B) Representative E-Cad and β4-integrin western blot (left panels) and densitometry analysis (right panels) after KDM6A and KDM6B interfering. β-actin served as control. Molecular weight marker is indicated. Data are represented as mean ± SEM of fold change vs. mean Vector/NC1 cells of 4 independent experiments (white dots). *P < 0.05. (C) Enrichment of H3K27me3 (left) and recruitment of KDM6A/UTX and KDM6B/JMJD3 (right) on the promoter region of CDH1 and ITGB4 by ChIPs. IgG served as the negative control. Values represent the mean ± SEM of 4 independent experiments. Data are plotted as Relative enrichment relative to Input in Arbitrary Unit (A.U.) or fold vs. mean Vector. *P < 0.05 vs. Vector
Fig. 4
Fig. 4
Effect of GSK-J4 treatment on a subcutaneous xenograft mouse model of H19 silenced PC-3M-luc2 cells. (A) Sequential in vivo imaging of tumor growth post subcutaneous injection of siH19 and control Vector cells in NOD/SCID mice treated with GSK-J4 (J4) or vehicle (DMSO). Panels depict a representative mouse from each group. (B) Tumor growth was measured as photons/sec in the region of interest (ROI). Data plotted as fold change vs. day 0 represent mean +/- SEM of 8 mice/group. *P < 0.05 vs. Vector + DMSO; $ <0.05 vs. siH19 + J4. (C) Ex vivo photos of representative solid tumors on the day of the explant. (D) Tumor volume was evaluated by caliper measurements at the different time points and calculated as follows: V (mm3) = (W2 × L)/2. Data represent mean +/- SEM of 8 mice/group. *P < 0.05 vs. Vector + DMSO;$ <0.05 vs. siH19 + J4 (E) CDH1 and ITGB4 mRNA analyzed by qPCR in tumor samples. Data, represented as fold change vs. mean Vector + DMSO, represent the mean +/-SEM of 8 mice/group (white dots). *P < 0.05. (F) Representative western blot and relative densitometric analysis for bcl-2 in tumor samples. β-actin was used as a loading control. Molecular weight marker is indicated. Data plotted as fold change vs. mean Vector + DMSO represent mean ± SEM of 5-6 mice/group (white dots). *P < 0.05
Fig. 5
Fig. 5
Metastatic dissemination of PC-3M-luc2 cells after H19 silencing. (A) Sequential in vivo imaging of metastatic tumor dissemination over time post intravenous injection of siH19 and control Vector cells in NGS mice in the presence or absence of GSK-J4 (50 mg/kg) or DMSO as control (n = 12 mice/group). (B) Representative ex vivo bioluminescence images in different dissemination sites (column, tibiae, lung, and liver). (C) Representative sections H&E-stained (left) and IHC for human cytokeratin CK8-18 (right) sections of the lung with Vector and siH19 cells. Scale bar: 50 μm. (D) Representative H&E-stained sections of bone metastasis under 10X and 20X magnification. Metastatic cells, bone, and cartilage, are indicated.
Fig. 6
Fig. 6
Effects of GSK-J4 on a metastatic mouse model. Tumor metastatic dissemination post intravenous injection of siH19-PC-3 and Vector cells in presence or absence of GSK-J4 as in the legend to Fig. 5. (A) Number of bone metastasis (mets)/mouse. Data represent the mean +/- SEM of 12 mice/group (white dots). Statistical significance was determined by the Chi-square test, 2-tail, on the proportion of the number of mets/mouse. *P < 0.05. (B) Lung metastasis measured as photons/sec in Region Of Interest (ROI) on the day of explant. Data represent mean +/- SEM of 12 mice/group (white dots). (C) Representative H&E-stained sections of the liver. Dashed lines indicated the zoom area in the right panels. Color lines indicate metastasis diameter. Scale bars:2 mm and 500 μm. Right: Tumor growth measured in the liver as diameter (µm) on H&E staining. Data represent mean +/- SEM of 12 mice/group (2 or 3 metastasis/mouse, white dots). *P < 0.05
Fig. 7
Fig. 7
Effects of GSK-J4 on Organotypic Slices Cultures. (A) Representative images of OSC after 72 h treatment with GSK-J4 (J4, 5µM) or DMSO as control. (B) Quantification of CDH1 and ITGB4 transcripts by qRT-PCR (total OSC n = 25). OSCs were divided into J4-responder or J4-non responder according to a 25% reduction upon treatment. Data plotted as fold change vs. DMSO (dashed line) represent mean +/-SEM, and white dots indicate a single OSC. *P < 0.05 vs. DMSO. (C) Apoptosis induction upon GSK-J4 treatment evaluated using Cell Death Detection ELISA Kit as described in Methods. Data are expressed as fold change vs. DMSO (n = 15). P < 0.05 vs. DMSO
Fig. 8
Fig. 8
Role of H19/cell adhesion molecules in prostate cancer progression and its epigenetic targeting with reduction of tumor growth and metastasis dissemination

References

    1. Sung H, Ferlay J, Siegel RL, Laversanne M, Soerjomataram I, Jemal A, et al. Global Cancer statistics 2020: GLOBOCAN estimates of incidence and Mortality Worldwide for 36 cancers in 185 countries. CA Cancer J Clin&nbsp; 2021;71(3):209–49. doi: 10.3322/caac.21660. - DOI - PubMed
    1. Culp MB, Soerjomataram I, Efstathiou JA, Bray F, Jemal A. Recent global patterns in prostate Cancer incidence and mortality rates. Eur Urol. 2020;77(1):38–52. doi: 10.1016/j.eururo.2019.08.005. - DOI - PubMed
    1. Freedland SJ, Humphreys EB, Mangold LA, Eisenberger M, Dorey FJ, Walsh PC et al. Risk of prostate cancer-specific mortality following biochemical recurrence after radical prostatectomy. JAMA. 2005;294(4):433–9. - PubMed
    1. Daher M, Telvizian T, Dagher C, Abdul-Sater Z, Massih SA, Chediak AE, et al. High rates of advanced prostate cancer in the Middle East: analysis from a tertiary care center. Urol Ann. 2021;13(4):418–23. doi: 10.4103/UA.UA_47_20. - DOI - PMC - PubMed
    1. Manna FL, Karkampouna S, Zoni E, De Menna M, Hensel J, Thalmann GN et al. Metastases in prostate cancer. Cold Spring Harb Perspect Med. 2019;9(3):a033688. - PMC - PubMed

LinkOut - more resources